Marketplace data model: a free two-sided template
A marketplace model has to do something an ordinary e-commerce model doesn’t: describe two independent populations — buyers and sellers — and the moment they meet. Get it right and questions like “what’s our search-to-order conversion by category?” or “what’s our real take-rate?” are one query away. Get it wrong and you can measure GMV but never explain it.
This page gives you a free, ready-made marketplace data model you can open in your browser, edit like a diagram, and export to OKF — Google’s open, portable format. No sign-up. It’s one of nine in our data model template gallery; this one is built for two-sided platforms.
What makes a marketplace model different
What makes a marketplace model different
A single-store e-commerce model has one customer population and one catalog you control. A marketplace has supply and demand as separate things you have to grow and measure independently — sellers who list, buyers who search, and a match (the order) that only happens when both sides line up.
That changes the modeling job. You’re not just recording sales; you’re recording demand that didn’t convert (searches with no order), supply that didn’t sell (listings with no order), and the liquidity between them. The template is a dimensional model — a Kimball-style star — shaped around that match. New to the vocabulary? Our guide to data modeling and understanding star schema are good companions.
The marketplace template, mart by mart
The marketplace template, mart by mart
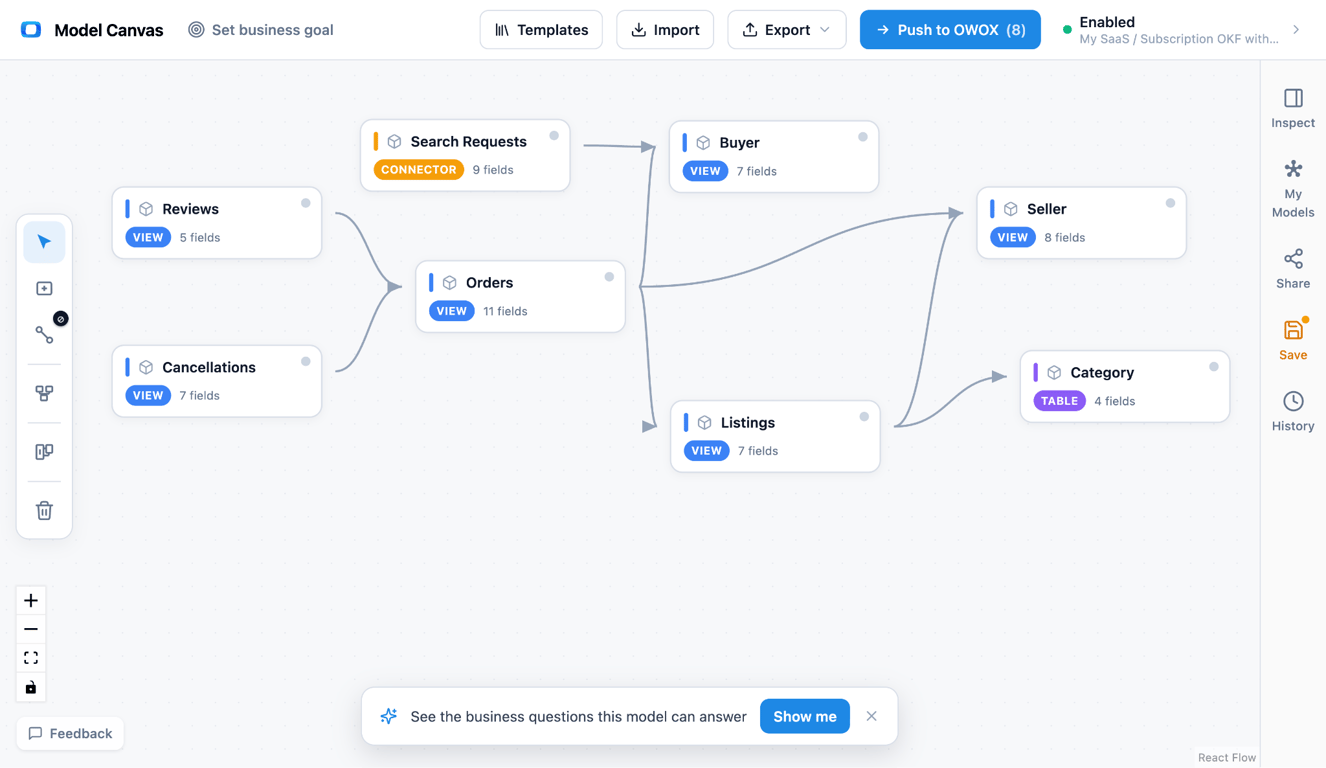
The template is six data marts — two dimensions and four facts — wired so supply and demand meet at the order. Here’s the whole thing.
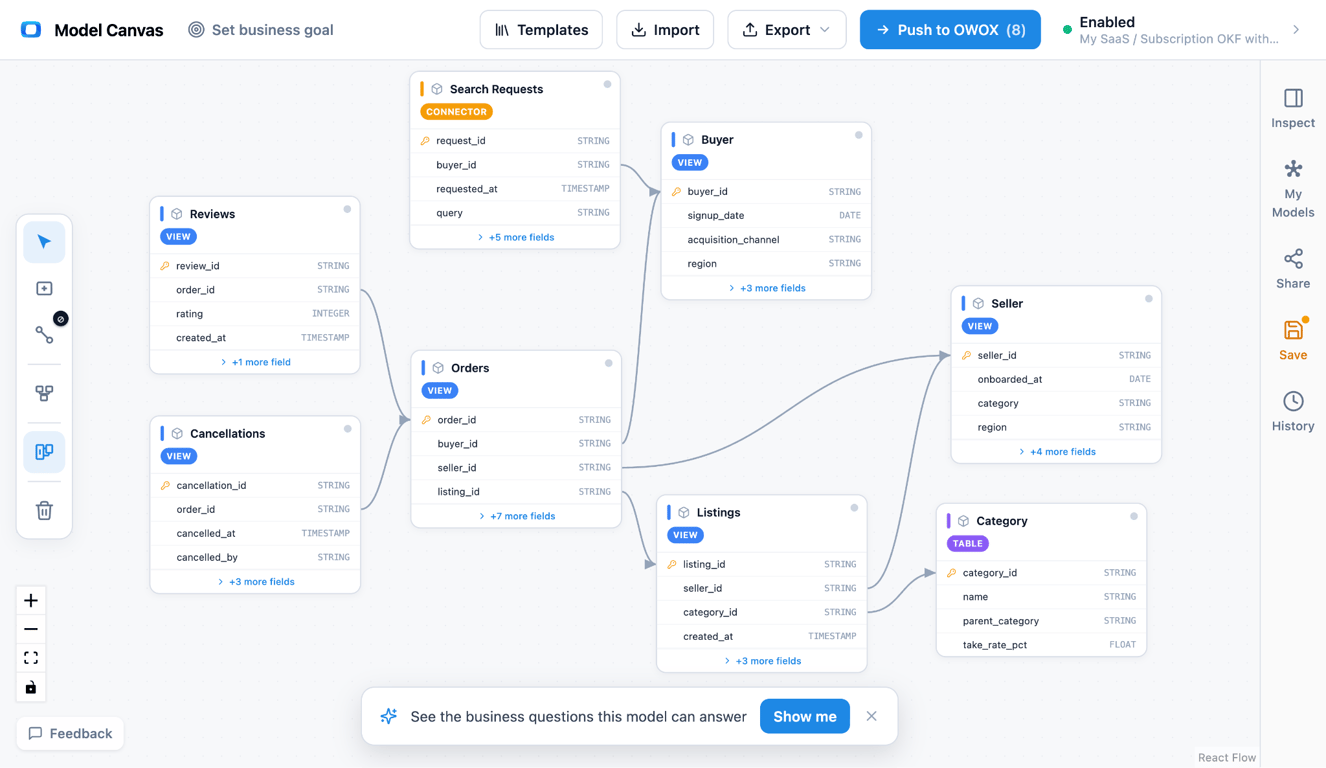
Entity relationship diagram of a two-sided marketplace data model: Buyer and Seller dimensions joined to Listings, Search Requests, Orders, and Reviews fact tables. Open the marketplace model in the canvas →
• Buyer (dimension) — one row per buyer: acquisition channel, first-order date, region, and repeat flag. The demand population.
• Seller (dimension) — one row per seller: onboarding date, category, rating, and activation flag. The supply population.
• Listings (fact) — one row per listing, joined to Seller: the supply inventory, with category, price, and availability. Modeling listings as their own table is what lets you measure supply that never sold.
• Search Requests (fact) — one row per search: the demand signal, joined to Buyer, with query, category, and result count. This is the top of the liquidity funnel.
• Orders (fact) — one row per transaction: GMV, fee, and take-rate, joined to Buyer and Listings (and through Listings, to Seller).
• Reviews (fact) — one row per review, joined back to Orders, for the trust signal both sides care about.
The joins make it a star around the match: Listings → Seller, Search Requests → Buyer, Orders → Buyer and Orders → Listings, Reviews → Orders. Every table is a reporting-ready data mart in the sense we describe in our approach to data marts.
OWOX Data Marts
See your first report built in real time. 15 minutes.
- Connect your data warehouse
- Pick your metrics
- Get a live Google Sheets report
In the time it takes to write a ticket. Then imagine never writing that ticket again.
Book a DemoWe'll use your actual use case
The liquidity funnel (the centerpiece)
The liquidity funnel (the centerpiece)
If you take one idea from this template, take this: model the search and the listing, not just the sale.
Most marketplace dashboards start at the order — which means they can tell you what sold but never what didn’t. By landing Search Requests as a fact (demand) and Listings as a fact (supply), you can reconstruct the whole liquidity funnel: searches → searches with results → searches that led to an order, and listings → listings that sold. That ratio — search-to-order conversion — is the single best measure of marketplace health, and it’s invisible if orders are your only fact.
Because supply and demand are separate marts, you can measure each side on its own (active buyers, active sellers, live listings) and then the match between them (fill rate, time-to-match). This is classic transaction-grain fact-table thinking — see the three types of fact tables and dimensional data modeling.
What this model answers
Because both sides and the match are modeled, the hard marketplace questions become joins:
• Search-to-order conversion (liquidity) — Search Requests against the Orders that follow.
• Real take-rate by category — Orders (fee ÷ GMV), rolled up through Listings → Seller.
• Supply and demand health — active sellers and live listings vs active buyers and searches.
• Time-to-match — the gap between a listing going live and its first order.
• Trust effects — Reviews joined to seller repeat-sales and buyer repeat-purchase.
None of these need a new table. They’re different paths across the same six data marts.
Marketplace model vs single-store e-commerce model
Marketplace model vs single-store e-commerce model
A common first question: “isn’t this just the e-commerce template with a Seller table?” Not quite. The difference is that a marketplace has to measure two populations and the friction between them, so demand (searches) and supply (listings) are first-class facts — not an afterthought.
| Aspect | Single-store e-commerce | Two-sided marketplace (this template) |
|---|---|---|
| Populations | One (customers) | Two (buyers and sellers) |
| Supply | Your own catalog | Sellers’ listings (a fact you grow and measure) |
| Key metric | Revenue, margin | Liquidity (search-to-order), take-rate, GMV |
| Demand signal | Web sessions | Search Requests (modeled explicitly) |
| Export | OKF + diagram image | OKF + diagram image |
If a single-sided store is closer to your business, open the e-commerce data model instead.
How to open and customize the template
How to open and customize the template
Opening the template and shaping it to your platform takes about two minutes, then as long as you want to refine.
(1) Open it. Use the link under the diagram above. It loads in your browser with no sign-up.
(2) Reshape it. Add fields (dispute status, shipping SLA, seller tier), or split Search Requests by device; redraw joins on the canvas.
(3) Set grain and keys. Confirm Search Requests is one row per search, Listings one row per listing, and Orders one row per transaction — and the keys that tie each fact to Buyer, Seller, and Listings.
(4) Export it. Use Export → OKF for a portable model, or grab a diagram image. Keep the OKF in git or push it into OWOX Data Marts to make it live in your warehouse.
Comparing tools while you’re here? Our roundup of free database diagram design tools puts the canvas in context.
Export to OKF: a portable marketplace model
Export to OKF: a portable marketplace model
The reason this beats a static ER picture is what happens after the diagram. A drawing can’t be diffed or fed to a warehouse.
This template exports to OKF (Open Knowledge Format), Google’s open, markdown-based standard. Because it’s plain text, you can keep the model in git, review it in a pull request, and hand it off without lock-in. New to it? See our explainer on what OKF is, then open the marketplace model and export your own.
Ask this model a question
The template above is a diagram you can edit. The same business is also published as a ready Marketplace Data Model of 8 Data Marts with their relationships, which can be imported into OWOX Data Marts. Once it is in your project, a business user can ask it a question in Claude or ChatGPT through the OWOX MCP server.
Data Model: Marketplace (8 Data Marts)
Prompt: “How much of booked GMV never settled last quarter, and which categories lose the most to cancellations?”
The reason to ask the Data Model and not the warehouse is what the assistant gets to read.
| Asked of raw tables | Asked of the Data Model | |
|---|---|---|
| What the assistant sees | Every table in the warehouse | The published Data Marts and their declared joins |
| What it does | It sums order value across all orders and reports it as GMV and platform revenue, cancelled orders included | It reads the Orders Data Mart, where a cancelled order keeps its booked GMV while net GMV, platform revenue and seller payout are zero |
| What you get | A plausible number with no way to check it | The number, and the query that produced it |
MCP is only the way the question arrives. What makes the answer safe is the Data Mart behind it: SQL an analyst wrote and published, which the assistant reads and does not write. A question the Data Marts do not cover is not approximated. It goes back to the data owner. More on how that works in governed MCP analytics.
Turn your data into decisions.
Governed data marts give you the clean foundation ML needs to actually work.
- No AI hallucinations
- Analyst-governed definitions
- Every number traces to SQL
Frequently Asked Questions
Can I adapt it to a services or rental marketplace?
Yes. Rename Listings to the unit you offer (a service slot, a rentable asset) and keep the same shape — the two-sided funnel logic holds.
Is the template free, and what can I export?
Yes, free with no sign-up. Export the model as OKF or a diagram image. An OWOX account is only needed to push the model into OWOX Data Marts.
What is the grain of the orders vs search requests table?
Orders is one row per transaction; Search Requests is one row per search. Keeping searches at their own grain is what lets you see demand that didn't convert.
What is marketplace liquidity, in data terms?
Liquidity is how reliably demand finds supply — best measured as search-to-order conversion. Modeling Search Requests and Listings as their own facts is what makes it computable.
What is take-rate and how do you model it?
Take-rate is the platform's fee as a share of GMV. Model it on the Orders fact (fee and GMV per transaction) so it rolls up cleanly by category, seller, or period.
How do you model a two-sided marketplace?
Model supply and demand as separate marts — Sellers and their Listings on one side, Buyers and their Search Requests on the other — that meet at an Orders fact. That lets you measure each side independently and the liquidity between them.
What tables are in a marketplace data model?
For analytics: Buyer and Seller dimensions, plus four facts — Listings (supply inventory), Search Requests (demand), Orders (the match, with GMV and take-rate), and Reviews. The two-sided shape is what distinguishes it from a single-store model.