Tables in Google Sheets: how to create, format and reference them
A table in Google Sheets is a range that has been given a name, a header row with menus, a type for each column and a format. It grows when rows are added, and formulas can refer to its columns by name. This guide shows how to convert data to a table, what the column types and views do, how table references work, and when a plain range is the better choice.
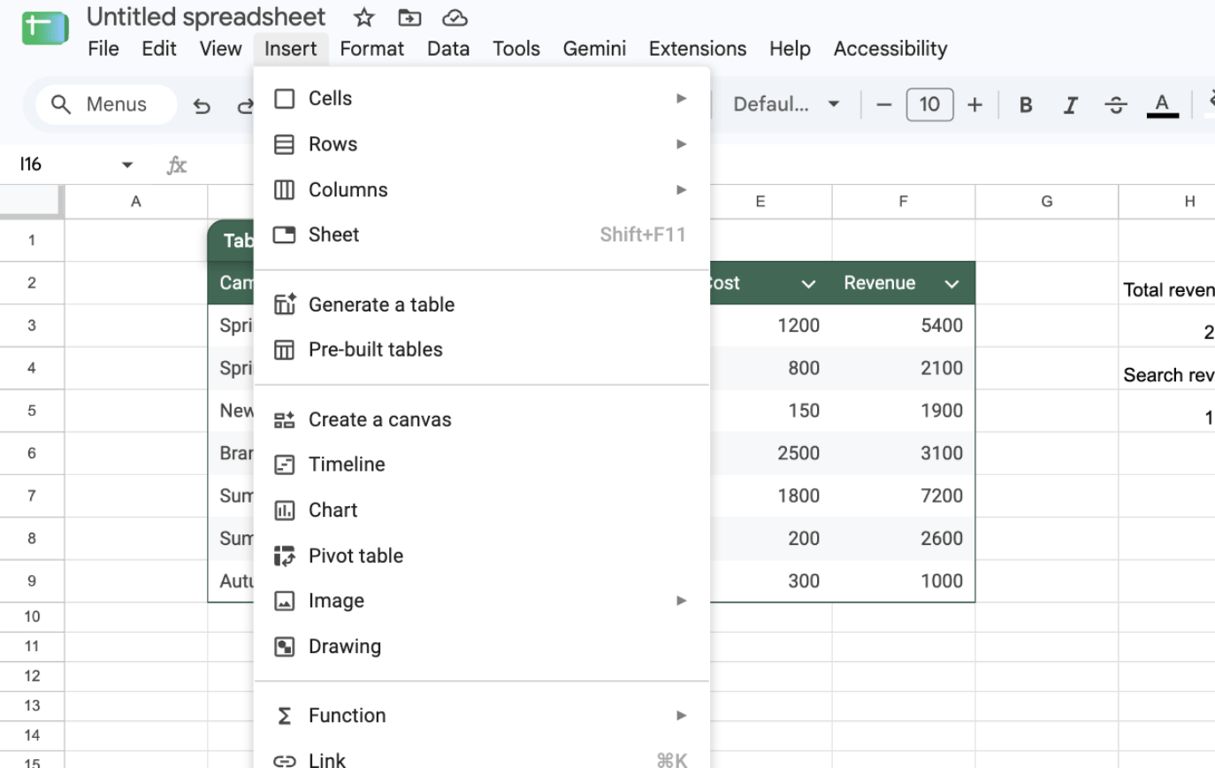
A table in Google Sheets is a range with a name, a header row that carries menus, a type for each column and its own format. To make one, select the data and choose Format > Convert to table. The menu shows the keyboard shortcut next to the command, ⌘+Option+T on a Mac.
Three things change compared with a plain range:
- Structure. Each column gets a type, such as number, date or dropdown, and Sheets warns about values that do not fit it.
- A name. Formulas can refer to
Table1[Revenue]instead of F3:F9. - Growth. A row typed directly under the table becomes part of it, and formulas that refer to the table include it.
Google added tables to Sheets in 2024.
How to create a table
From existing data
- Select the range, with its header row.
- Choose Format > Convert to table.
- Check the type that Sheets picked for each column.
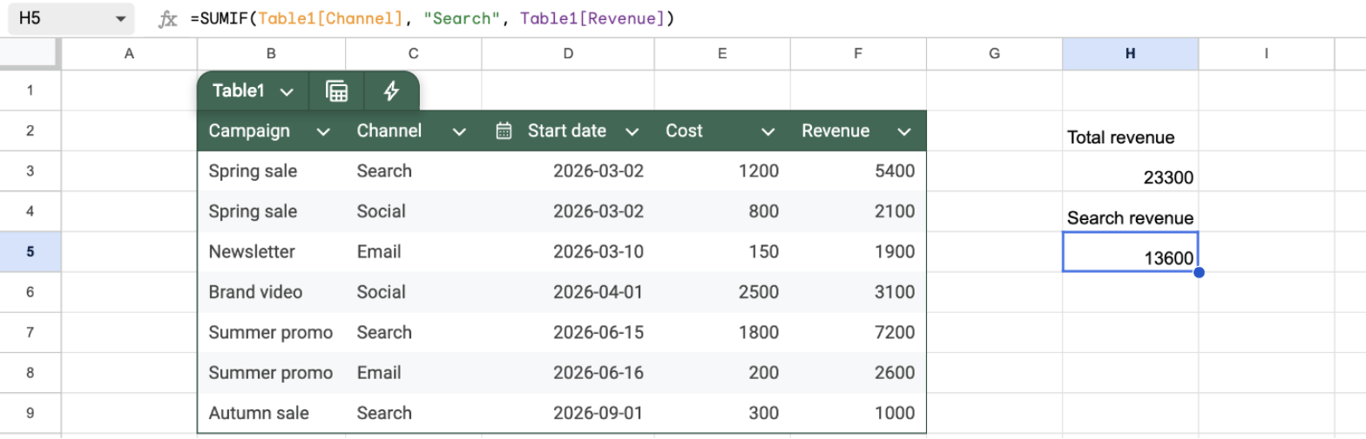
In our test, a range of seven rows became Table1 at once: the header row turned dark green with a menu arrow in every column, the rows got alternating colours, and the date column was recognized as a date and marked with a calendar icon.
From a pre-built table
Insert > Pre-built tables opens a side panel with ready structures for common tasks: project tasks, event planning, inventory, recruitment, content tracking and others. Each one inserts an empty table with typed columns and placeholder values.
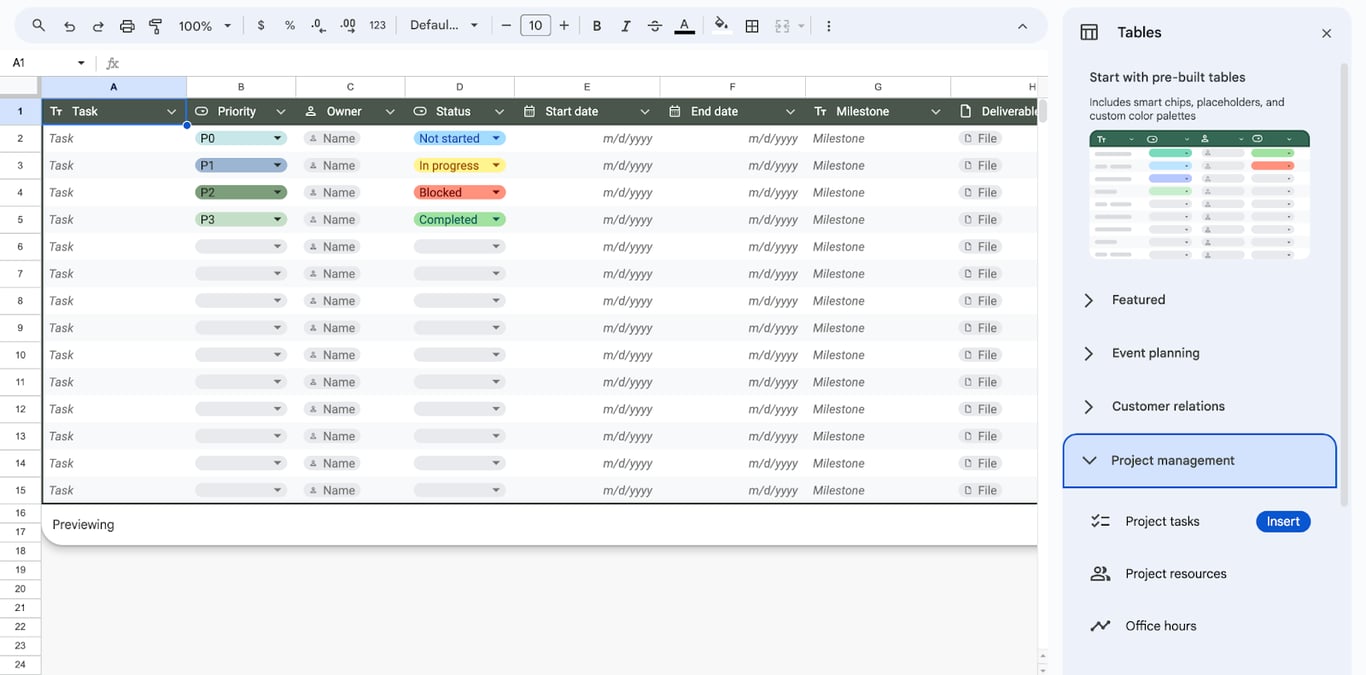
A pre-built table is a starting layout, not a feature of its own. Columns can be renamed, retyped, added and deleted like in any table.
Column types
Open the menu in a column header and choose Edit column type.
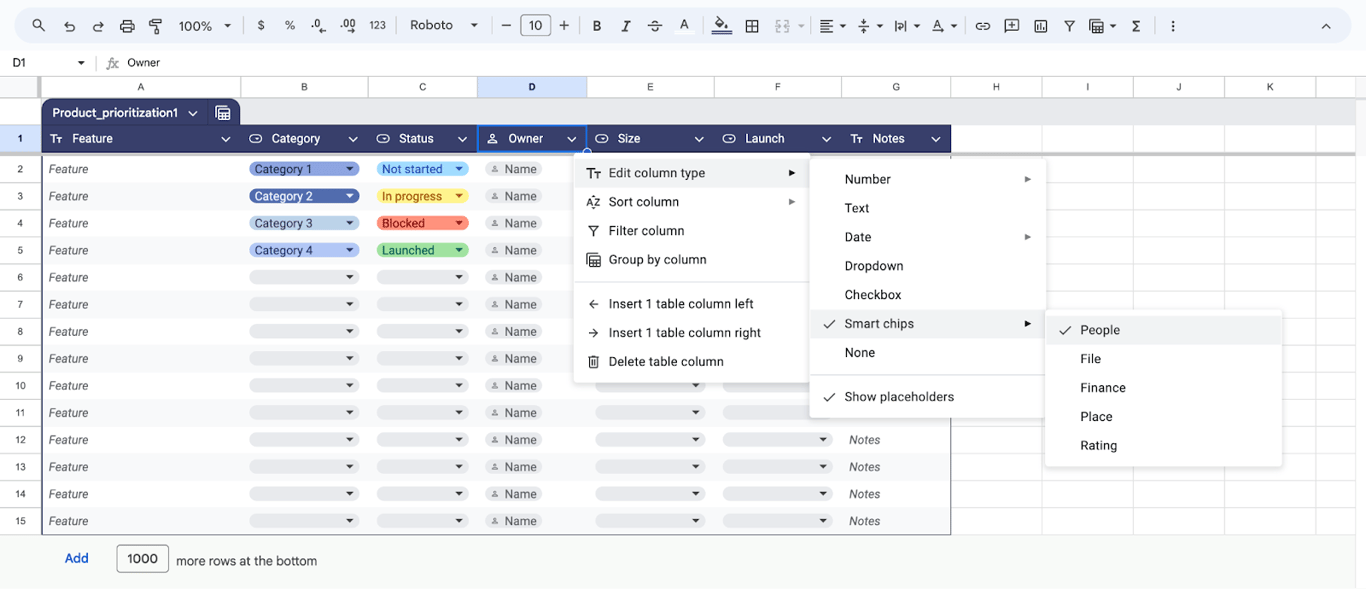
According to Google’s help, the types are:
- Number: number, percentage or currency.
- Text.
- Date: date, date and time, or time.
- Dropdown: a list of allowed values, shown as coloured chips.
- Checkbox.
- Smart chips: people, file, finance, place or rating.
- None: no type, for a column that mixes kinds of values.
The type formats the column and checks it. A text typed into a date column gets a warning mark. This is the same mechanism as data validation, applied to a whole column in one step.
The same menu sorts and filters the column, groups the table by it, and inserts or deletes columns.
OWOX Data Marts
See your first report built in real time. 15 minutes.
- Connect your data warehouse
- Pick your metrics
- Get a live Google Sheets report
In the time it takes to write a ticket. Then imagine never writing that ticket again.
Book a DemoWe'll use your actual use case
The table menu
The arrow next to the table name opens the settings of the table. Google’s help lists:
- Rename table.
- Adjust table range.
- Table header color.
- Table formatting: gridlines, alternating colours, a condensed view, a footer row. More options are under Format > Table formatting.
- Revert to unformatted data: turns the table back into a plain range and keeps the data.
- Delete table: removes the table together with its data.
Note the difference between the last two.
Rules for table names
A table name cannot start with a number, cannot look like a cell reference such as A1, cannot be TRUE or FALSE, cannot be longer than 255 characters, and cannot contain special characters other than the underscore. A space in the name becomes an underscore in formulas: “Table 1” is written Table_1.
Filter and group with views
The second button next to the table name creates a view: a way of looking at the table that does not change it for other people.
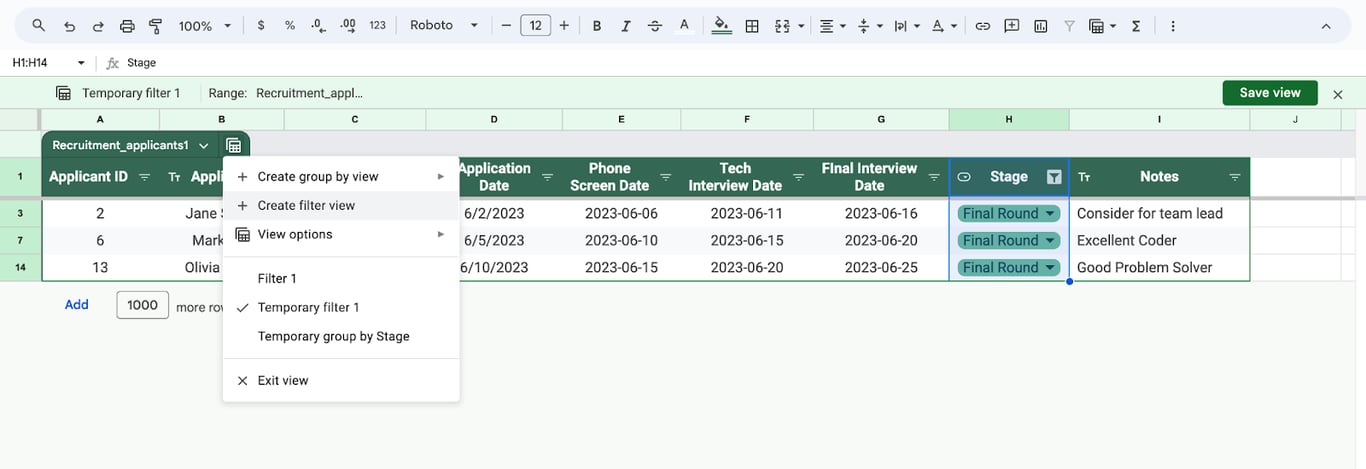
- A filter view shows only the rows that meet the conditions set in the column menus.
- A group by view puts the rows under a heading for each value of one column.
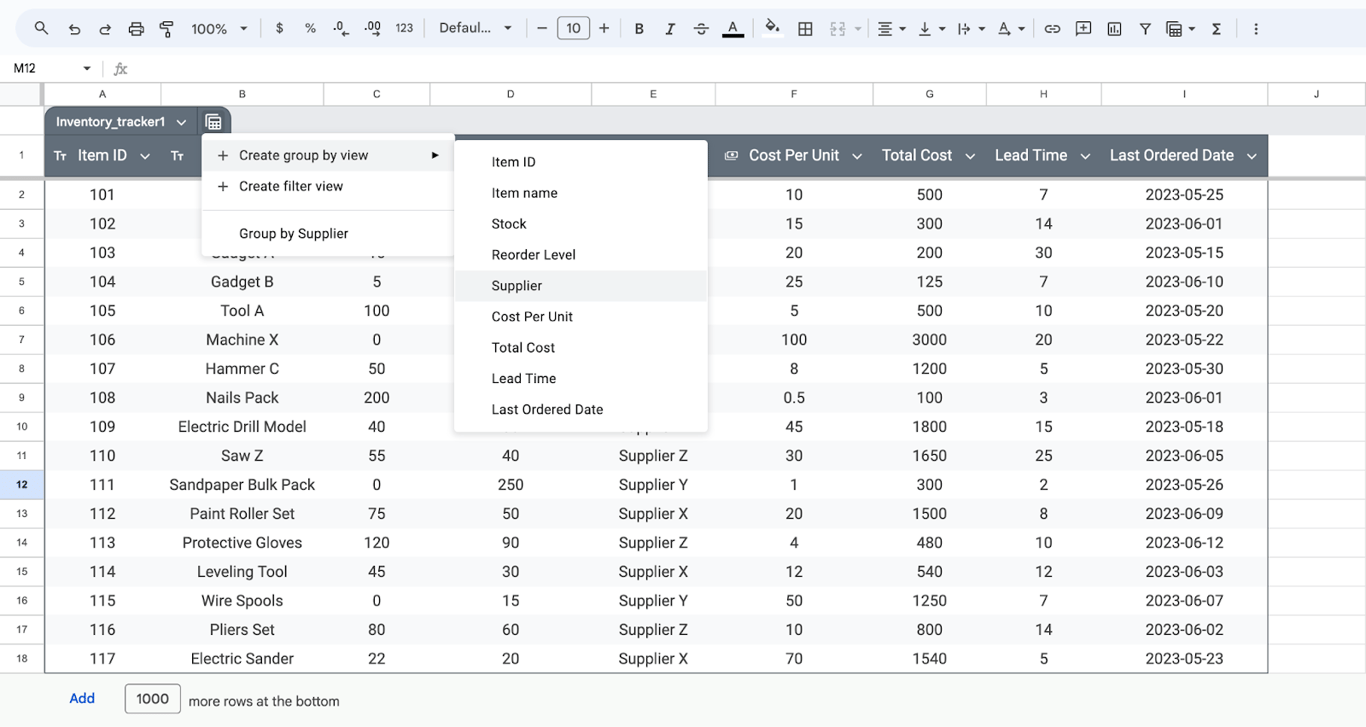
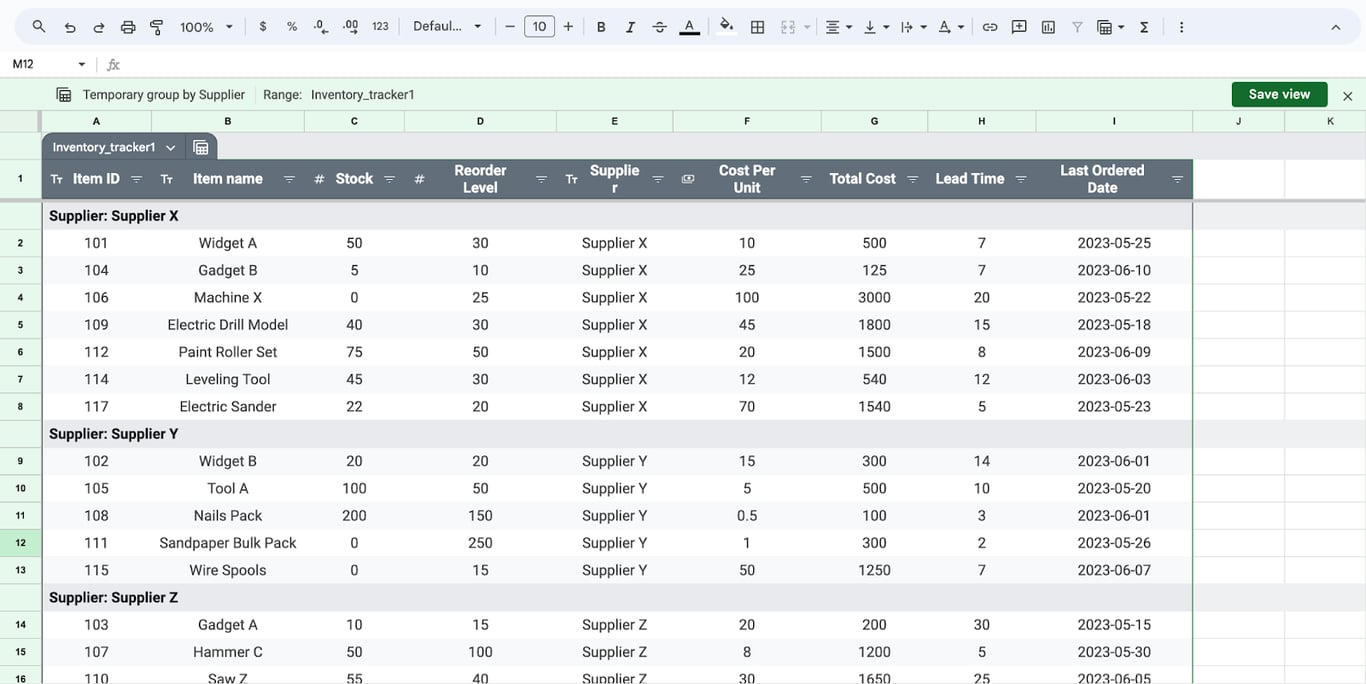
A new view is temporary and disappears when the spreadsheet is refreshed. With edit access, Save view keeps it in the table menu. In a group by view, each column can show an aggregation for every group: sum, average, count, minimum, maximum, the number of unique values and others.
Table references in formulas
A formula can name the table and the column instead of giving a range:
=SUM(Table1[Revenue])
=SUMIF(Table1[Channel], "Search", Table1[Revenue])
In our test table, the first formula returned 22300. After a row was typed directly under the table, it became part of the table and the same formula returned 23300 with nothing edited. The second formula changed from 12600 to 13600 the moment the new row got the channel “Search”.
Table1[Revenue]is the data of one column, without the header.Table1is all the data rows.=ROWS(Table1)returned 7 for seven rows of data under one header row.
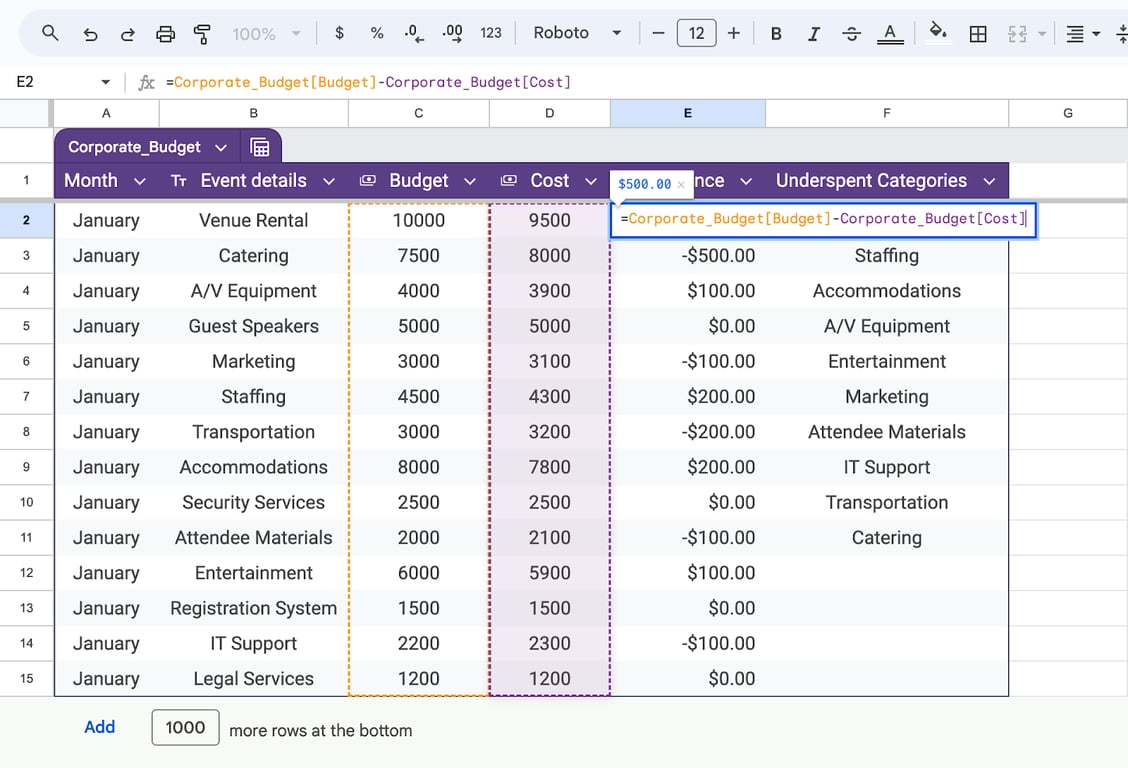
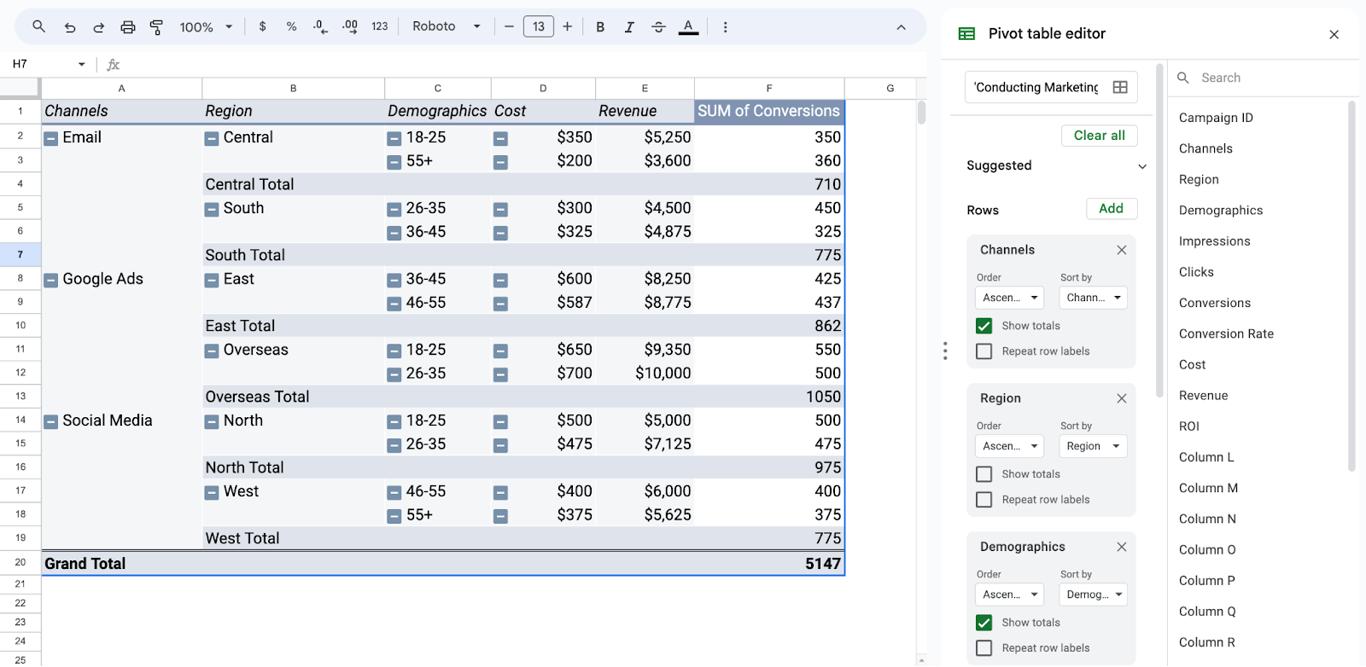
A table reference goes where a range would go; we tested SUM, SUMIF, COUNTA and ROWS. Google’s help adds that references by name update whenever data is added to or removed from the table. A pivot table is built on a table like on any other range:
Table, range or named range
| Plain range | Named range | Table | |
|---|---|---|---|
| Reference in formulas | B2:F9 | A name for the whole range | A name for the table and for each column |
| Grows with new rows | No | No, the range is edited by hand | Yes |
| Column types and checks | Set by hand with data validation | Set by hand | Built in |
| Header with sort, filter and group menus | After a filter is created | No | Built in |
| Format | Set by hand | Set by hand | Applied with the table |
When a table is not the right choice
When a table is not the right choice
- The result of a formula. A range filled by QUERY, FILTER or another formula that expands is produced by its formula; keep it a plain range.
- A layout that is not a list. A table expects one header row and one record per row. Reports with subtotals between the rows, merged cells or several blocks side by side do not fit.
- A sheet that other tools write into. Before converting a range that an add-on or a script fills, check that the tool still writes where you expect.
- Free-form notes. Types and checks get in the way when a column holds whatever comes.
Converting back is one click, Revert to unformatted data, so trying a table costs little.
Related guides
- Pivot tables: Summarize a table by groups.
- Data validation: Dropdowns and rules outside tables.
- How to sort data: Sorting ranges and tables.
- Slicers: Filters for charts and pivot tables.
- QUERY: Filter and group with a formula.
- Charts: Visualize the data of a table.
A table organizes what people type; reporting data needs a source
A table organizes what people type; reporting data needs a source
Tables are built for data that lives in the sheet: tasks, plans, lists that people keep by hand. Spend, orders and revenue are a different kind of data. They live in other systems, and pasting exports of them into a table makes a tidy copy that is out of date the next day.
The OWOX Data Marts extension for Google Sheets covers that half. A data analyst publishes a data mart (a table or an SQL query in your data warehouse) and makes it available for reports. In Sheets you open the extension, pick the data mart, tick the columns you want and run it. The rows land in a tab, ready for your formulas.
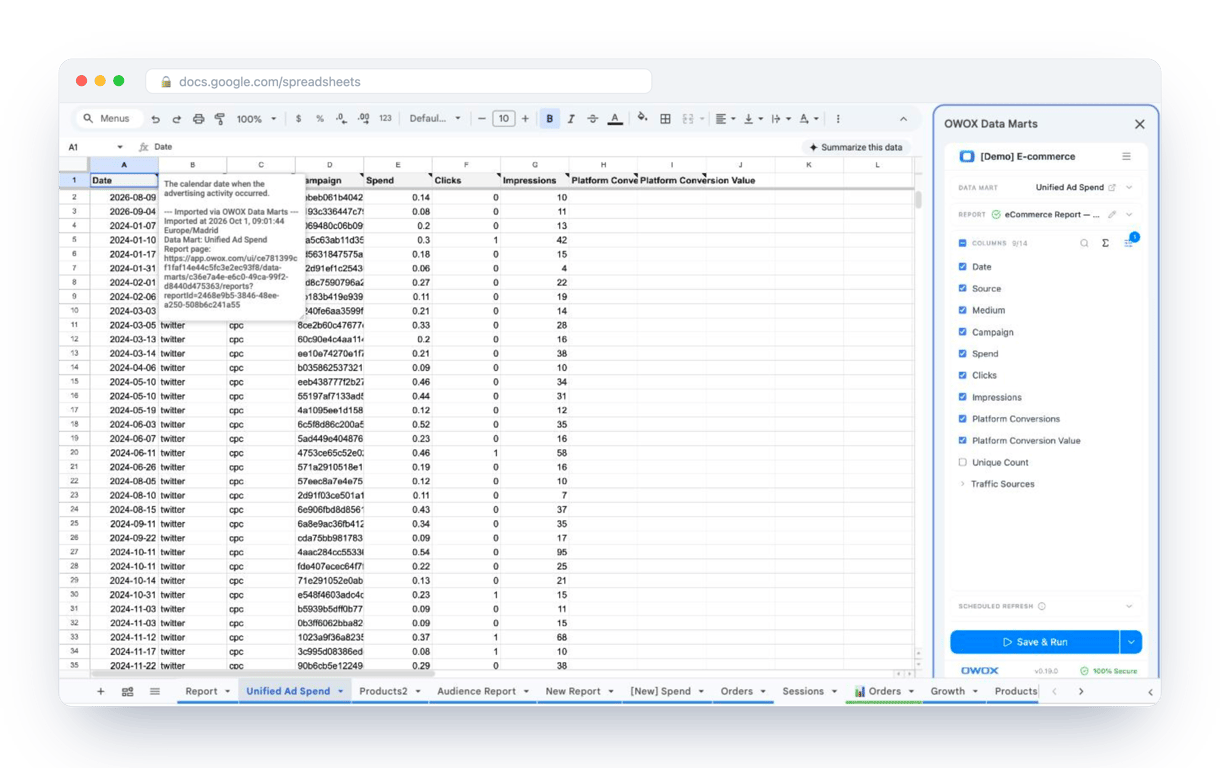
What changes for the person who maintains the sheet:
- Refresh replaces re-export. Refresh current report in the extension menu re-runs the same pull, and a scheduled refresh keeps the tab current without anyone touching it.
- The source is written on the sheet. The header cell of an imported tab carries a note with the data mart it came from, the time of the import and a link to the report.
- No SQL and no warehouse access needed. The analyst decides which data marts and columns are available. You choose from that list.
The extension does not write or change the analyst’s SQL. Tables then hold what the team maintains by hand, and the numbers next to them come from the warehouse. The extension comes with the OWOX Cloud plans of OWOX Data Marts; spreadsheet reporting describes both ways data reaches a sheet.
Turn your data into decisions.
Governed data marts give you the clean foundation ML needs to actually work.
- No AI hallucinations
- Analyst-governed definitions
- Every number traces to SQL
Frequently Asked Questions
How can I use the new tables feature for project management or financial analysis?
The new tables feature can streamline project management by tracking tasks and resources, and enhance financial analysis by organizing and categorizing financial data.
Are there limitations to the new tables feature in Google Sheets?
A table expects one header row and one record per row, so layouts with subtotals between rows, merged cells or several blocks side by side do not fit. Deleting a table removes its data too; to keep the data, use Revert to unformatted data. Conditional notifications on tables are available only to certain work or school accounts, according to Google's help.
What are the key benefits of the 'Group By' option in Google Sheets tables?
The 'Group By' option helps summarize data efficiently, providing insights at a glance and improving data visualization.
Can Google Sheets tables be integrated with other tools for enhanced functionality?
Yes. A table is still a range of cells: formulas, charts and pivot tables can be built on it, and table references such as =SUM(Table1[Revenue]) keep working as rows are added.
How does the new tables feature improve data analysis in Google Sheets?
It simplifies data management with quick formatting, column types, and integrated filtering and sorting options, making it easier to analyze large datasets.
What is the new tables feature in Google Sheets?
A table is a range that has a name, a header row with sort, filter and group menus, a type for each column and its own format. Create one with Format > Convert to table, or insert a ready structure with Insert > Pre-built tables.