
How to Normalize Ad Spend Across Currencies for Free in Google Sheets
Step-by-step guide to unify multi-currency ad costs in Google Sheets, with free connectors and automated exchange rates for accurate reporting.


How do you compare ad spend when every platform uses a different currency? Whether your Google Ads run in USD, Facebook campaigns in EUR, or TikTok ads in INR, inconsistent currencies make reporting painful. ROI, pacing, and budget tracking break down fast without one clear cost view.
.png)
In this guide, you’ll learn a free, reliable way to normalize multi-currency ad spend using Google Sheets. No paid tools. No manual exports. Just open-source connectors, exchange rate data, and step-by-step formulas to turn chaos into clarity, perfect for data analysts, media buyers, and marketing managers who want better numbers without more hassle.
Why Normalizing Multi-Currency Ad Spend Matters
Tracking ad spend across currencies isn’t just a reporting headache; it directly affects how clearly you measure performance, pacing, and ROI. Here’s why normalization is essential.
Delivers Clarity in Cross-Platform Performance Tracking

When every ad platform reports spend in its own currency, comparing performance becomes a matter of guesswork. Normalizing currencies removes that confusion. It lets you line up costs from Facebook, Google Ads, TikTok, LinkedIn, and others on a single scale, so you can accurately measure which campaigns deliver the best value. Consistent reporting across currencies leads to better optimization decisions and fewer surprises in your dashboards.
Protects the Accuracy of ROI and Pacing Metrics
ROI and budget pacing lose meaning when your spend data is split across currencies. A campaign might look efficient in isolation, but could be overspending once converted. Normalizing all costs to one base currency gives you a true view of performance. It ensures your ROI, budget pacing, and efficiency metrics are accurate, so you don’t end up misallocating spend or missing targets due to inconsistent data.
Creates a Single Source of Truth for Decision-Makers
When ad spend is normalized into one currency, leadership no longer has to reconcile inconsistent numbers across platforms. Finance teams, CMOs, and stakeholders get a clean, reliable view of marketing performance they can trust. This unified view supports faster decisions, clearer budget planning, and less back-and-forth over which numbers are “right.
Key Requirements Before You Begin Currency Normalization
Before you start normalizing ad spend, you need a few essential components in place. Here’s what to prepare to ensure your workflow runs smoothly from the start.
Access to Ad Platform Data via OWOX Connectors
Start by pulling ad spend data from platforms like Facebook, TikTok, LinkedIn, Twitter, and Google Ads using OWOX’s free Google Sheets connectors.
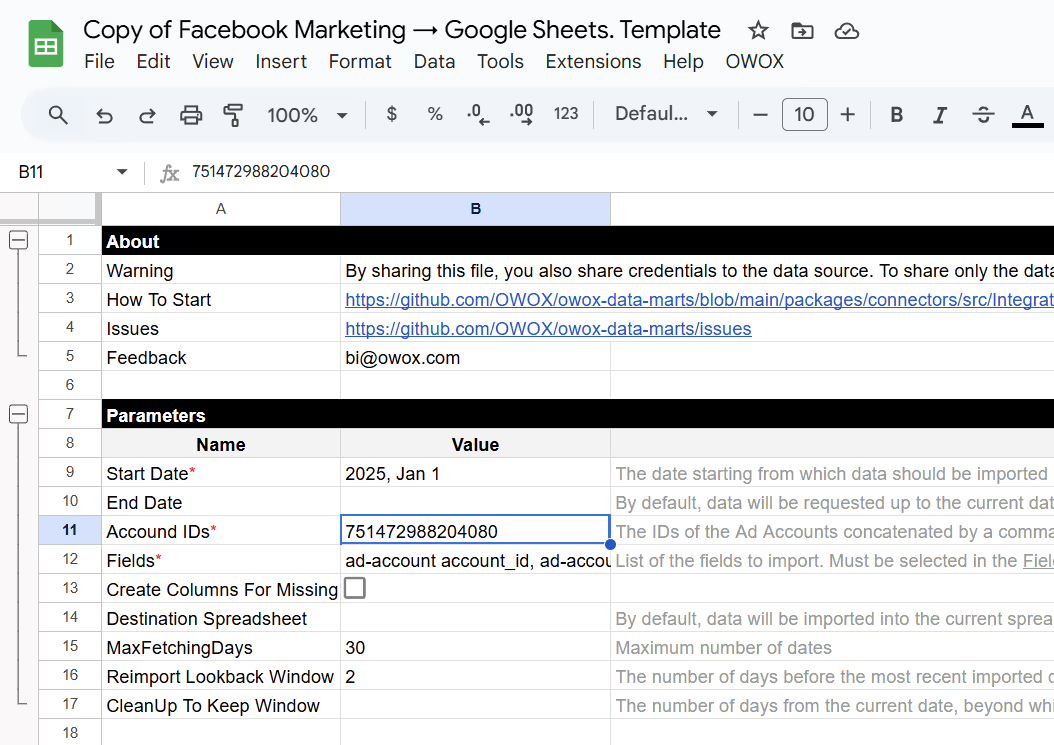
The dataset should include, at a minimum, the following fields: date, campaign ID, ad set ID, ad ID, currency code, and spend. These fields are essential for matching each spend record with the correct exchange rate later. The more consistent and complete your raw data is, the easier it becomes to normalize costs across platforms.
Prepare the Open Exchange Rates Connector for Daily FX Data
Use the OWOX Open Exchange Rates connector to pull accurate daily exchange rates into Google Sheets.

Set your base currency (e.g., USD), define the start date, and list all currencies used across your ad platforms. This setup ensures you get the right FX rate for each day’s spend, a key step for accurate normalization.
Generate and Store Your Open Exchange Rates App ID
To start pulling FX data, sign up at Open Exchange Rates and generate your personal App ID from the dashboard. This ID acts as your access key to the exchange rate API.

In your OWOX connector setup within Data Marts, enter this App ID to authenticate the connection. Once set, you'll be able to automatically import accurate daily currency rates into Google Sheets for normalization.
Set Up Your OWOX Google Sheets Environment
Install the OWOX Google Sheets connectors and make sure you have edit access to the provided template files. This setup enables direct imports of both ad spend and FX rate data from source APIs into your spreadsheet.

With connectors in place, you eliminate the need for manual CSV uploads and keep your reporting automated and scalable.
Step-by-Step: Normalize Ad Spend in Google Sheets
Normalizing ad spend in Google Sheets is straightforward when broken down into steps. This section walks you through the exact process, from pulling raw data and exchange rates to calculating costs in your base currency and automating updates.
Step 1: Pull Raw Ad Spend from Each Platform with OWOX Connectors
Start by setting up connector-based Data Marts in OWOX to fetch raw ad spend data directly from your ad platforms, including Facebook, TikTok, LinkedIn, and X Ads. Choose the platform, authorize the connector, and define the schema.
Make sure your export includes key fields:
- Date
- Campaign ID and Name
- ad ID
- Currency
- Spend

These fields are essential for accurate exchange rate mapping and cost conversion later. You can also include optional metrics like impressions or clicks if needed.

Step 2: Import Daily Exchange Rates into Google Sheets
Use the OWOX Open Exchange Rates connector to pull daily FX data directly into Google Sheets.
In the setup,
- specify your base currency (e.g., USD),
- the start date for exchange rates,
- list of currency codes (e.g., EUR, GBP, INR).

This ensures each spend record can be matched with the correct rate for that specific date. With automated daily refreshes, you avoid manual updates and keep your normalized costs accurate and current.
Step 3: Combine Platform Data into One Blended Table
Use IMPORTRANGE or QUERY + IMPORTRANGE functions to bring data from all ad platform sheets into a single, blended table. This consolidated view allows you to apply normalization logic across campaigns.

Make sure to standardize column names, especially Date, Currency, and Spend, to avoid formula errors. Keep your raw ad spend in an Ads_Raw tab and your exchange rates in FX_Rates for a clean, auditable structure that supports scaling and governance.
Step 4: Match Exchange Rates with Ad Spend Using VLOOKUP
To normalize costs accurately, join your Ads_Raw table with the FX_Rates tab using a combination of Date and CurrencyCode. Use VLOOKUP on a helper column that concatenates both fields (e.g., 2025-07-01USD) to fetch the correct exchange rate. This ensures each ad spend row has the exact multiplier needed for conversion.
With this single join, every metric calculated downstream automatically reflects the correct currency-adjusted value, making your reports accurate and ready for board-level visibility.

Step 5: Create a “Cost in Base Currency” Column
After mapping exchange rates to each spend row, add a new column called Cost in Base Currency. This column applies the matched exchange rate as a multiplier to the spend values, instantly converting them into your chosen base currency.
Once created, every downstream metric, whether CPC, CPM, or ROI, automatically reflects standardized values across all platforms. This avoids the need for repeated calculations per channel and ensures your reports remain consistent, reliable, and ready for stakeholder review.
Step 6: Automate Data Refresh with Scheduled Triggers
To keep your normalized ad spend dashboard always up to date, set up scheduled triggers in the OWOX connectors. These triggers automatically refresh both ad spend and exchange rate data at your chosen intervals, eliminating the need for manual updates.
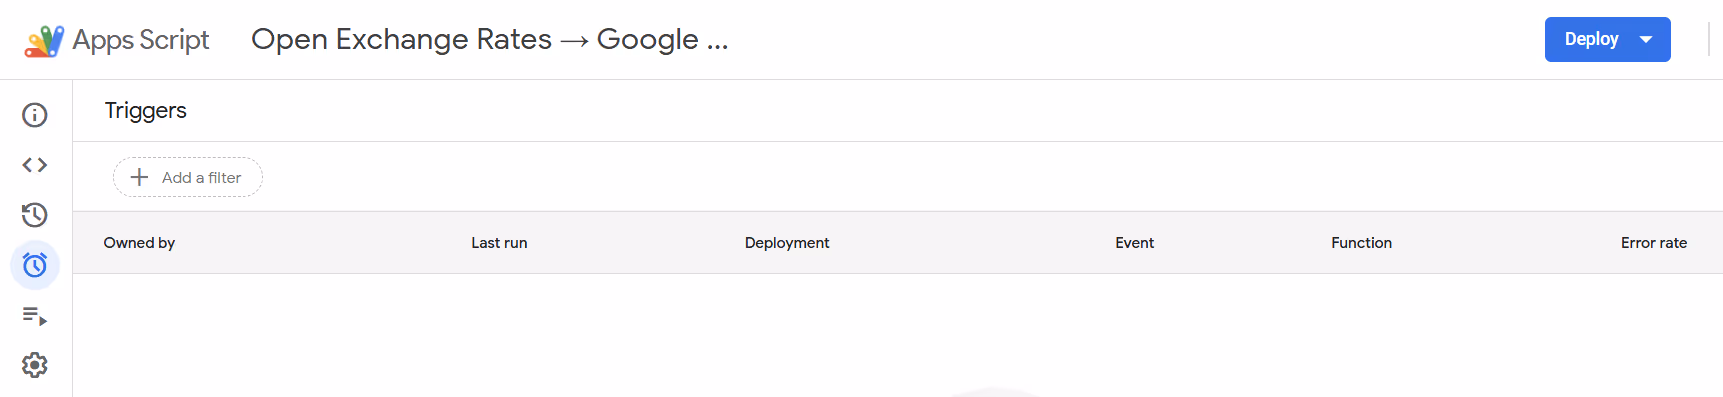
You can configure them to run daily, weekly, or even multiple times per day, depending on reporting needs. With automation in place, every refresh pulls the latest platform costs and FX rates, ensuring your dashboards remain accurate, consistent, and always ready for analysis.
Best Practices for Multi-Currency Ad Spend Tracking

A solid sheet setup ensures your currency normalization process remains accurate, maintainable, and scalable. These best practices help avoid common mistakes and make your workflow easier to audit and automate.
Keep Raw, FX Rates, and Normalized Data in Separate Tabs
Structure your spreadsheet into three dedicated tabs: Ads_Raw, FX_Rates, and Normalized_Costs. This separation keeps each stage of your workflow clean and auditable. It also reduces the risk of overwriting formulas or data while editing or updating reports.
Use Consistent Column Naming Across Platforms
Standardize column headers like Date, Currency, and Spend across all imported ad platform datasets. This consistency simplifies formulas, allows joins with fewer errors, and reduces confusion when combining multiple sources. It’s a small habit that pays off when scaling, helping ensure automation works correctly and your normalization logic stays clean.
Test Calculations with Small Datasets Before Scaling
Before applying formulas across thousands of rows, test your setup with a short date range or one platform’s data. This approach lets you validate VLOOKUPs, exchange rate mappings, and currency conversions early on. It’s the fastest way to identify logic issues or errors before they create bigger problems in larger datasets or impact stakeholder-facing dashboards.
Monitor API Quotas and Sheets Performance Limits

Check your connector run logs and track API usage for both ad platforms and exchange rate services. Google Sheets has row limits and performance thresholds; pushing past them can break your workflow. Keep datasets lean, split data where needed, and set alerts or fallback strategies to ensure your dashboards remain stable and refresh reliably.
Taking Your Multi-Currency Tracking Beyond Google Sheets
Google Sheets is great for quick builds, but larger datasets and teams need more scalable infrastructure. Here’s how to know when it’s time to move, and how OWOX can help you scale without losing control.
When to Move to BigQuery or Other Data Warehouses
As your ad spend data grows, Google Sheets can hit performance limits, slow loading, formula errors, or data truncation. If you’re working with tens of thousands of rows, multiple platforms, or frequent updates, it’s time to scale. Migrating to BigQuery or another warehouse allows you to process large volumes of normalized data quickly and reliably.

You can reuse the same logic from Sheets but benefit from faster queries, scheduled automation, and better data governance. This shift helps future-proof your reporting and ensures your team can maintain high-quality insights as your marketing data grows.
How OWOX Data Marts Community Edition Can Help
With OWOX Data Marts Community Edition, you can recreate your multi-currency normalization process directly in a data warehouse like BigQuery. It’s open-source, flexible, and designed for analysts who want full control.

You can define your logic using SQL or connectors and automate refreshes at scale. Plus, pre-built marts for exchange rates, CRM revenue, and holidays make it easy to enrich your reports without writing extra pipelines or scripts.
Explore the OWOX Data Marts (Apps Script Edition) Built for Data Analysts
The OWOX Data Marts (Apps Script Edition) gives analysts a powerful, free toolkit to build and automate reporting pipelines, right inside Google Sheets.
Pull data from ad platforms, apply transformations, schedule updates, and normalize costs at scale. It’s open-source, fully customizable, and built to grow with your reporting needs.
Start small in Sheets, then scale seamlessly into BigQuery or AWS Athena when you're ready.
Check out our GitHub repo for more details and implementation examples.And don’t forget to support us by giving us a star on GitHub.
Frequently asked questions


Finally, a tool that doesn't ask business users to learn a new dashboarding UI. Our marketing team already knows Sheets. OWOX just delivers the right data.
Joinable data marts concept was the thing that sold us. We can now use the semantic layer without building one.
Self-hosted the OSS version on Digital Ocean. Zero vendor lock-in. Contributed a Shopify connector back in week two.