

Your data is hostage to someone else's API – the case for warehouse-first analytics
Meta cut 13 months of data overnight. SaaS connectors return blank columns silently. Warehouse-first analytics with open-source connectors is the fix.

On January 12, 2026, Meta flipped a switch. Historical ad data access dropped to 13 months. The 7-day and 28-day view attribution windows disappeared. Teams that relied on Meta's API for reporting woke up to dashboards showing gaps, zeros, and broken trend lines – with no error message, no warning email, and no rollback option.
The worst part?
The deprecated API endpoints didn't return errors. They returned empty data. Reports that had worked for years kept running. They just stopped being accurate. And if you didn't know to look, you wouldn't notice until decisions had already been made on bad numbers.
This isn't a one-time event. It's a pattern. And it reveals a structural problem in how most analytics teams build their data infrastructure: by renting access to their own data through someone else's API.
Warehouse-first analytics is the architectural response. Instead of depending on vendor APIs as your primary data source, you own your data in a warehouse you control. Every downstream report, dashboard, and model reads from your copy – not the vendor's. When the API changes, your historical data is safe.
This article breaks down why API-dependent analytics is structurally risky, what vendor lock-in actually costs, and how to build an analytics stack that survives whatever vendors do next.
When your data pipeline breaks and nobody tells you
The most dangerous failures in analytics are the silent ones. Not the errors that wake you up at 3 AM, but the ones that corrupt your reports while everyone assumes everything is fine. Two recent examples show how this plays out.
The Meta cut – 13 months of data, gone overnight
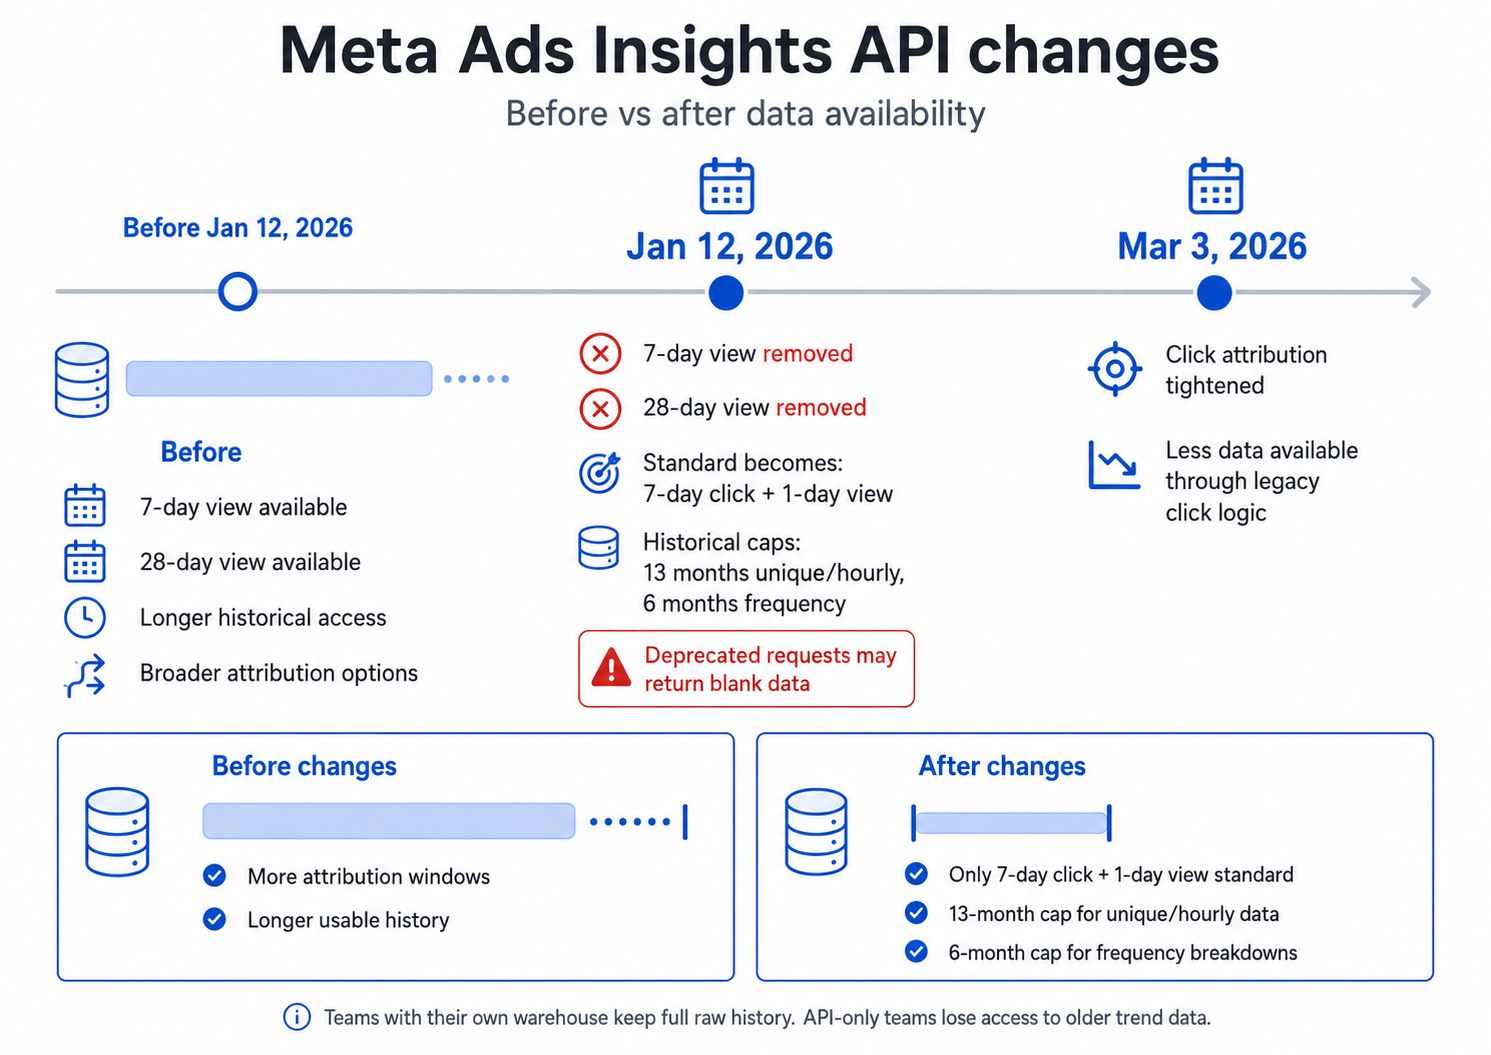
On January 12, 2026, Meta restricted its Ads Insights API in three ways. Historical data access was capped at 13 months for unique counts and 6 months for frequency breakdowns. The 7-day view and 28-day view attribution windows were permanently removed. And the new standard became 7-day click plus 1-day view only.
The impact was immediate. Brands with long sales cycles saw reported conversions fall by 20% to 60%. But the technical failure was worse than the metrics gap: the deprecated API endpoints returned empty data silently. Applications requesting the old attribution windows got blank responses – not error codes.
For teams that had been storing raw ad data in their own warehouse, this was an inconvenience. They still had their full history. They could recalculate metrics against any attribution window they wanted, because the underlying event data was theirs.
For teams that depended entirely on Meta's API? Years of trend data simply vanished from their reach.
The blank column problem – silent failures in SaaS connectors
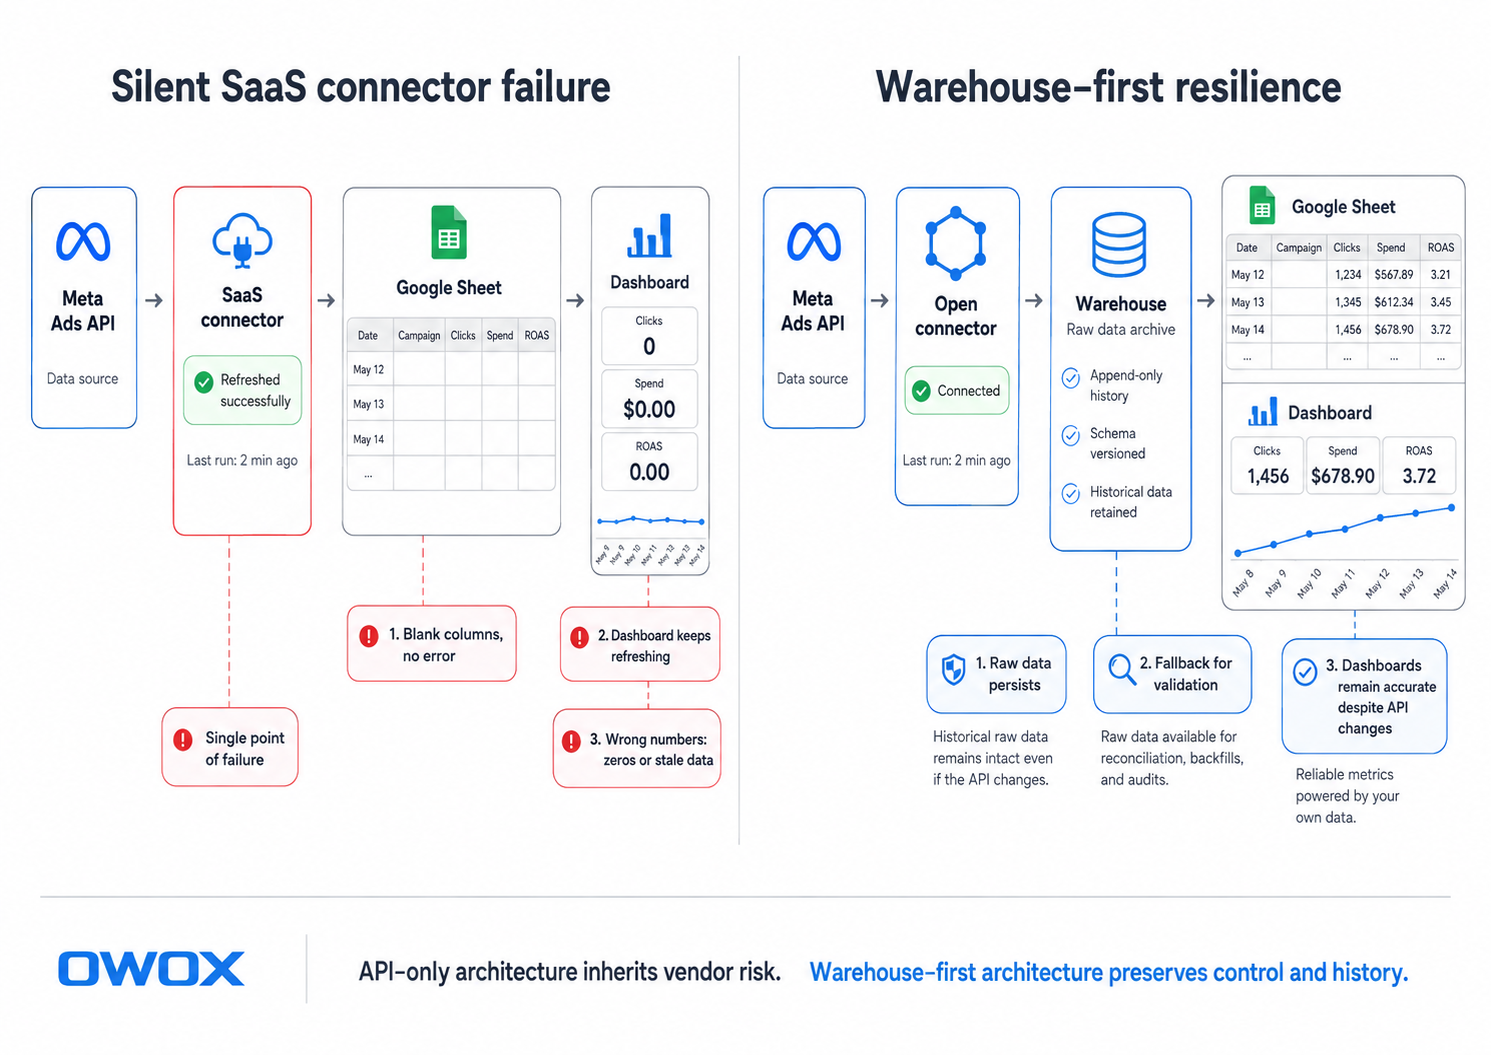
Meta is not the only example. SaaS connector users have reported scenarios where queries returned blank columns with no error message. The connector kept running. The downstream Google Sheet or dashboard kept refreshing. But the numbers were wrong – sometimes zeros, sometimes stale data.
I've seen teams discover this weeks later, after campaign budgets had already been reallocated based on the corrupted data. The API was the only data source, so there was no fallback. No second copy to validate against. No historical archive to compare.
This is not a bug in any particular tool. It's a design limitation of API-dependent architectures. When the vendor's API is your only connection to your own data, you inherit every risk that API carries – including changes the vendor makes without consulting you.
What vendor lock-in actually costs you
Most conversations about vendor lock-in focus on the switching cost: "how painful would it be to move?" But that framing understates the problem. Lock-in doesn't just make switching expensive – it makes staying expensive too.
Direct costs – switching, retraining, re-engineering
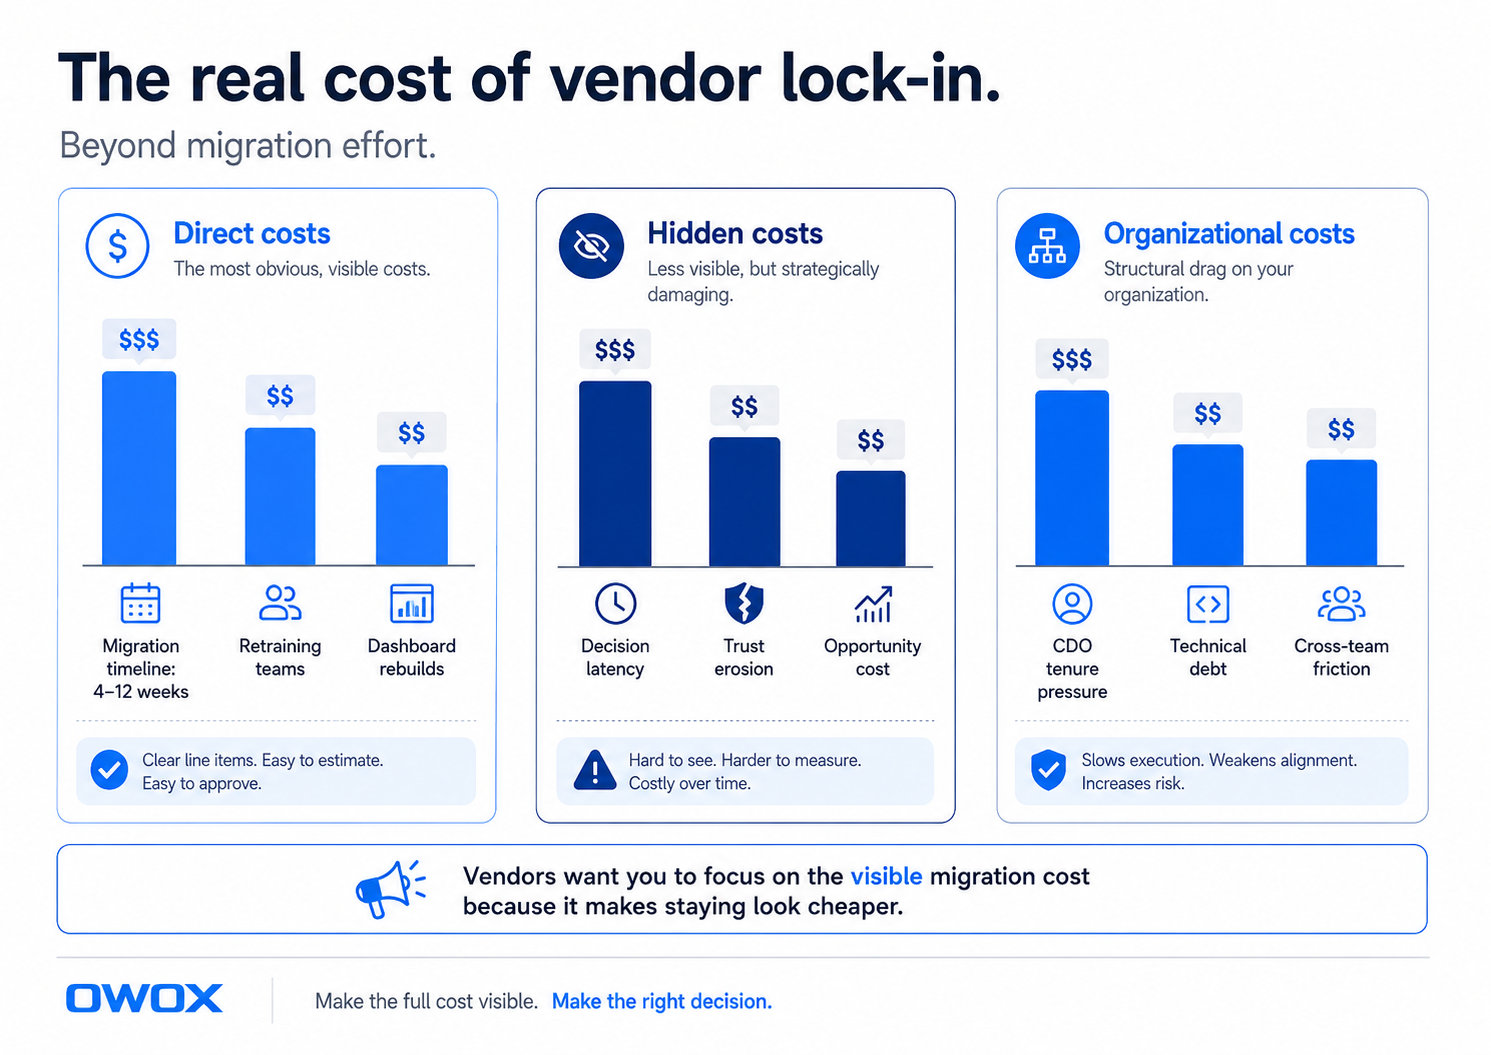
The obvious costs of leaving a locked-in vendor include migration timelines (typically 4–12 weeks for a complex analytics stack), retraining teams on new tools and schemas, and rebuilding every dashboard and report that was built against the vendor's proprietary data model.
These costs are real, but they're also the ones vendors want you to focus on – because they make the status quo look cheaper by comparison.
Hidden costs – decision latency, trust erosion, opportunity cost
The hidden costs accumulate while you stay. When a vendor API breaks and your data goes stale, decisions stall. Marketing can't optimize spend. Product can't validate experiment results. Finance can't close the books on time.
Each incident erodes executive trust in the analytics function. After the third time a CMO hears "the data was wrong because the connector broke," they stop trusting the data entirely. And once trust is gone, the analytics team's influence shrinks regardless of how good their tools are.
The opportunity cost matters too. Time spent firefighting broken connectors is time not spent on analysis, modeling, or building durable data infrastructure.
The CDO tenure trap
Here's where the organizational dynamics get interesting. According to MIT Sloan research, 53.7% of CDOs serve fewer than three years. That's a median tenure of roughly 30 months – barely enough time to complete one major infrastructure overhaul.
Short tenure creates a perverse incentive structure. Leaders optimize for quick wins with SaaS tools that show results this quarter, rather than investing in warehouse-first architectures that pay off over years. And when Gartner predicts that 75% of CDAOs not delivering AI impact will lose their C-level position by 2027, the pressure to ship fast and worry about lock-in later becomes even stronger.
The result? Vendor lock-in decisions made under short-term pressure create long-term technical debt that the next CDO inherits.
Why API-dependent analytics is a structural risk
The examples above are not edge cases. They reflect a structural problem with how API-dependent analytics works. Understanding the structure helps explain why these failures keep recurring – and why patching individual connectors is not enough.
APIs change, your warehouse does not
An API is a vendor-controlled interface. The vendor decides what data is available, in what schema, at what retention depth, and at what rate limits. They can change any of these parameters at any time, for any reason – a product pivot, a privacy regulation, a business model shift.
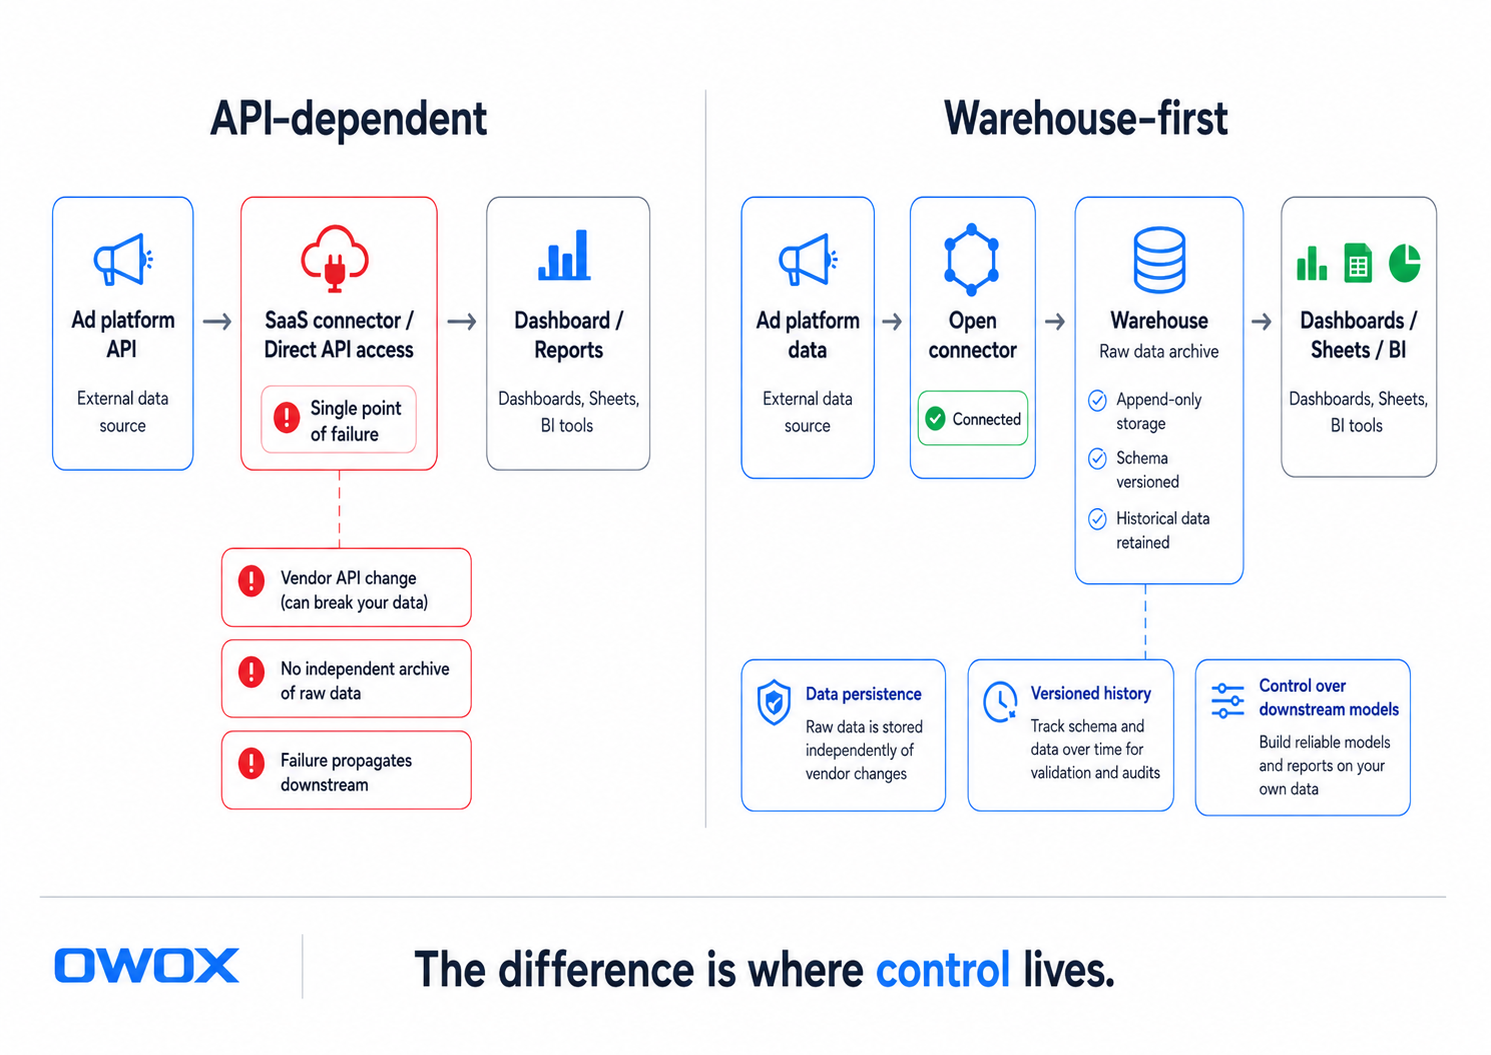
Your warehouse, by contrast, is infrastructure you control. The schema is yours. The retention policy is yours. The data, once ingested, is yours. No vendor can retroactively delete rows from your BigQuery or Snowflake tables.
The three-layer dependency stack
When you depend on a vendor's API as your primary data source, you're actually depending on three layers simultaneously:
If you depend on a vendor for all three layers, a single change at any layer breaks your entire reporting chain. Warehouse-first analytics eliminates the retention dependency entirely and reduces the access and schema dependencies to the ingestion layer only – where they can be isolated and managed.
What warehouse-first analytics actually means
The term gets thrown around loosely, so let's be precise. Warehouse-first analytics is an architectural principle, not a product category. It defines where data lives first and who controls access.
Data ownership vs data rental
Think of it this way. Data rental means your data lives in vendor systems, accessible via their API on their terms. You can query it when the API is up, in the format the API provides, for the history the API exposes. When the vendor changes their terms, you adapt or lose access.
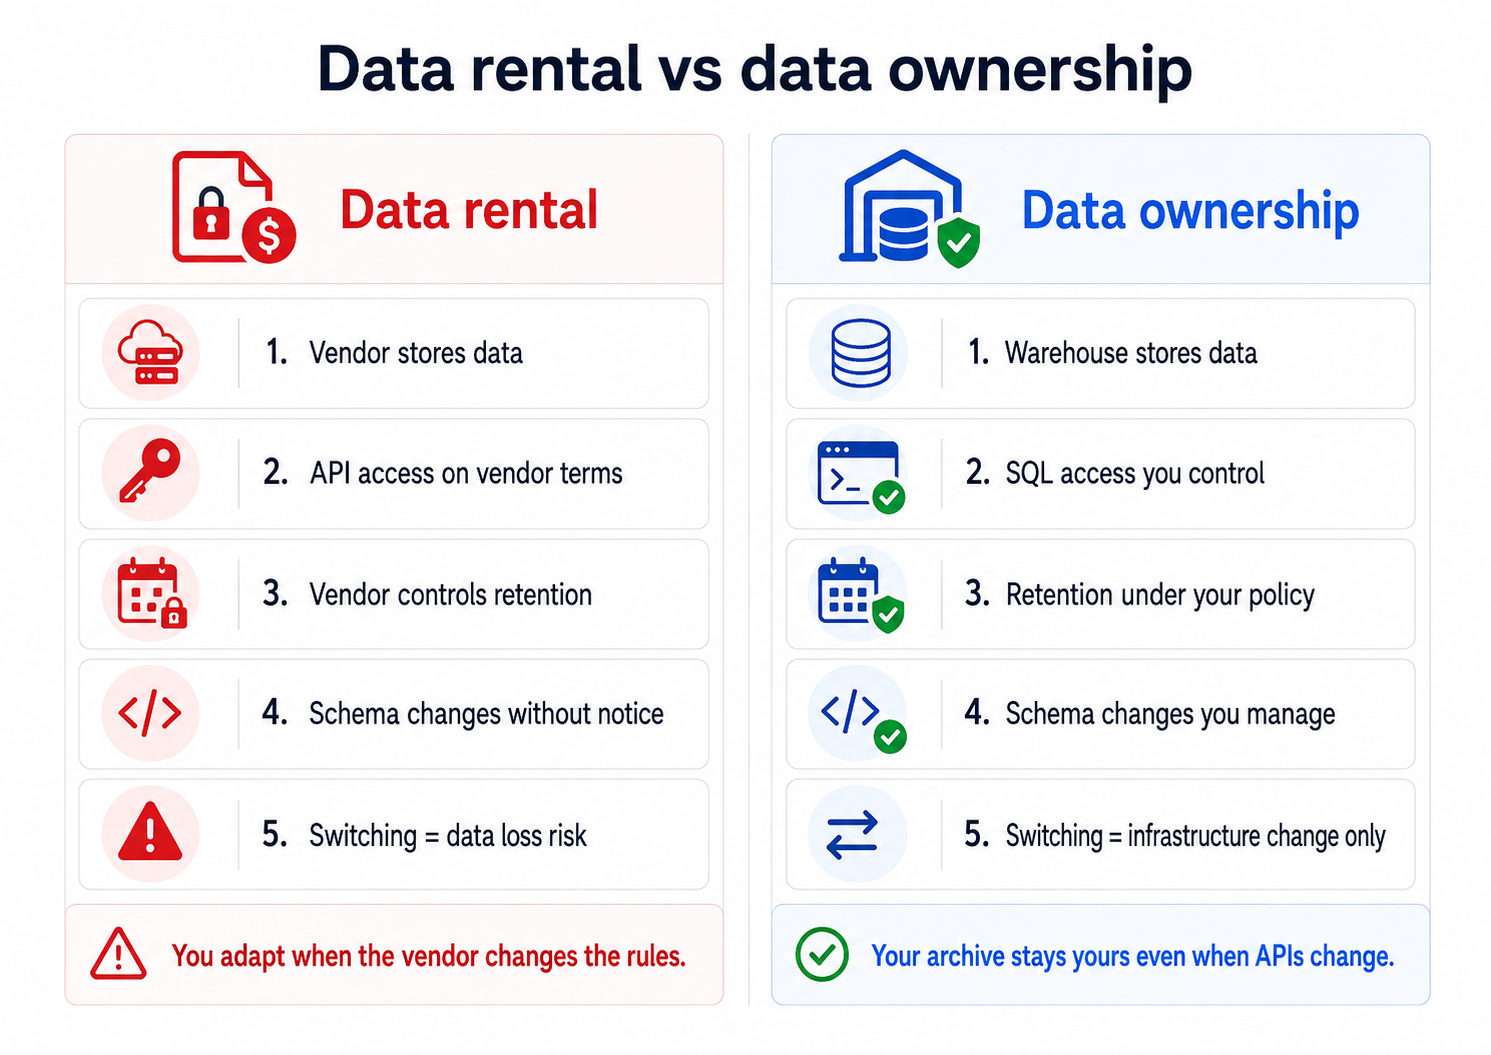
Data ownership means raw data lands in your warehouse first. You control access, retention, and schema. When a vendor API changes, your historical data is unaffected. You still need connectors to keep fresh data flowing, but your archive is independent.
How the warehouse becomes your system of record
In a warehouse-first architecture, the data flow is straightforward:
- Ingest: Raw data from sources (ad platforms, CRM, product analytics) flows into your warehouse via connectors
- Transform: Business logic, cleaning, and modeling happen inside the warehouse using SQL or data transformation tools
- Serve: Dashboards, reports, and downstream applications read from the warehouse – never directly from source APIs
This means every consumer of your data – from the CMO's executive dashboard to the data scientist's Jupyter notebook – reads from the same governed source. Historical data persists regardless of what vendors do upstream. And schema evolution is under your control, not theirs.
Where open-source fits in
Open-source eliminates the last lock-in vector: the connectors themselves. If the code that moves your data from source to warehouse is open-source, no vendor can hold it hostage.
When Meta changed their API in January 2026, open-source connector maintainers updated their code within days. Users of proprietary SaaS connectors had to wait for their vendor's engineering team to prioritize the fix – which, for some vendors, took weeks.
Open-source also means you can inspect exactly what data is being collected, how it's transformed in transit, and whether any fields are being dropped or modified. With a proprietary connector, you're trusting a black box.
The industry is moving toward warehouse-first
This isn't just a contrarian take. Major industry initiatives and analyst predictions are converging on the same conclusion: API-dependent, vendor-locked analytics architectures are a liability.
dbt and the Open Semantic Interchange
At Coalesce 2025, dbt Labs open-sourced MetricFlow under the Apache 2.0 license and contributed it as the initial reference implementation for the Open Semantic Interchange (OSI) specification. The OSI project brings together competitors – including Snowflake and Salesforce – to standardize how semantic layer definitions are shared across tools.
Why does this matter? Because it reflects board-level anxiety about lock-in. When organizations run dozens of analytics tools, each with its own interpretation of "revenue" or "conversion," the semantic layer becomes a critical dependency. The OSI initiative is the industry admitting that proprietary semantic definitions create the same lock-in dynamics as proprietary data APIs.
Gartner's CDAO warning and the composable stack
Gartner's prediction carries weight: by 2027, 75% of CDAOs not seen as essential to AI success will lose their C-level position.
Meanwhile, the share of CDAOs reporting directly to the CEO rose to 36% in 2025, up from 21% in 2024. Data leadership is gaining strategic importance at exactly the moment when lock-in threatens to undermine it.
The composable data stack movement reinforces this direction. Instead of buying an all-in-one platform that handles ingestion, storage, transformation, and visualization, teams assemble best-of-breed components connected through open interfaces – with the warehouse as the gravitational center.
The pattern is consistent: warehouse-centric, vendor-neutral, open by default. The organizations that recognize this early build infrastructure that survives leadership transitions, vendor pivots, and regulatory shifts. The ones that don't keep rebuilding.
How to evaluate your vendor lock-in exposure
Before you can fix a lock-in problem, you need to measure it. Here's a practical framework you can run this week – no tooling required, just honest answers.
The five-question audit
- 1.If this vendor's API changed tomorrow, how many dashboards would break? Count them. If the answer is more than half your active dashboards, you have a critical single-point-of-failure.
- How much historical data do you own in your warehouse vs. access via API?
If your warehouse has 6 months and the API has been your source for 3 years, you have a 2.5-year gap you'd lose in a cutoff.
- Can you export your data in a portable format without vendor involvement?
If the export requires filing a support ticket or paying an upgrade fee, that's a lock-in signal.
- Is the code that moves your data open-source or proprietary?
Proprietary connectors mean the vendor controls your data pipeline. Open-source connectors mean you do.
- How long would it take to replace this vendor?
If the answer is "months" or "we'd need to rebuild everything," your lock-in exposure is high.
Red flags in your current stack
Watch for these patterns – any two should trigger an architecture review:
- Vendor stores your only copy of historical data
- No raw data layer – reports read directly from vendor APIs
- Proprietary connectors with no export or migration path
- Vendor-specific query language or schema with no SQL equivalent
- Rate limits that prevent full data extraction
- Vendor terms that restrict data portability or competitive benchmarking
Building a warehouse-first analytics stack
If the audit revealed uncomfortable answers, here's what the alternative architecture looks like. The good news: you don't need to rip and replace everything at once. You can layer warehouse-first principles onto your existing stack incrementally.
Open-source connectors as the data layer
The data layer is where most lock-in starts. If a proprietary connector breaks or a vendor changes their pricing, you're stuck. Open-source connectors solve this by making the ingestion code transparent, forkable, and community-maintained.
When Meta changed their API in January 2026, teams using open-source connectors could review the exact code change needed, test it against their data, and deploy a fix – often within days. Teams using closed-source SaaS connectors had to file a support ticket and wait.
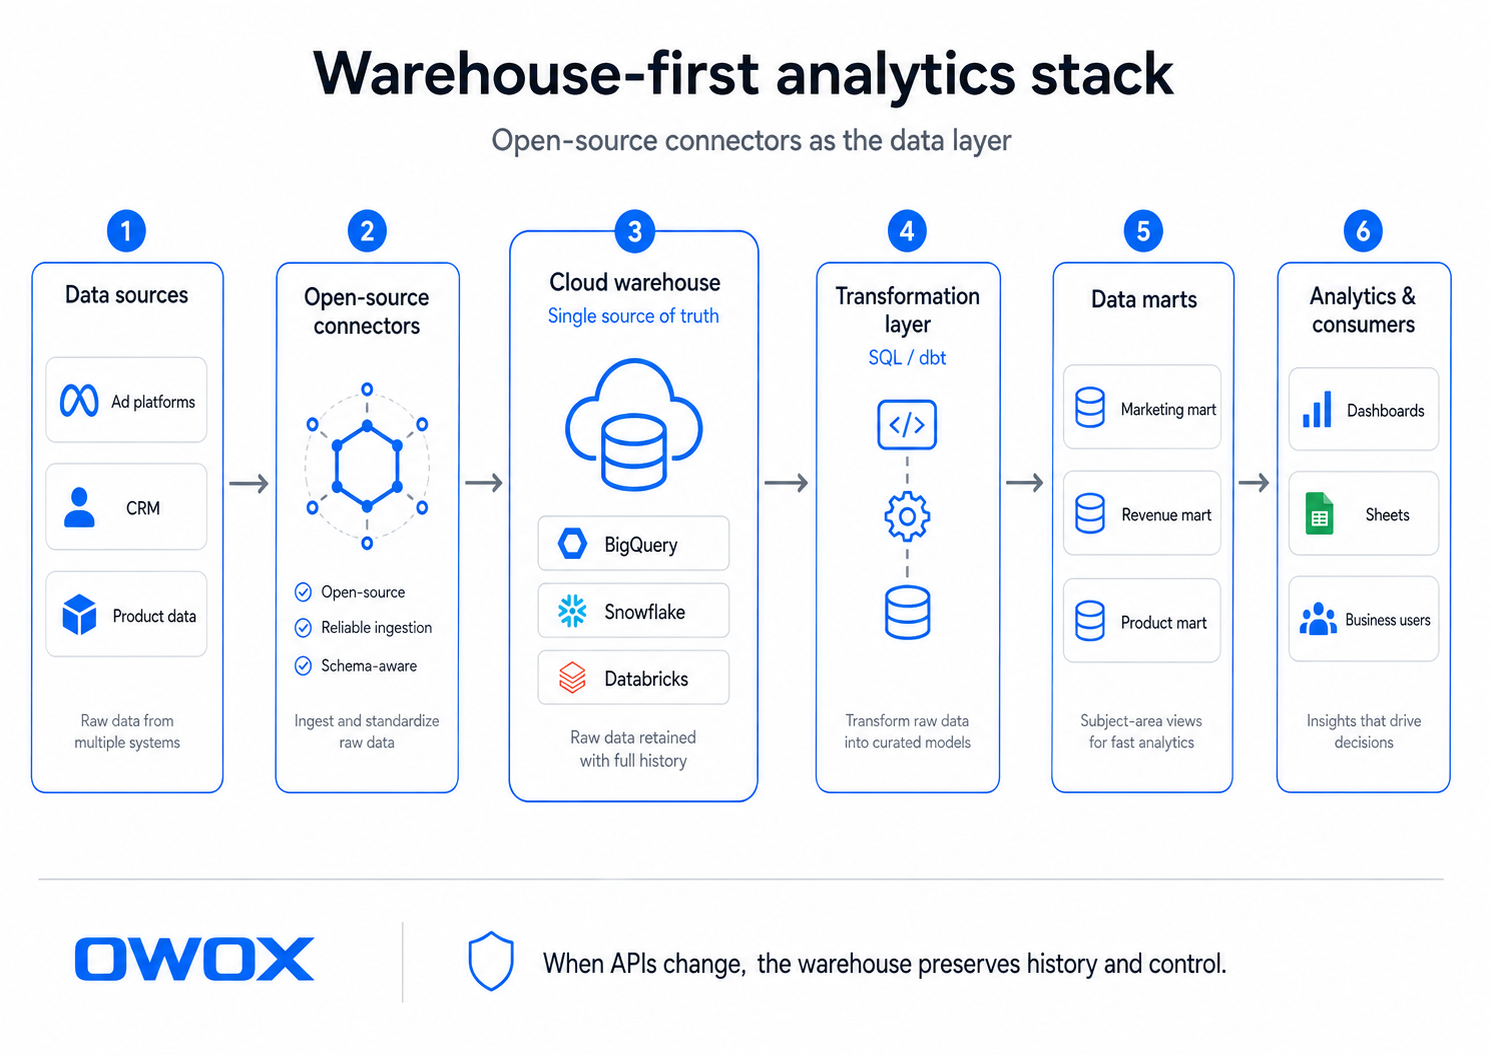
Your warehouse as the single source of truth
The warehouse anchors the architecture. Whether you choose BigQuery, Snowflake, Databricks, Redshift, or Athena, the principle is the same:
- Raw data lands here first. Not in a SaaS tool, not in a spreadsheet, not in a vendor's dashboard
- Transformation happens here. Business logic lives in SQL, versioned in Git, documented for the team
- Historical data persists here. Your retention policies, your storage costs, your control
- Downstream consumers read from here. Every report, model, and application draws from the same governed source
This is what makes the architecture resilient. When a vendor API changes upstream, your warehouse still has every row it ever ingested. You update the connector, backfill if needed, and move on – without losing history or breaking downstream reports.
How OWOX approaches warehouse-first analytics
OWOX is built on this exact principle. The open-source connectors library moves data from ad platforms, CRM systems, and other sources directly into your data warehouse.
OWOX never stores your data – it flows straight to the data warehouse you control.
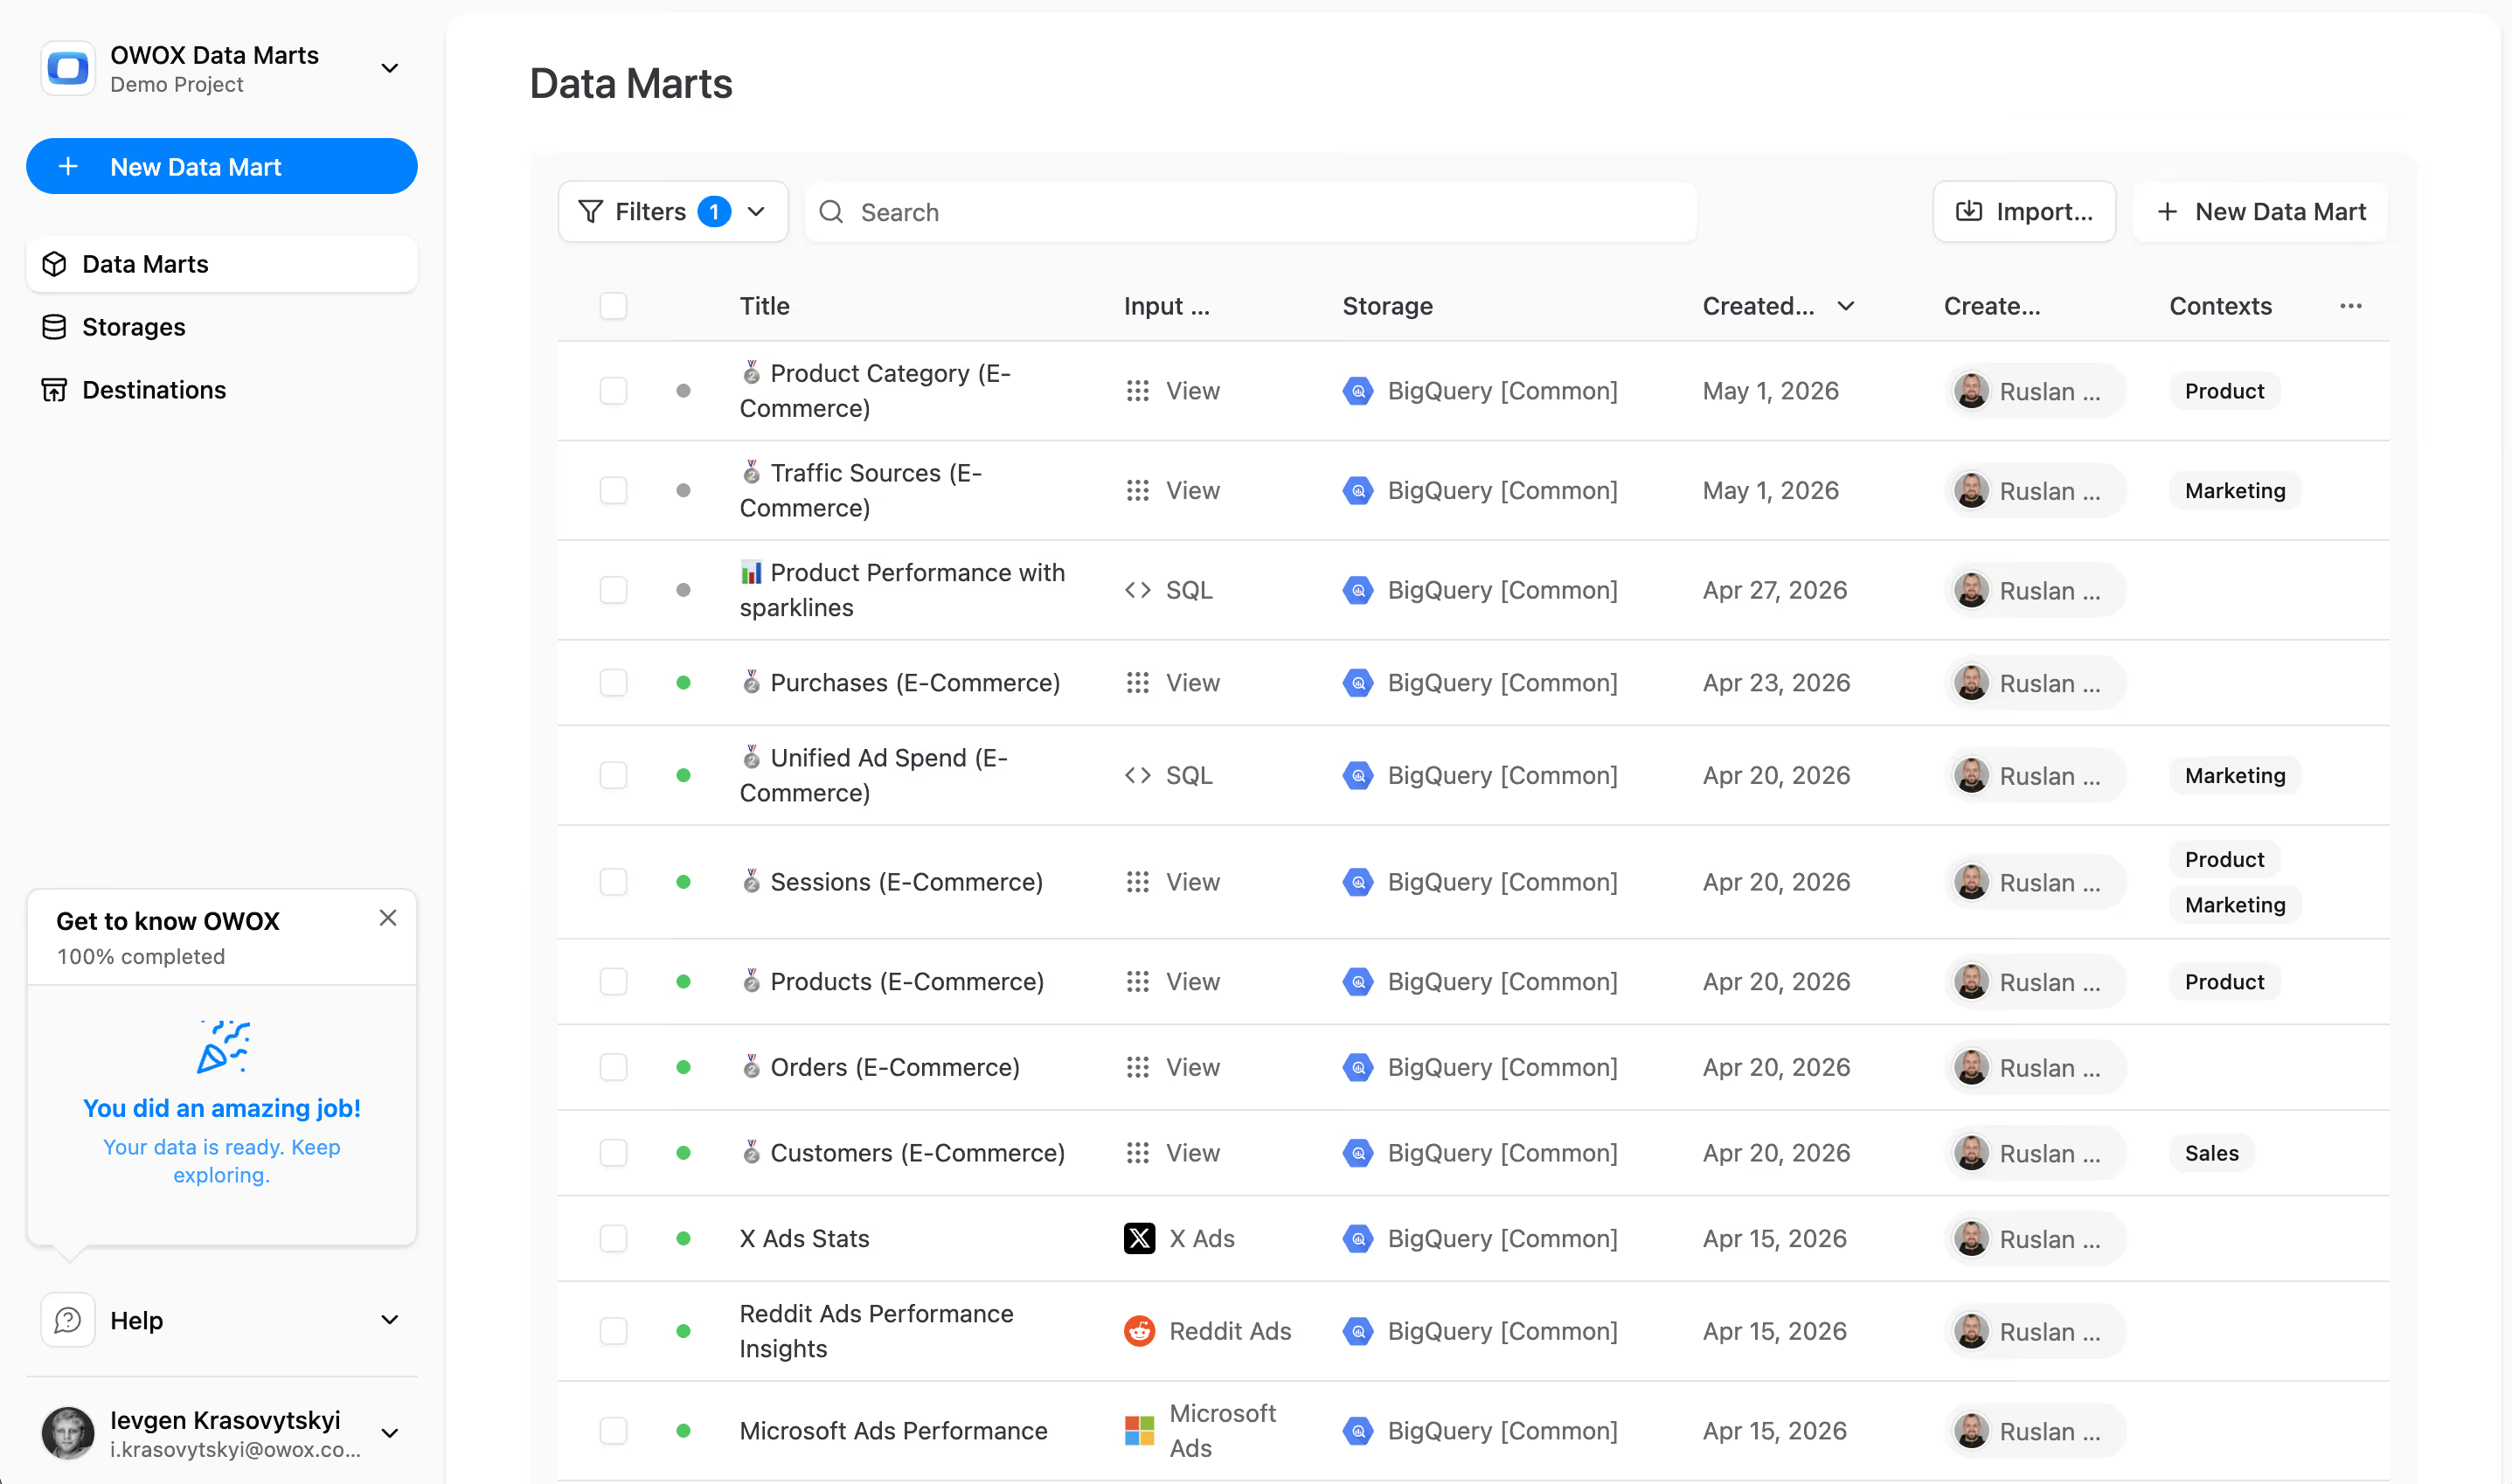
On top of the raw data, OWOX data marts provide a modeling layer that allows you to join data marts.
Think of it as the governed metrics layer – standardized definitions that everyone in the organization can trust, built on data you own.
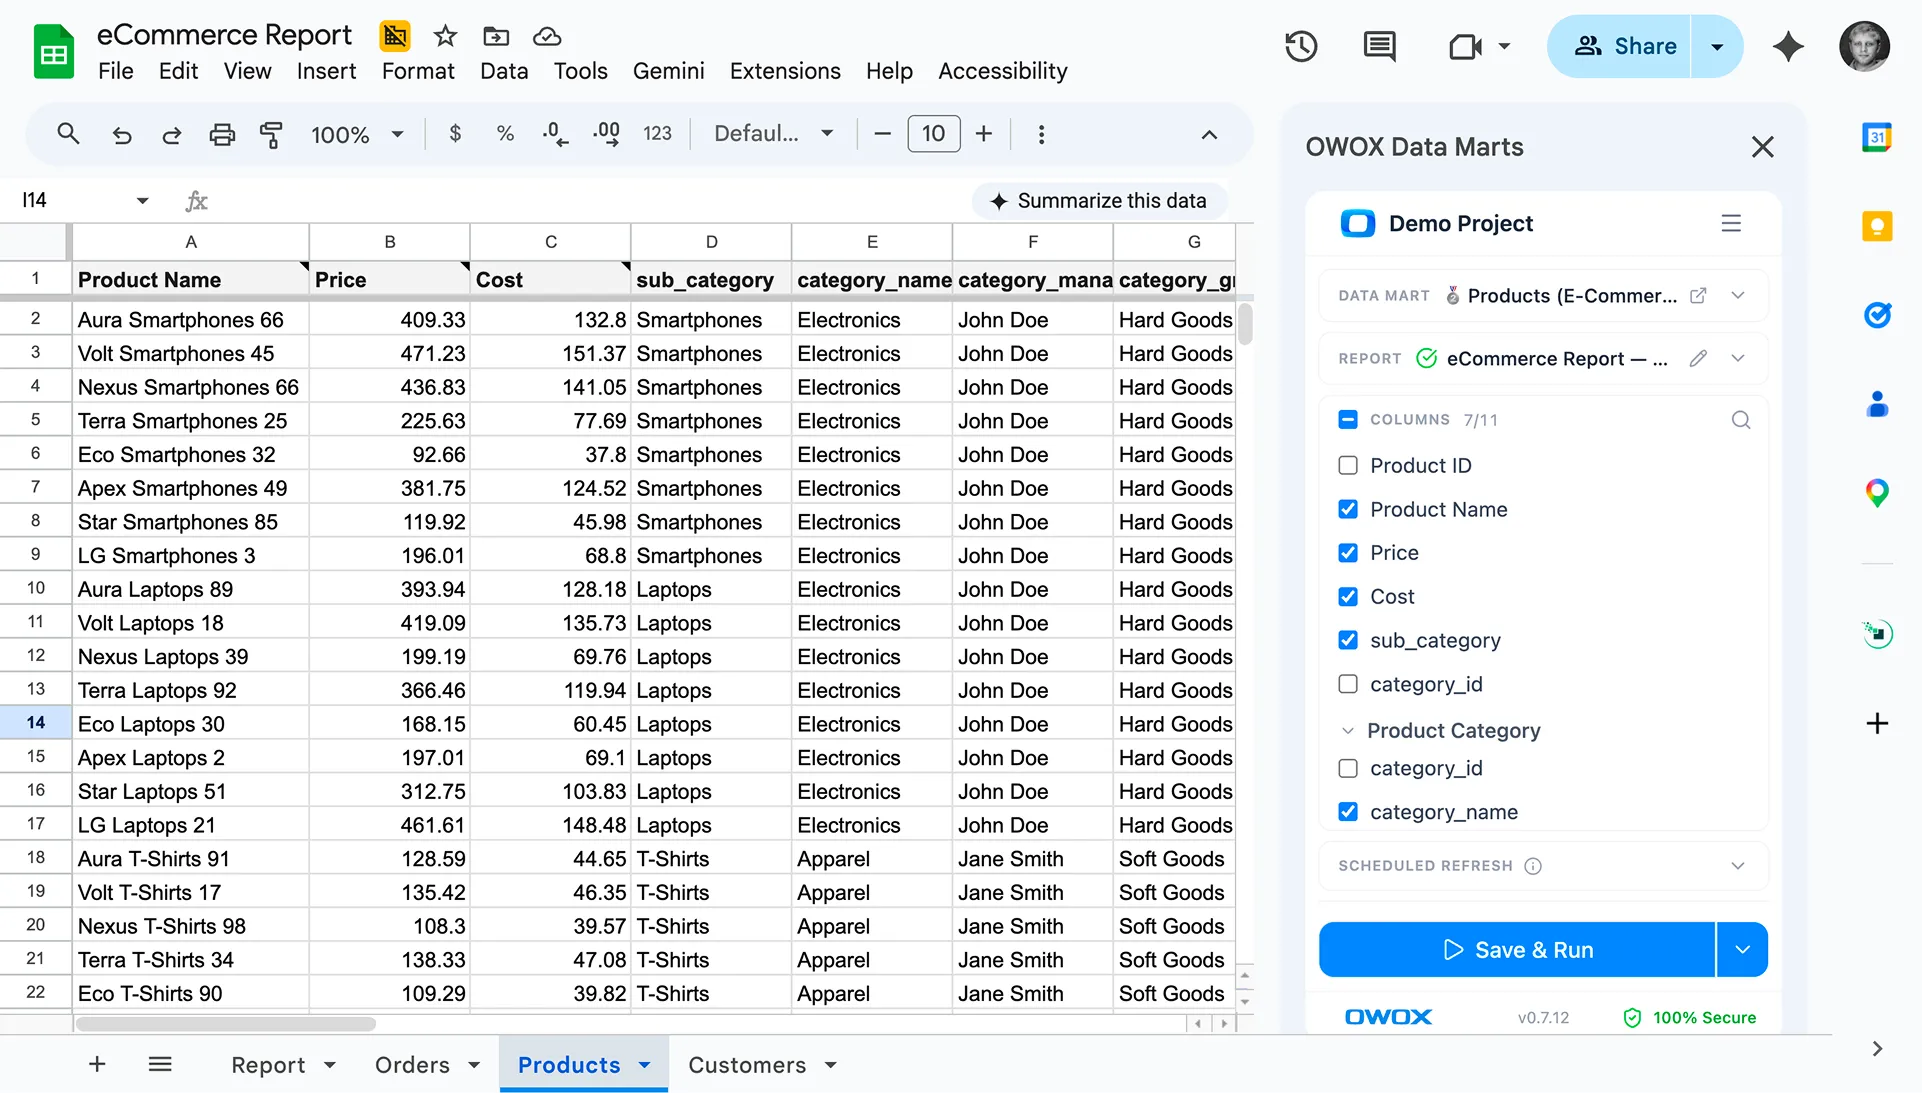
Setup takes 2 minutes. Connect your data warehouse as storage, import your data sources, configure, describe & join your data marts, and your business users get self-serve access to trusted, governed data – without building or maintaining the pipeline themselves.
What to do this quarter
If you've read this far, you probably recognize at least some of these patterns in your own stack. Here's a concrete timeline to start reducing your lock-in exposure:
Week 1: Run the five-question vendor lock-in audit on your three most critical data sources. Document the gaps honestly.
Weeks 2–4: Identify which data sources lack a warehouse copy and prioritize ingestion. Start with the highest-risk vendors – the ones most likely to change their API or restrict historical access.
Month 2: Set up connectors for your highest-risk vendor dependencies.
Begin ingesting raw data into your warehouse in parallel with your existing SaaS connectors.
Month 3: Validate that historical data is flowing correctly and accessible independently of any vendor API. Build at least one critical dashboard that reads from the warehouse instead of the vendor's API.
The goal is not to replace every tool overnight. It's to ensure that no single vendor's decision can break your analytics. Start with the highest-risk dependencies. Layer warehouse-first principles onto your existing stack. And when the next Meta-style API change hits – and it will – your team will be the one that keeps reporting while everyone else scrambles.
Frequently asked questions


"AI by its nature will hallucinate. You need guardrails so you can trust your data."
"We had six or seven different channels and no single source of truth. It was almost impossible"
"We regained time. And time is the one resource that never comes back."