Your weekly report is already wrong by the time you read it

Your weekly report is wrong in two ways, and neither is anyone’s fault.
It describes last week – while every decision it feeds is about this week. And half its numbers won’t survive contact with another department’s version of the same metric. Stale and inconsistent, in one tidy PDF. Here’s why that keeps happening, and the fix that doesn’t take six months.
Your numbers lie two ways
Let’s name both failure modes, because they compound.
The first is staleness. The report lands Monday morning describing a week that’s already over; the reorder, the budget shift, the pricing call you’ll make today are all fed by data whose freshness expired before you poured the coffee. You’re steering by the rearview mirror, on a schedule.
The second is inconsistency. Marketing’s dashboard says one thing, finance’s says another, and both were presented in the same meeting with equal confidence. Now you’re not deciding – you’re refereeing.
Add them up and you get the quiet absurdity of modern reporting: you’ve paid for pipelines, storage, dashboards, and at least one excellent analyst – and what you actually receive each week is a set of arguments. Data was supposed to end the debates. Somehow it’s hosting them.
The report is always about last week
The report is always about last week
The staleness isn’t a discipline problem – it’s built into the format.
A scheduled report is a batch job: someone (or something) assembles it Friday, you read it Monday, it describes the seven days before that. Automating the assembly makes it cheaper, not fresher – the gap between “when the data was true” and “when you act on it” is structural to anything that arrives on a schedule.
And here’s the part that took me embarrassingly long to see clearly: the schedule exists for the producer’s convenience, not the decision’s. Decisions don’t arrive weekly. They arrive when a supplier changes terms, when a campaign spikes, when a board member texts you a question. A report can’t be timed to that. Only an answer can – which is why the fix isn’t a faster report. It’s the ability to ask at the moment of deciding.
Run the test on your own Monday. Pick any decision you made last week off the report – a budget nudge, an inventory call. Now ask: what date range was the number behind it actually describing? In most companies the honest answer is ten to fourteen days before the decision landed. You wouldn’t accept that latency from your email. You’ve normalized it in the numbers that move money.
One claim, one proof: information that arrives on a schedule is always answering the previous question. The current one hasn’t been asked yet.
OWOX Data Marts
See your first report built in real time. 15 minutes.
- Connect your data warehouse
- Pick your metrics
- Get a live Google Sheets report
In the time it takes to write a ticket. Then imagine never writing that ticket again.
Book a DemoWe'll use your actual use case
Two teams, two numbers, one fight
Two teams, two numbers, one fight
Now the second lie – the one that eats your leadership meetings alive.
The industry writes about this clinically: when metrics conflict, leadership discussions start with validating numbers instead of evaluating outcomes. Translated into what it looks like in your conference room: twenty minutes of a strategy meeting spent on whose spreadsheet is right.
Why does it happen in a company full of smart people? Because every dashboard quietly becomes its own analytics system – its own filters, its own date logic, its own definition of “active customer” or “net revenue,” each reasonable in isolation. One vendor put it with brutal honesty: your revenue numbers don’t match because they were never designed to. Nobody decided to have four definitions of revenue. Four teams just each needed one, on four different deadlines, and the dashboards multiplied.
The result isn’t just wasted meeting time. It’s that every number now arrives pre-doubted – and pre-doubted numbers don’t drive decisions; they decorate them. For one quarter’s revenue reconciled line by line, from every order placed down to completed orders, see everyone in the meeting has a different number.
One governed source, asked on demand
One governed source, asked on demand
Both lies have the same antidote, and it’s one artifact, not two projects.
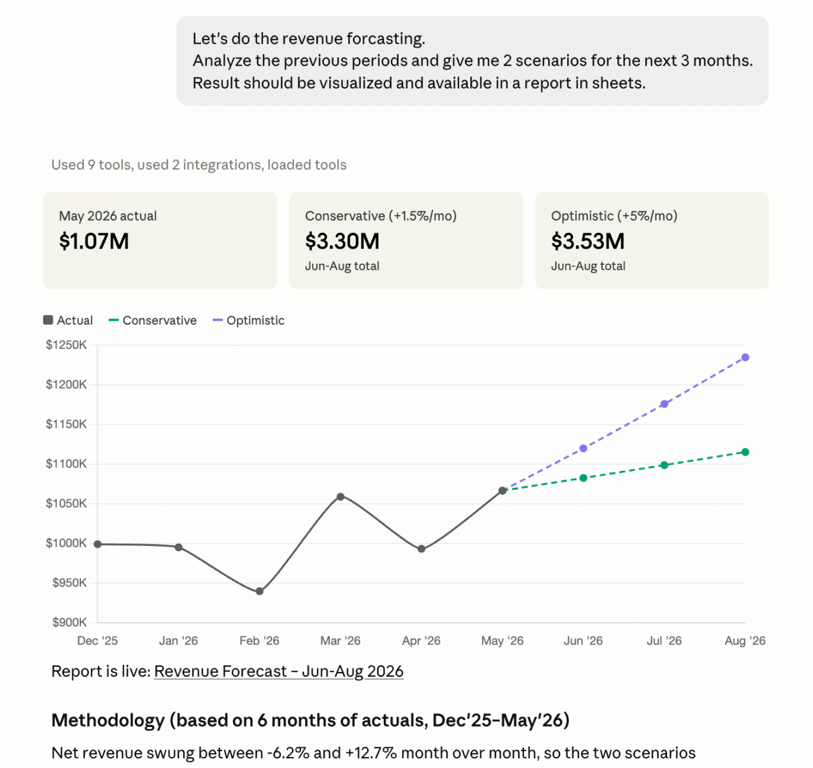
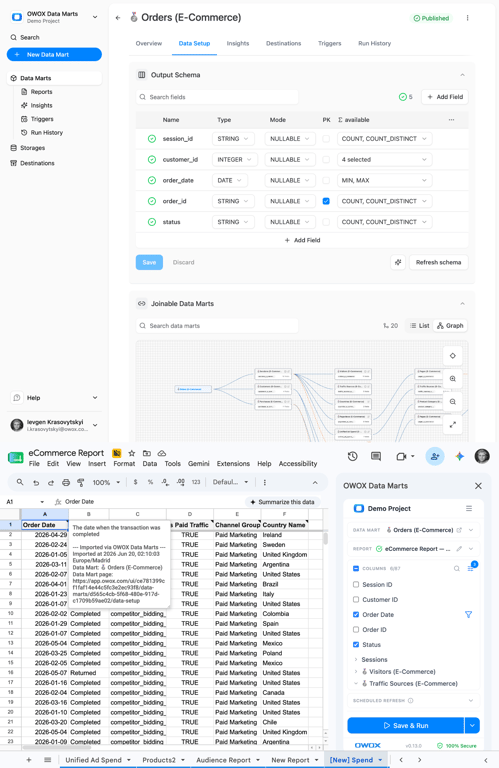
Your data analyst defines each decision-critical metric once – in governed data marts: the definition, the joins, the quality checks, authored and owned by the one person you already trust with the logic. Then every question in the company runs through that single definition – whether it’s asked in an AI chat, pulled into a spreadsheet, or asked by the CEO himself at 7 a.m. The AI narrates and charts; the analyst’s SQL computes; nobody redefines “revenue” at the point of asking, because nobody defines anything at the point of asking.
That kills both failure modes at once. Inconsistency dies because there’s one definition to conflict with – none. Staleness dies because you stop reading on the report’s schedule and start asking on the decision’s schedule: the answer is computed when you need it, not the Friday before.
Notice what this is not: it’s not another dashboard, not a migration, and not a mandate that four teams abandon their tools. Marketing keeps its spreadsheet, finance keeps its BI, you keep your chat – they all just drink from the same authored source. The definitions unify underneath the tools instead of forcing the tools to unify. That’s why this works politically, not just technically: nobody has to lose their workflow for everyone to gain one truth.
The reconciliation fight
The scene that made this piece necessary – a composite of meetings I keep ending up in, so nobody’s boss recognizes themselves.
Two senior managers, one metric, opposite conclusions. “Retention improved – look.” “Retention is down, it’s right here.” Twenty minutes of dueling dashboards while the actual agenda item – what to do about retention – never gets reached. The CEO finally asks the question that ends every one of these fights the same way: “Which number does the company actually run on?”
Silence. Because the honest answer was: neither. One dashboard counted paused subscriptions as retained; the other excluded a whole billing system; both were right by their own filters and flawed by anyone else’s. Two competent people, two defensible definitions, zero usable truth – and a decision postponed for a week that the business didn’t have.
The fight was never about the data. It was about the fact that nobody owned the definition. When the two sides are sales and finance, or marketing and sales, this guide compares the pairs line by line.
And here’s the aftermath nobody tracks: after a meeting like that, both managers went back and built more reporting – each reinforcing their own version. Reconciliation fights don’t converge on truth. They fund parallel truths.
Why the obvious fix keeps failing
Why the obvious fix keeps failing
Every CEO who’s sat through that meeting has been pitched the same cure: a semantic layer – model every metric, every dimension, every relationship, company-wide, once and forever.
The theory is sound. The economics usually aren’t. Full deployments typically span 6–12 months, and the honeymoon ends fast: per Hex’s State of Data Teams research, 57% of enterprises with vendor-native semantic layers are already considering platform changes. Meanwhile – and this is the part that matters in your conference room – the reconciliation fights continue for every one of those months, because the definitions unify at the end of the project, not the beginning.
For a mid-market company with one analyst, “model the universe first” isn’t a plan. It’s a way to spend a year not fixing Tuesday’s meeting.
There’s also a quieter failure mode: the moment the semantic layer becomes a project, it acquires a steering committee, a vendor evaluation, and a phase plan – and the analyst who actually knows where the definitions disagree becomes a stakeholder in someone else’s Gantt chart. The knowledge that could fix your metric fights this month gets queued behind the program that promises to fix all of them eventually.
“So we do need a semantic layer?”
“So we do need a semantic layer?”
No – you need about six metrics governed by Friday, and that’s a different project entirely. The terms themselves are set side by side in semantic layer vs data model vs Data Mart, with the cases where a semantic layer is the right buy.
Here’s the middle path the vendors skip because it’s too small to invoice: govern at the data mart level.
Don’t model the universe – define the handful of metrics your decisions actually touch: revenue, retention, CAC, margin, pipeline, whatever your Monday fights are about.
Your analyst authors each one once, in a governed data mart, scoped to what stakeholders actually consume – and every downstream surface, from reports to AI chats, reuses that definition automatically.
We call the philosophy ‘gentle semantization’: just enough ontology to end the arguments, applied exactly where the money is, shipped in weeks.

The full-semantic-layer project asks you to boil the ocean and then trust the steam. Mart-level governance asks your analyst for a week and returns your Monday meeting to you by the following one. If the six governed metrics prove out, extend to the next six. Governance should compound like interest, not launch like a moonshot.
Count the arguing minutes
One diagnostic, this week: in your next leadership meeting, quietly count the minutes spent establishing whose number is right rather than deciding what to do about it. That’s your reconciliation tax, and you pay it weekly.
Then run the small fix: pick the single most-argued-about metric, have your analyst define it once in a governed data mart, and connect it to the chat where you already work. Next meeting, there’s one number, it’s current as of the moment someone asked, and it traces to logic a human you employ wrote down. Start free – and give your analyst model.owox.com to map the definitions visually first. The report was wrong twice. You only have to fix it once.
Turn your data into decisions.
Governed data marts give you the clean foundation ML needs to actually work.
- No AI hallucinations
- Analyst-governed definitions
- Every number traces to SQL
Frequently Asked Questions
How fresh are on-demand governed answers?
As fresh as the data behind the data mart at the moment you ask — the answer is computed at question time, not assembled the Friday before. Freshness follows your data pipeline's cadence rather than the report calendar, which for most companies means current-day answers instead of last week's PDF.
How do you stop reconciliation meetings?
Remove the thing being reconciled: multiple definitions. When the most-argued-about metric has one governed definition computed by analyst-written SQL, there's nothing to referee — the meeting goes back to deciding what to do about the number instead of establishing it. Start with the single metric your leadership team argues about most.
What is gentle semantization (mart-level governance)?
Governing just enough: instead of modeling every metric company-wide, the analyst defines the handful of decision-critical metrics in governed data marts, scoped to what stakeholders actually consume. It applies ontology thinking exactly where the money is, ships in weeks, and compounds — the next six metrics follow the first six.
Do we need a semantic layer to fix conflicting numbers?
Usually not. Full semantic-layer deployments typically span 6–12 months, and 57% of enterprises with vendor-native semantic layers are already considering platform changes. Mart-level governance — defining just the metrics your decisions actually touch — ends the metric fights in weeks and can expand incrementally if it proves out.
What is a single source of truth for metrics?
One authored definition per metric — its logic, joins, and quality checks — owned by the data analyst in a governed data mart, and reused by every report, spreadsheet, and AI answer downstream. It's not one tool everyone must use; it's one definition every tool drinks from.
Why is my weekly report always out of date?
Scheduled reporting is a batch format: assembled Friday, read Monday, describing the week before. The gap between "when the data was true" and "when you act" is built into anything that arrives on a schedule. On-demand asking — where the answer is computed from governed data marts at decision time — removes the latency instead of shrinking it.
Why do reports show different numbers for the same metric?
Because each dashboard quietly becomes its own analytics system — its own filters, date logic, and definition of the metric, each reasonable in isolation. Without one owned definition, teams build parallel versions that were never designed to match. The fix is structural: define each metric once in a governed data mart and have every surface reuse it.