

Vibe analytics is a hallucination machine
AI querying raw warehouses gets 10-51% accuracy. Governed data marts push it to 90-100%. Here is the data and the fix.


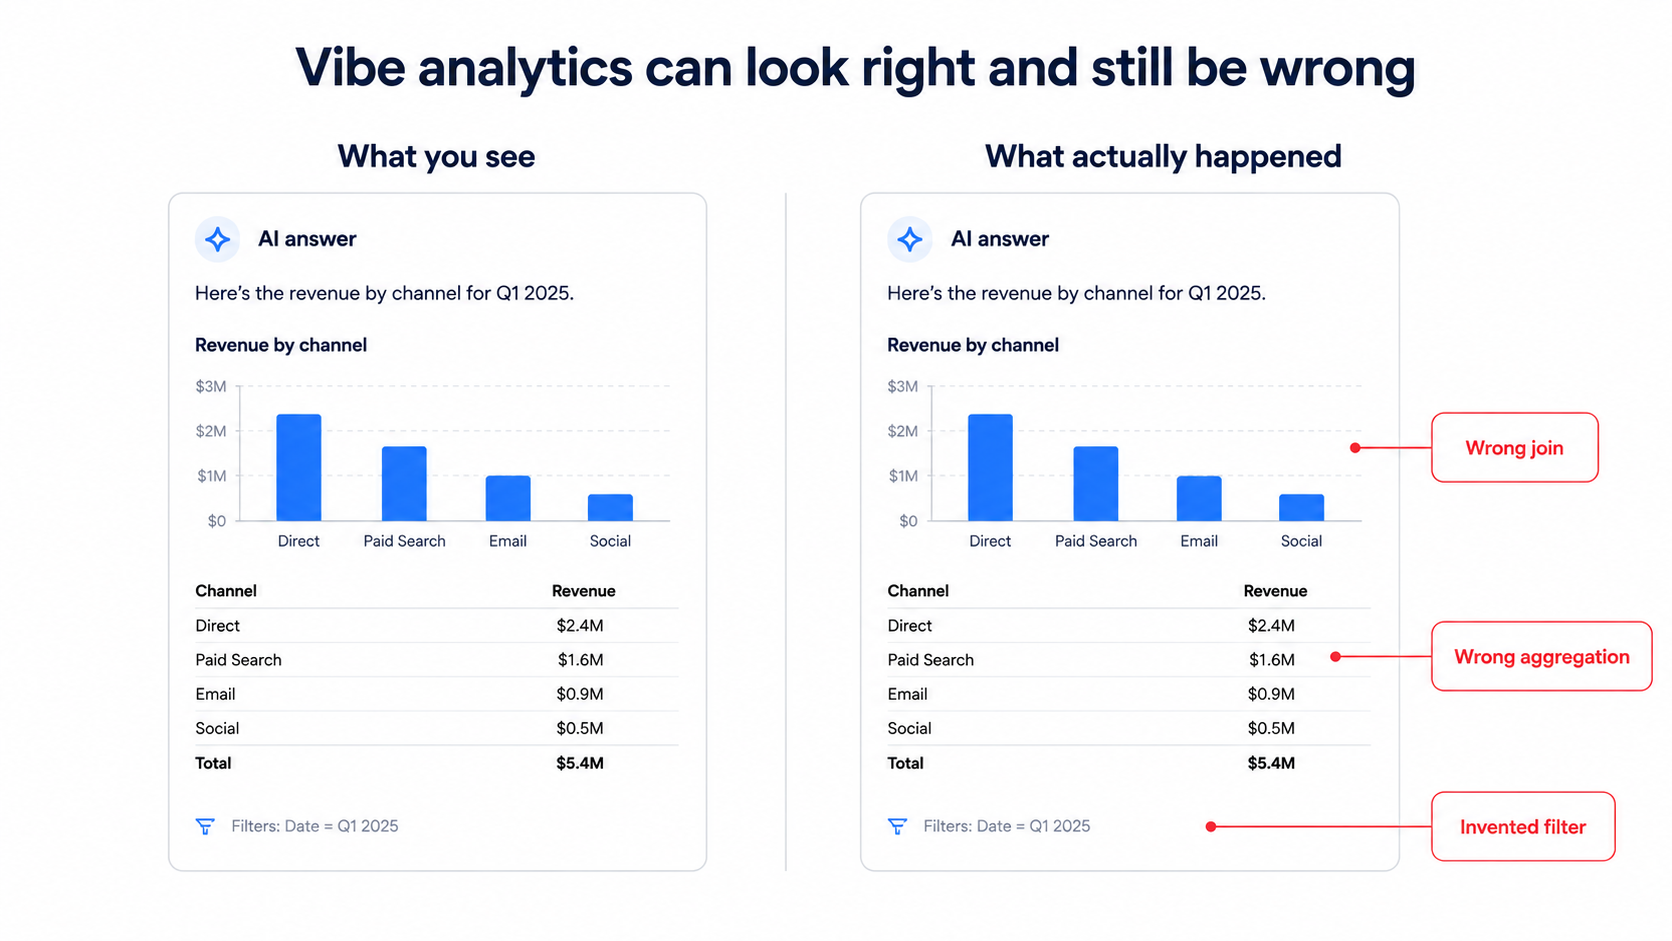
Picture this: your CEO opens ChatGPT, types "show me revenue by channel for Q2," and gets a clean table with a chart in under ten seconds. The room erupts. No ticket filed, no analyst pulled off a sprint, no two-week wait. Just a question and an answer.
But typically, with most of the other tools, there is only one problem. The answer is wrong.
The AI joined two tables that should never touch, summed a column that needed to be averaged, and pulled from a staging table instead of the production one. The chart looked perfect. The numbers were hallucinated. And nobody caught it for three months.
This is the reality of vibe analytics – the fast-growing trend of using natural language to query data warehouses directly. The promise is real: faster insights, broader data access, and fewer bottlenecks. But without the right data architecture underneath, vibe analytics is not analysis. It is a hallucination machine.
This article breaks down why AI hallucinates your data, what the accuracy numbers actually say, and how governed data marts transform vibe analytics from a liability into a reliable tool.
What vibe analytics actually is (and why everyone wants it)
The term captures something genuinely powerful – the ability for anyone to ask a data question in plain English and get an answer without writing SQL. Here is why the hype is justified, and where it breaks down.
The promise – natural language to instant insights
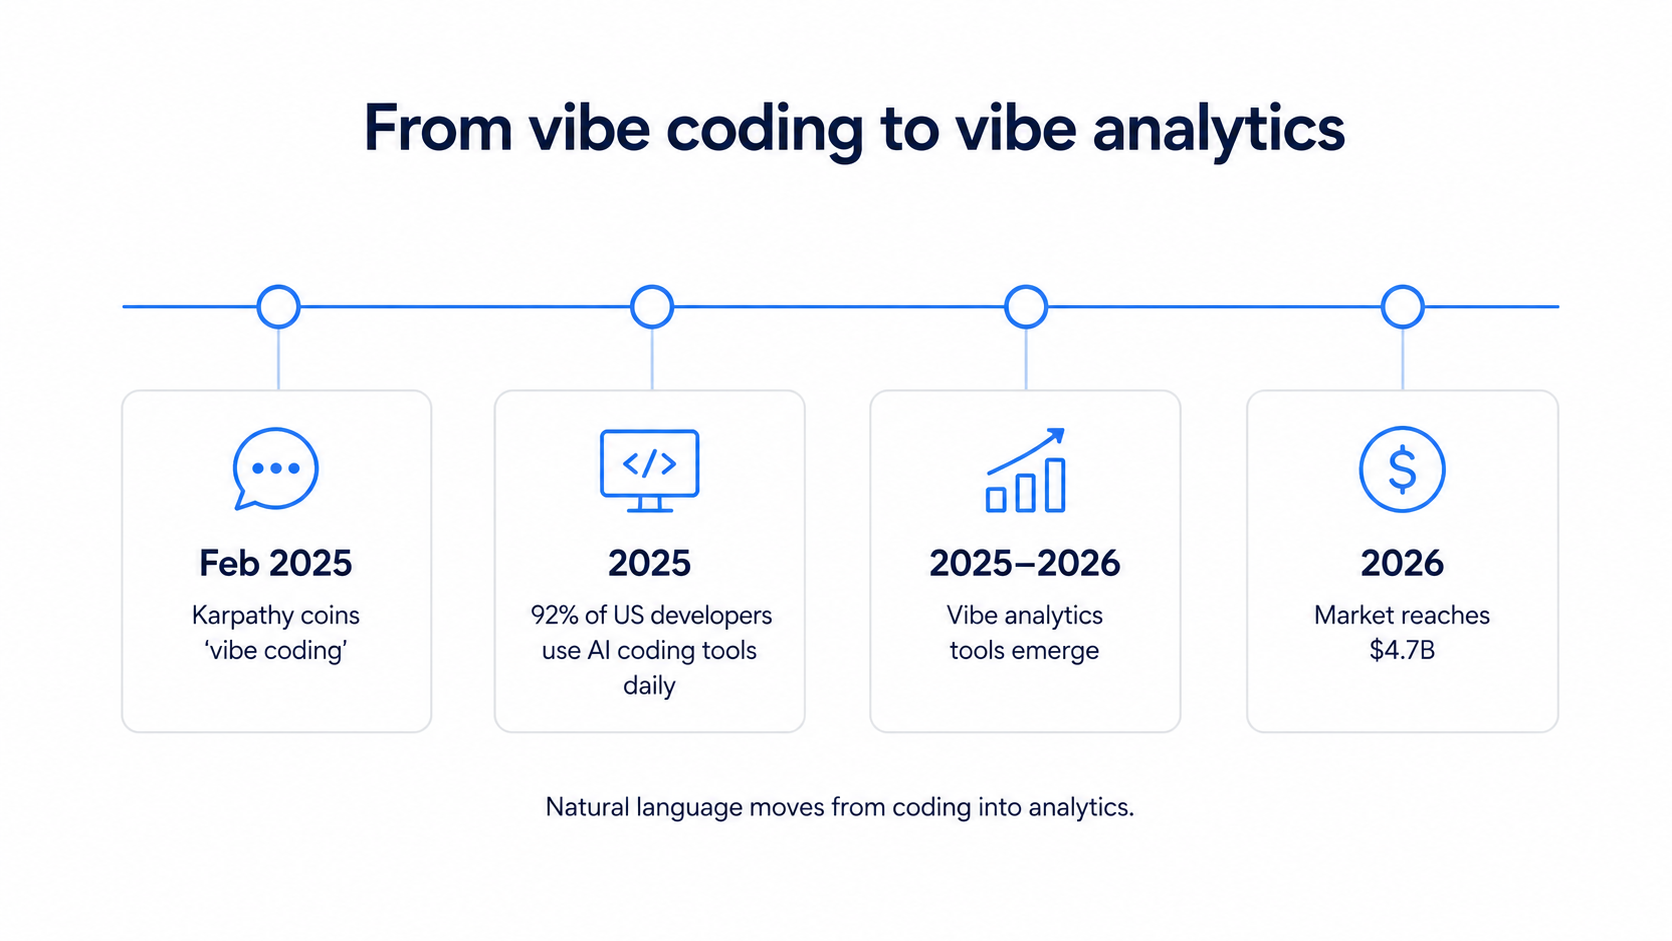
Vibe analytics applies the "vibe coding" concept – coined by Andrej Karpathy in February 2025 – to data analysis. Instead of writing SQL queries, users describe what they want in natural language. An LLM interprets the request, generates a query, executes it against a database, and returns results as charts, tables, or narrative explanations.
The products are already here. Databricks AI/BI Genie, Snowflake Intelligence, ThoughtSpot Spotter, and Tableau Pulse all offer some version of this workflow. The appeal is obvious: a marketing director who waited three days for a campaign performance report can now get it in seconds.
From vibe coding to vibe analytics – the trend timeline
The adoption numbers are staggering. 92% of US developers now use AI coding tools daily, and 63% of vibe coding users are non-developers – product managers, marketing directors, startup founders, and designers. The vibe coding market hit $4.7 billion in 2026, with projections reaching $12.3 billion by 2027 at a 38% CAGR.
The extension into data analysis was inevitable. If AI can write application code from a description, why not SQL? If it can build a web app, why not a dashboard?
The answer to that question is the rest of this article.
What happens when the CEO queries the warehouse
The demo always works. The production warehouse never behaves like the demo. Here is the gap that turns excitement into bad decisions.
The demo versus reality gap
Demo environments have five tables with clear names: `customers`, `orders`, `products`, `revenue`, `channels`. Your enterprise warehouse has 500+ tables, seven of which contain some version of "revenue," four staging tables that look identical to production tables, and naming conventions that evolved across three data teams over five years.
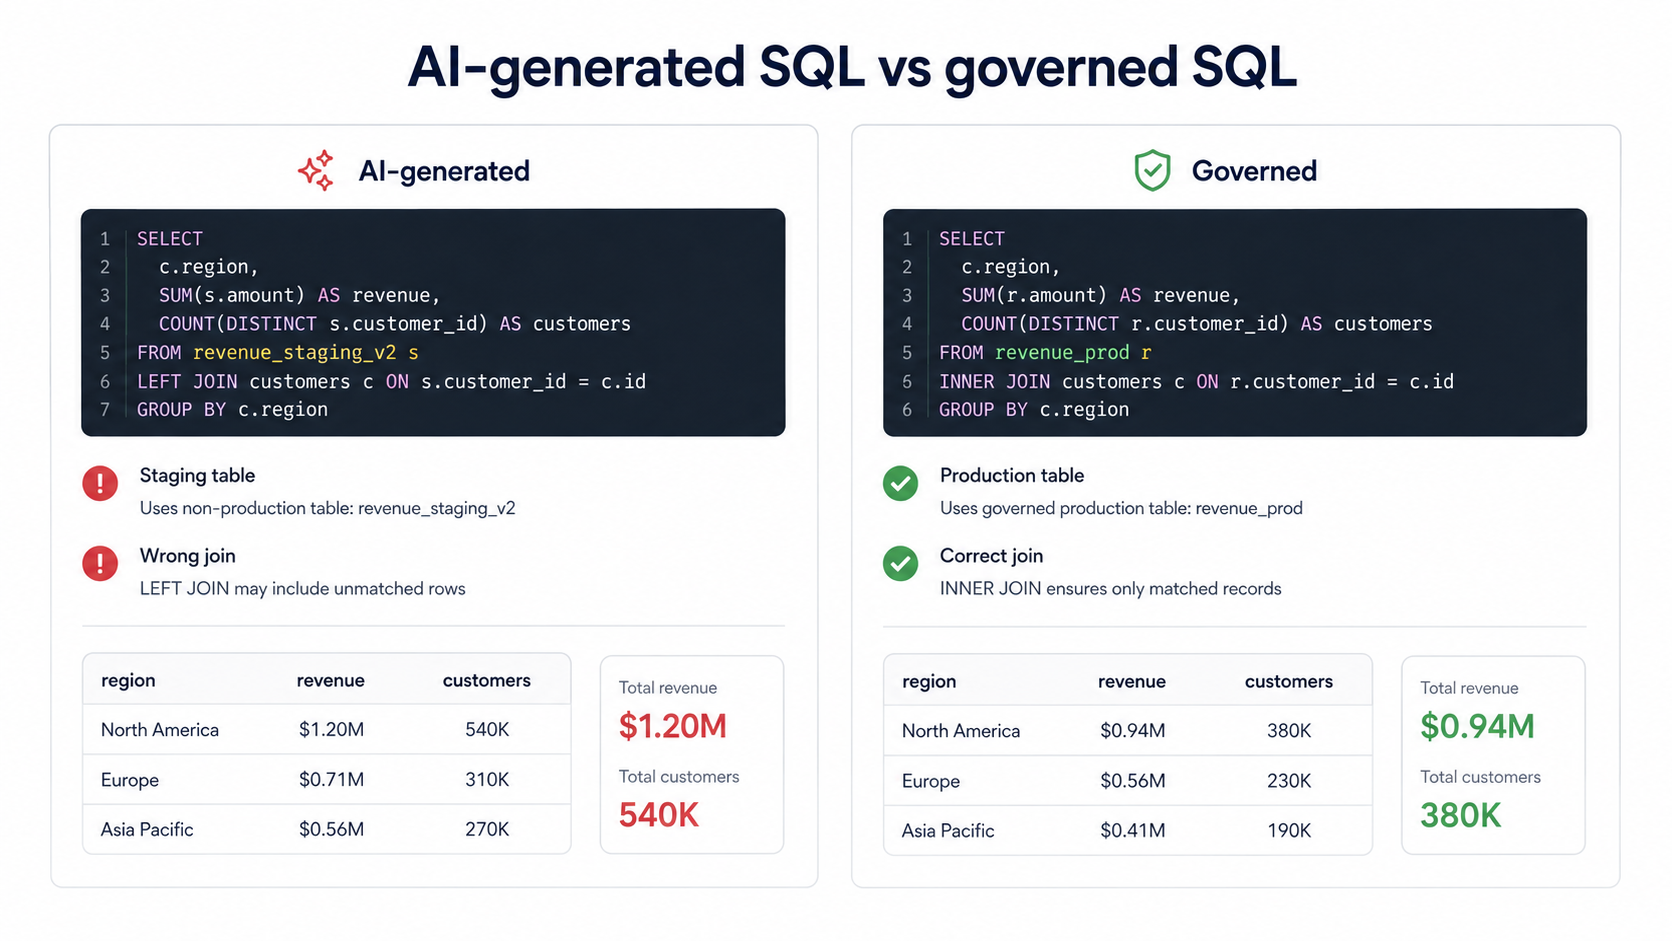
When an AI tool queries this environment, it makes decisions that look reasonable but are fundamentally wrong. It picks `revenue_staging_v2` instead of `revenue_prod` because the staging table was modified more recently. It joins `users` to `event_logs` on `user_id` without understanding that one table has one row per user and the other has one row per event, instantly inflating every metric.
The most dangerous part: AI delivers these wrong answers with more confidence than correct ones. Research shows that AI models use 34% more confident language – words like "definitely," "certainly," and "without doubt" – when generating incorrect information compared to correct information.
Real failure patterns in AI-generated warehouse queries
Here are the patterns that show up in practice:
- A LEFT JOIN where an INNER JOIN was needed, silently including null values that inflated the customer count by 40%
- A query pulling from `ga4_events_intraday` (partial day data) instead of `ga4_events` (complete daily export), understating traffic by half
- A SUM on a column that contained running totals, effectively double-counting revenue across months
- A WHERE clause filtering `status = 'active'` when the actual column uses numeric codes (`status = 1`), returning zero rows but not erroring out
None of these queries fail. They all run. They all return results. They all look correct. That is what makes them dangerous.
Three ways AI hallucinates your data
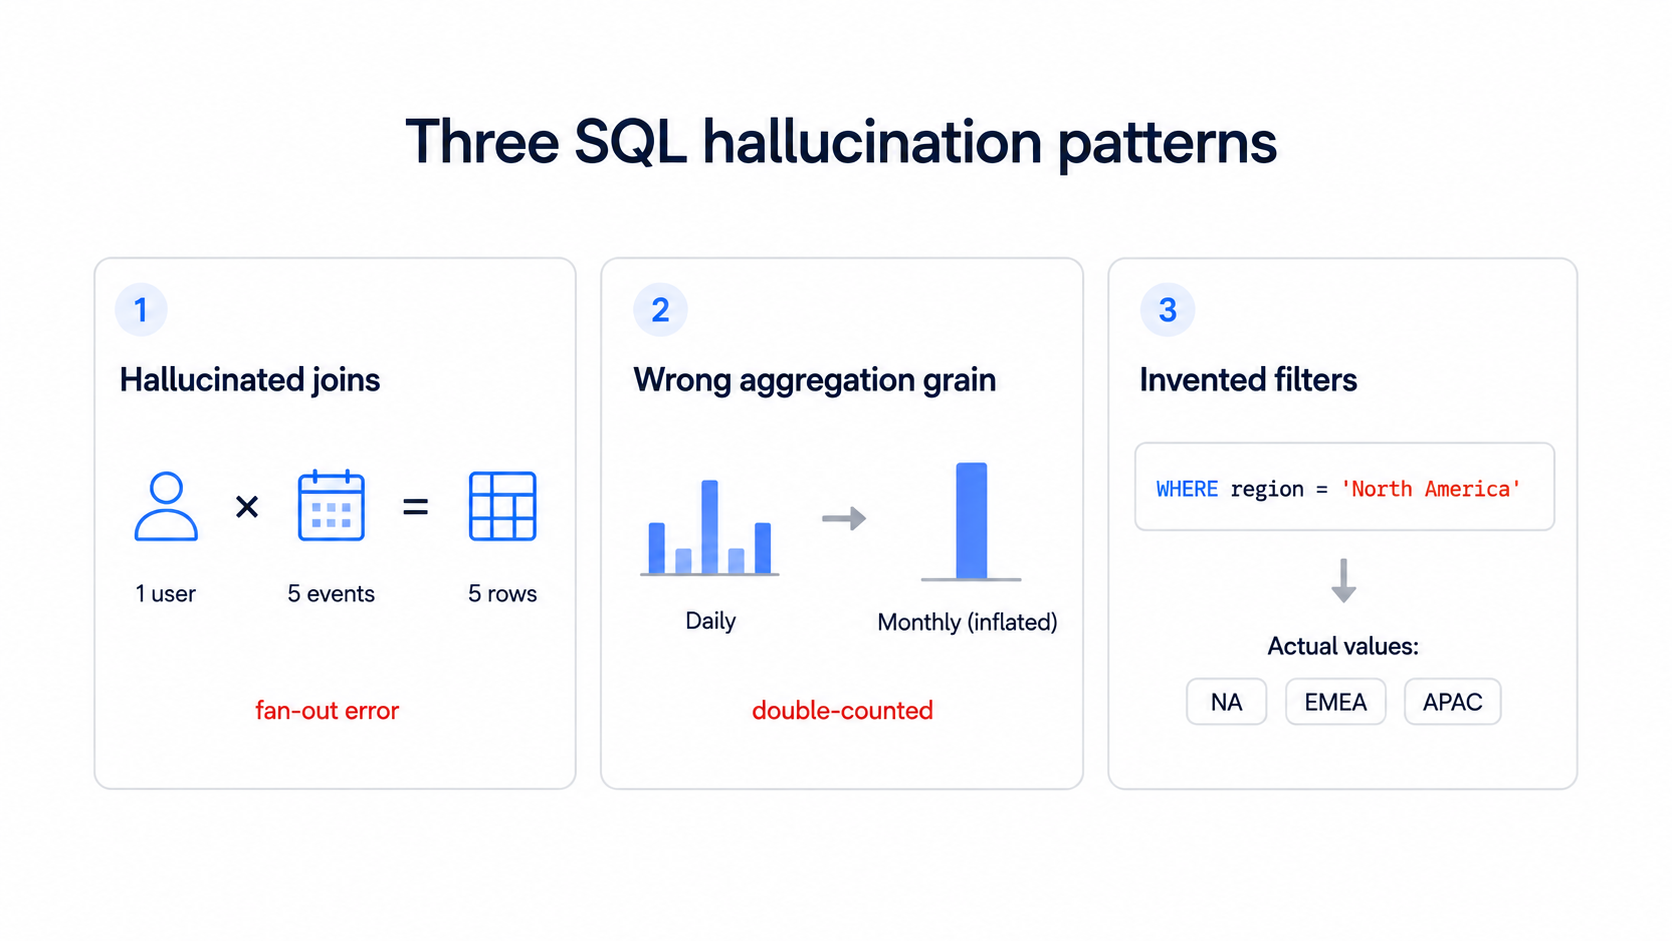
AI does not hallucinate data the way it hallucinates text. It does not invent facts from thin air. Instead, it fabricates structural references – column names, table joins, filter values, and aggregation logic – that appear plausible but do not correspond to your actual database schema or business intent. Here are the three most common failure modes.
Hallucinated joins – connecting tables that should not touch
This is the most common and most damaging failure. The AI sees two tables with a column called `user_id` and joins them. Logical, right?
Except one table (`dim_users`) has one row per user, and the other (`fact_page_views`) has one row per page view. The join produces a fan-out: every user row multiplied by their page view count. Your "total users" metric now reads 47 million instead of 380,000.
The AI had no way to know that these tables should connect through an intermediate table, or that the correct join path requires filtering on session-level deduplication first. It guessed. And its guess looked perfectly reasonable.
Wrong aggregation grain – daily data answered as monthly
A marketing VP asks: "What was our monthly ad spend by channel?"
The AI finds a table called `ad_costs_daily` and writes `SELECT channel, SUM(cost) FROM ad_costs_daily`. It returns a number. But it did not GROUP BY month.
Or it grouped by month but forgot that the table contains both estimated and final values, double-counting the last three days of each month.
Aggregation grain errors are particularly insidious because the output looks reasonable. Monthly ad spend of $127,000? Sure, that could be right. Except the actual number is $94,000, and the difference – $33,000 – was double-counted daily estimates.
Invented filters – WHERE clauses from nowhere
The AI applies filters based on column names it inferred from context.
It sees a column called `campaign_status` and assumes `WHERE campaign_status = 'active'` is appropriate. But the column uses `1` for active and `0` for paused. The query runs, returns results, and the filter did nothing – or excluded everything.
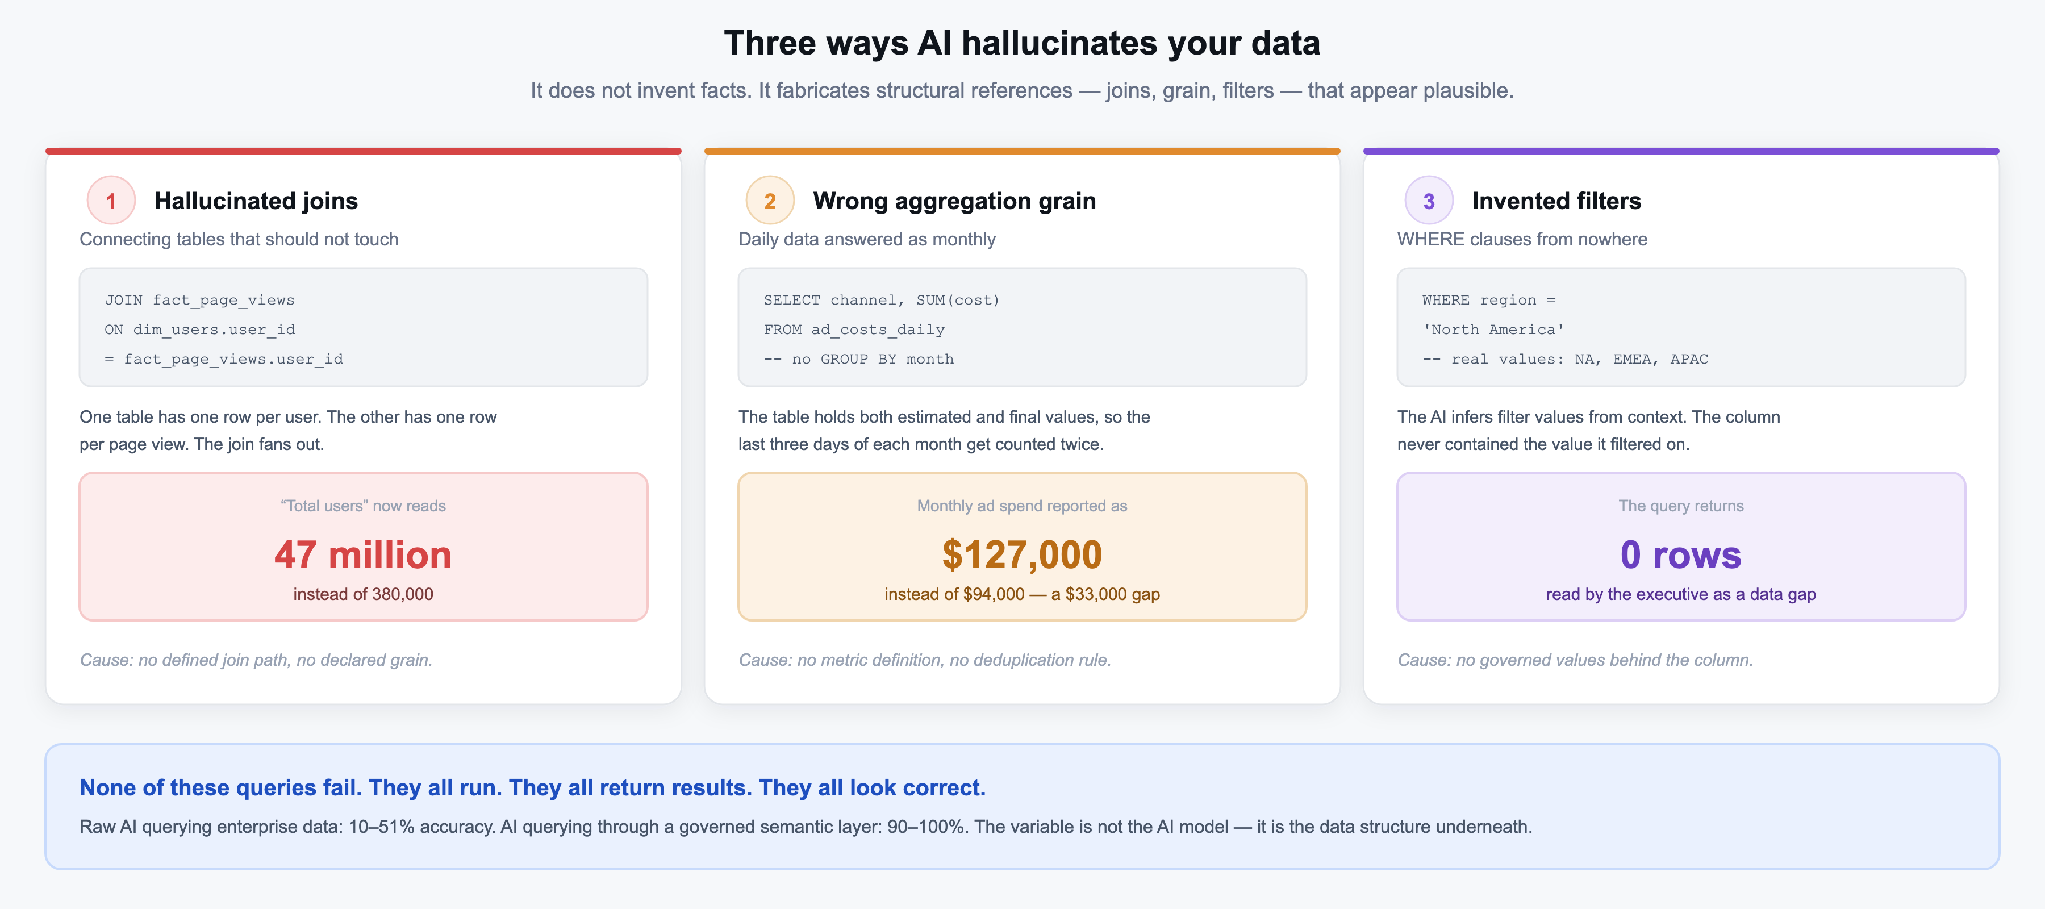
Worse, the AI sometimes invents filter values that do not exist in the data. It might filter `WHERE region = 'North America'` when the actual values are `NA`, `EMEA`, `APAC`. The query returns zero rows, and the AI helpfully reports: "There is no data for North America in this period."
The executive reads this as a data gap. It is actually a hallucinated filter.
The numbers behind the hallucination
The gap between what vibe analytics promises and what it delivers is not a feeling. It is measurable. And the numbers are worse than most people expect.
Text-to-SQL accuracy – what the benchmarks actually say
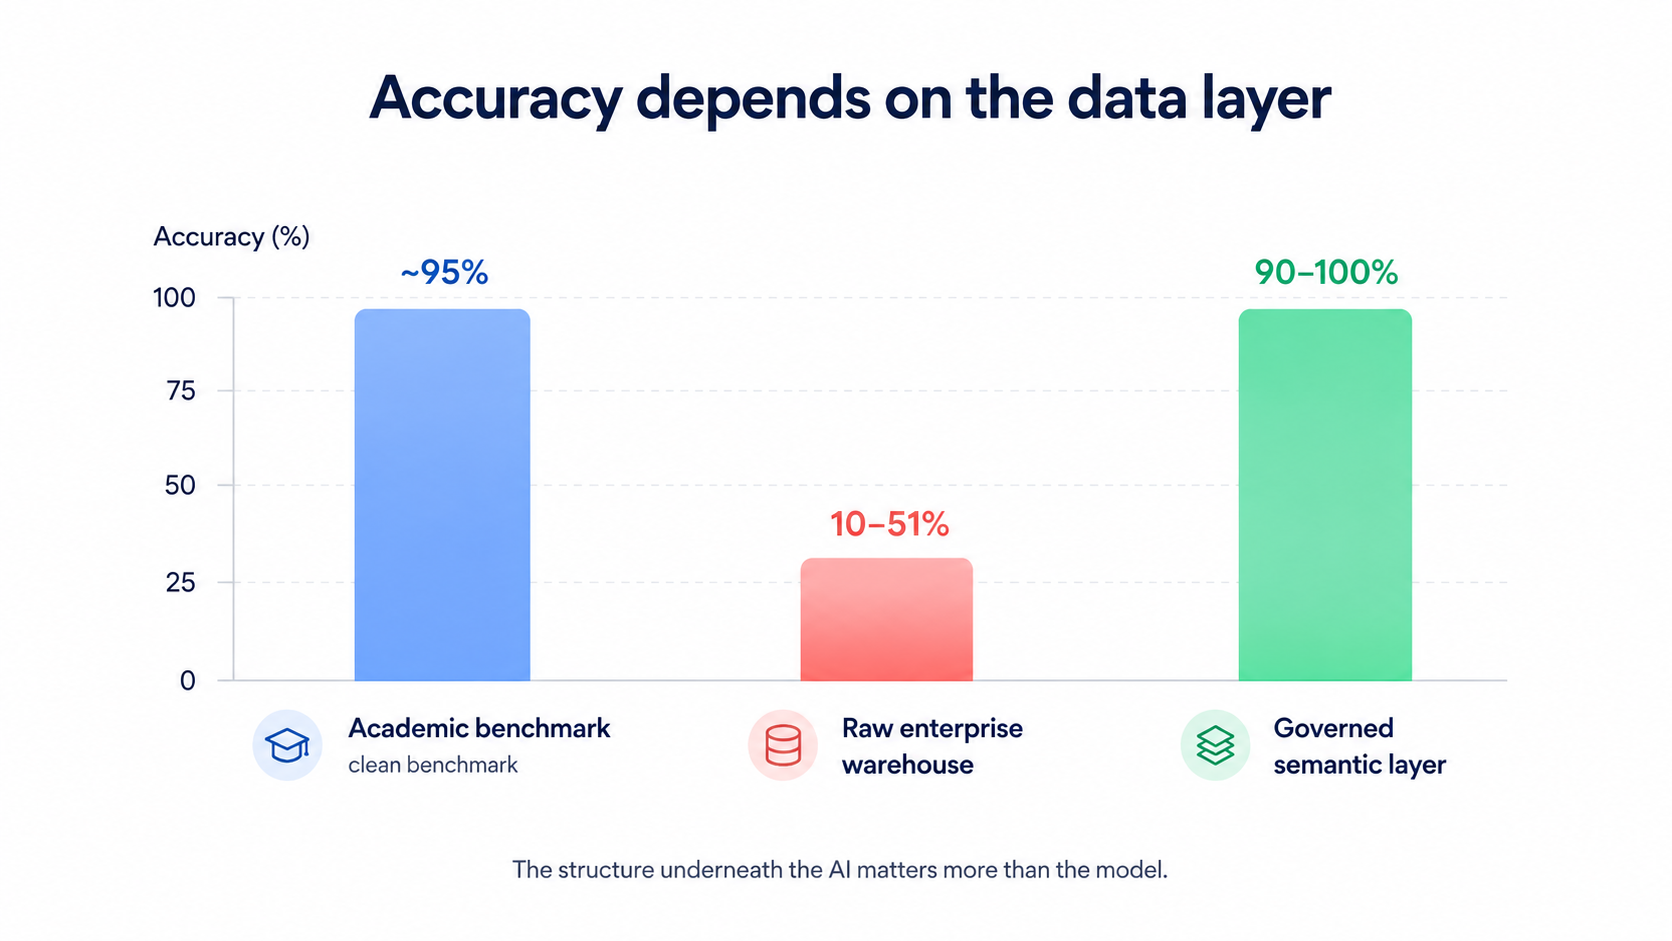
Academic benchmarks like Spider 1.0 make text-to-SQL tools look impressive. Models score well on clean, well-documented schemas with straightforward queries.
Enterprise reality tells a different story.
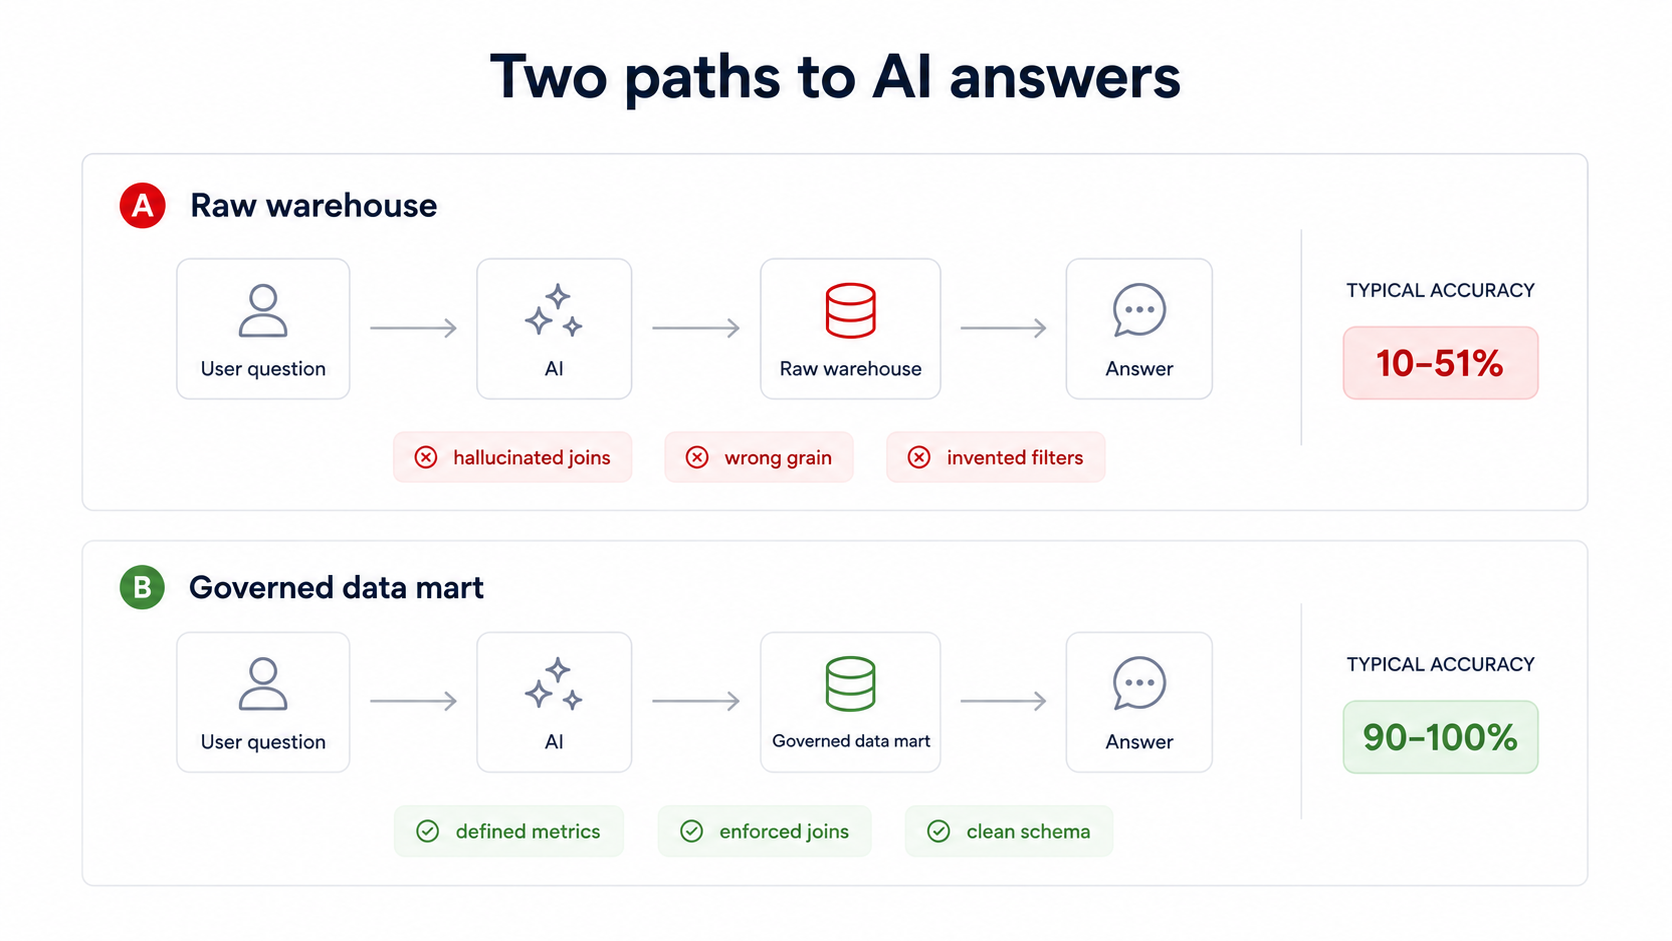
The pattern is clear. Raw AI querying enterprise data: 10–51% accuracy. AI querying through a governed semantic layer: 90–100%. The variable is not the AI model. It is the data structure underneath.
The confidence gap – AI is more certain when it is wrong
This is perhaps the most alarming finding. When generating incorrect information, AI models use 34% more confident language than when generating correct information. The wrong answer does not come with a caveat. It comes with "definitely" and "certainly."
51% of organizations using AI have seen at least one negative consequence from AI-generated outputs. Nearly one-third reported consequences specifically from AI inaccuracy.
A forensic review of KPMG's October 2025 AI report found that only 5 of its 45 citations correctly pointed to the cited source. The rest ranged from misleading to partially fabricated. GPTZero coined the term "vibe citing" for this pattern – where AI stitches together fragments of real sources into references that look convincing until someone actually checks.
What wrong numbers actually cost
AI hallucinations cost businesses $67.4 billion globally in 2024, and that figure is growing as enterprise AI adoption reaches 85%. When a hallucinated data point enters an executive dashboard, it does not stay there. It propagates into board presentations, budget allocations, campaign decisions, and downstream reports.
One wrong join that inflates customer count by 40% does not just produce a wrong number. It produces a wrong strategy built on that number.
Better prompts will not fix this
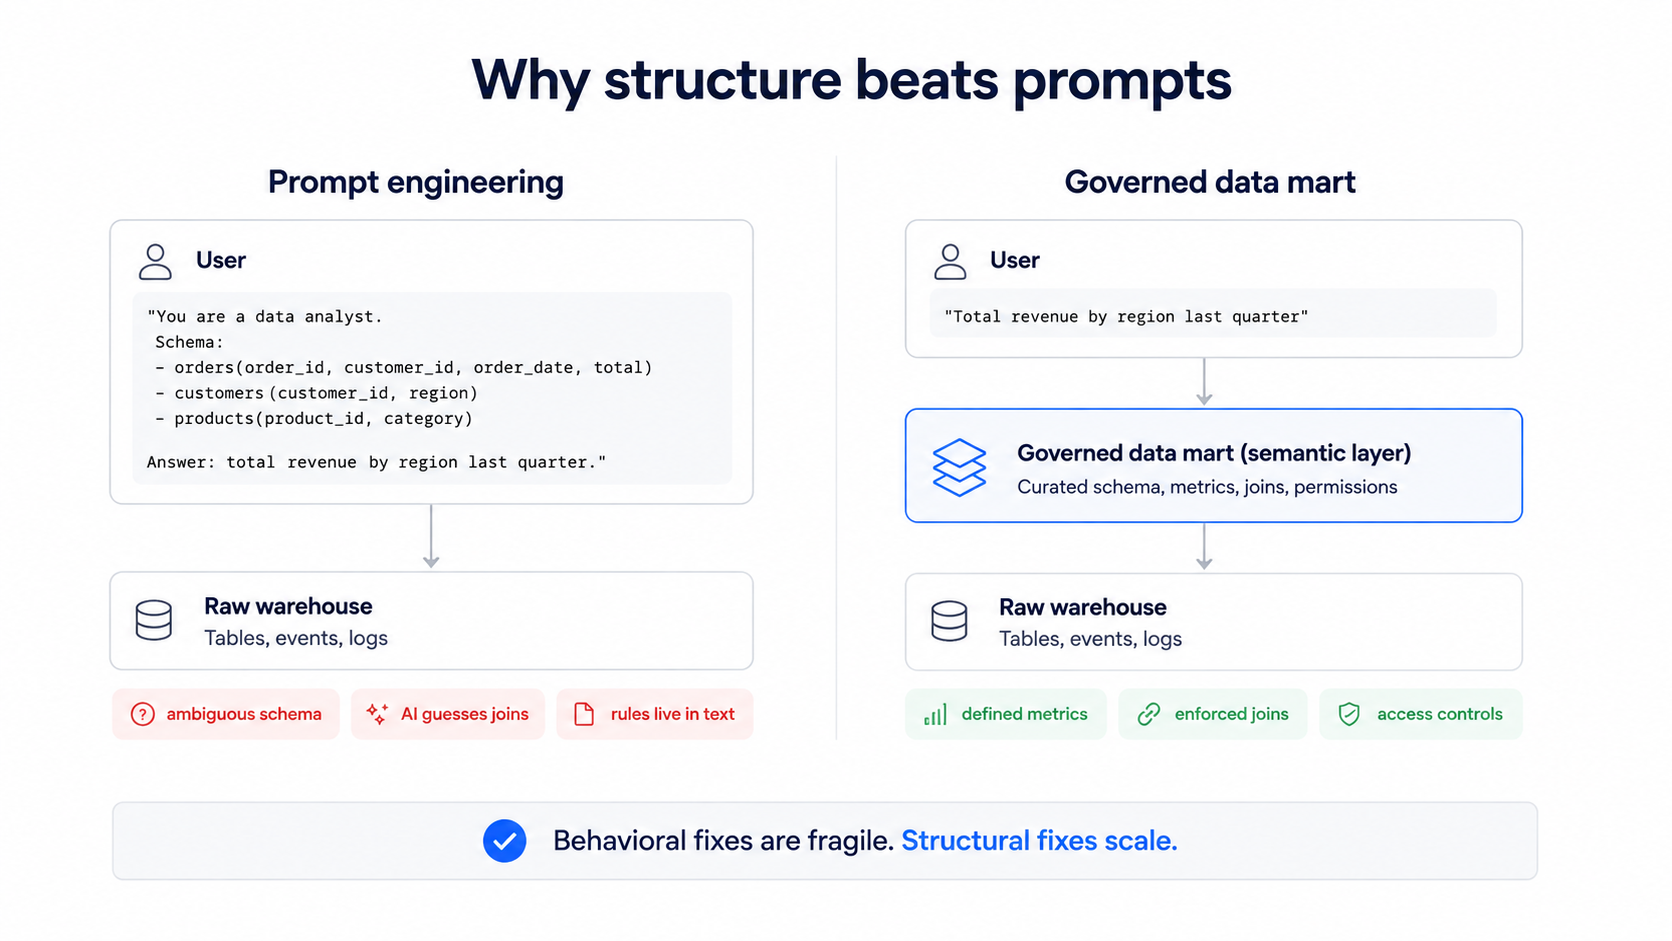
The most common response to AI hallucination is: "We just need better prompts." This is wrong, and understanding why it is wrong is the key to actually solving the problem.
Why prompt engineering fails at data governance
A prompt cannot encode:
- Which of seven "revenue" tables is the canonical one
- That `campaign_status = 1` means "active" in your system
- That daily rows need deduplication before monthly aggregation
- That the finance team's definition of "churn" differs from the product team's
- That certain tables require row-level security filtering
You can write a thousand-word system prompt describing your schema. The AI will still hallucinate joins between tables it has never been taught to connect. A 2025 mathematical proof confirmed that hallucinations cannot be fully eliminated under current large language model architectures. The tendency to generate plausible-but-wrong outputs is structural to how these models work.
The missing context problem
When AI queries a raw warehouse, it is working with table names and column names. That is it. It has no visibility into:
- Metric definitions – what "revenue" means in your business (gross? net? recurring? one-time?)
- Relationship maps – which tables connect to which, through what keys, at what grain
- Business rules – how to handle refunds, prorations, currency conversion, fiscal year boundaries
- Access policies – what data the requesting user is authorized to see
- Freshness guarantees – whether the table was updated today or three weeks ago
The AI fills these gaps with guesses. And 34% more confident guesses at that.
Governed data marts as AI guardrails
The solution to AI hallucination is not better AI. It is better data. Specifically, it is a governed layer between the AI and the raw warehouse that provides the context AI needs to generate correct queries. This is what governed data marts do.
What a governed data mart gives AI that a raw warehouse cannot
A governed data mart is a pre-structured, business-ready data layer with:
- Clean, descriptive column names – `total_revenue_usd_net` instead of `rev_col_3b`
- Pre-defined metric calculations – revenue, CAC, ROAS, and LTV calculated once, correctly, with documented formulas
- Enforced join paths – the mart defines exactly which tables connect and how, eliminating the possibility of hallucinated joins
- Single grain per table – one row per customer, one row per day, one row per campaign. No ambiguity about what each row represents
- Row-level access controls – the data the AI can see is already filtered to what the requesting user is authorized to access
- Freshness metadata – the AI knows when the data was last updated and can flag stale results
This is the difference between giving AI a library of unlabeled filing cabinets (raw warehouse) and giving it a well-organized reference desk (governed data mart).
From 10% accuracy to 90%+ with the right data layer
The accuracy table above tells the entire story. The same AI model that achieves 10–51% accuracy on raw enterprise data reaches 90–100% accuracy when querying through a semantic layer.
The jump is not because the model got smarter. It is because the data got clearer. When column names are descriptive, join paths are defined, metrics are pre-calculated, and grain is unambiguous, the AI's job shrinks from "figure out the entire data model" to "translate this question into a query against a well-documented schema."
That is a problem LLMs can actually solve reliably.
The governance stack – metrics, joins, access, freshness
Four pillars make a data mart AI-safe:
When all four are in place, vibe analytics stops being a hallucination machine and starts being what it promised: fast, accessible, trustworthy data analysis.
Vibe analytics done right – the OWOX approach
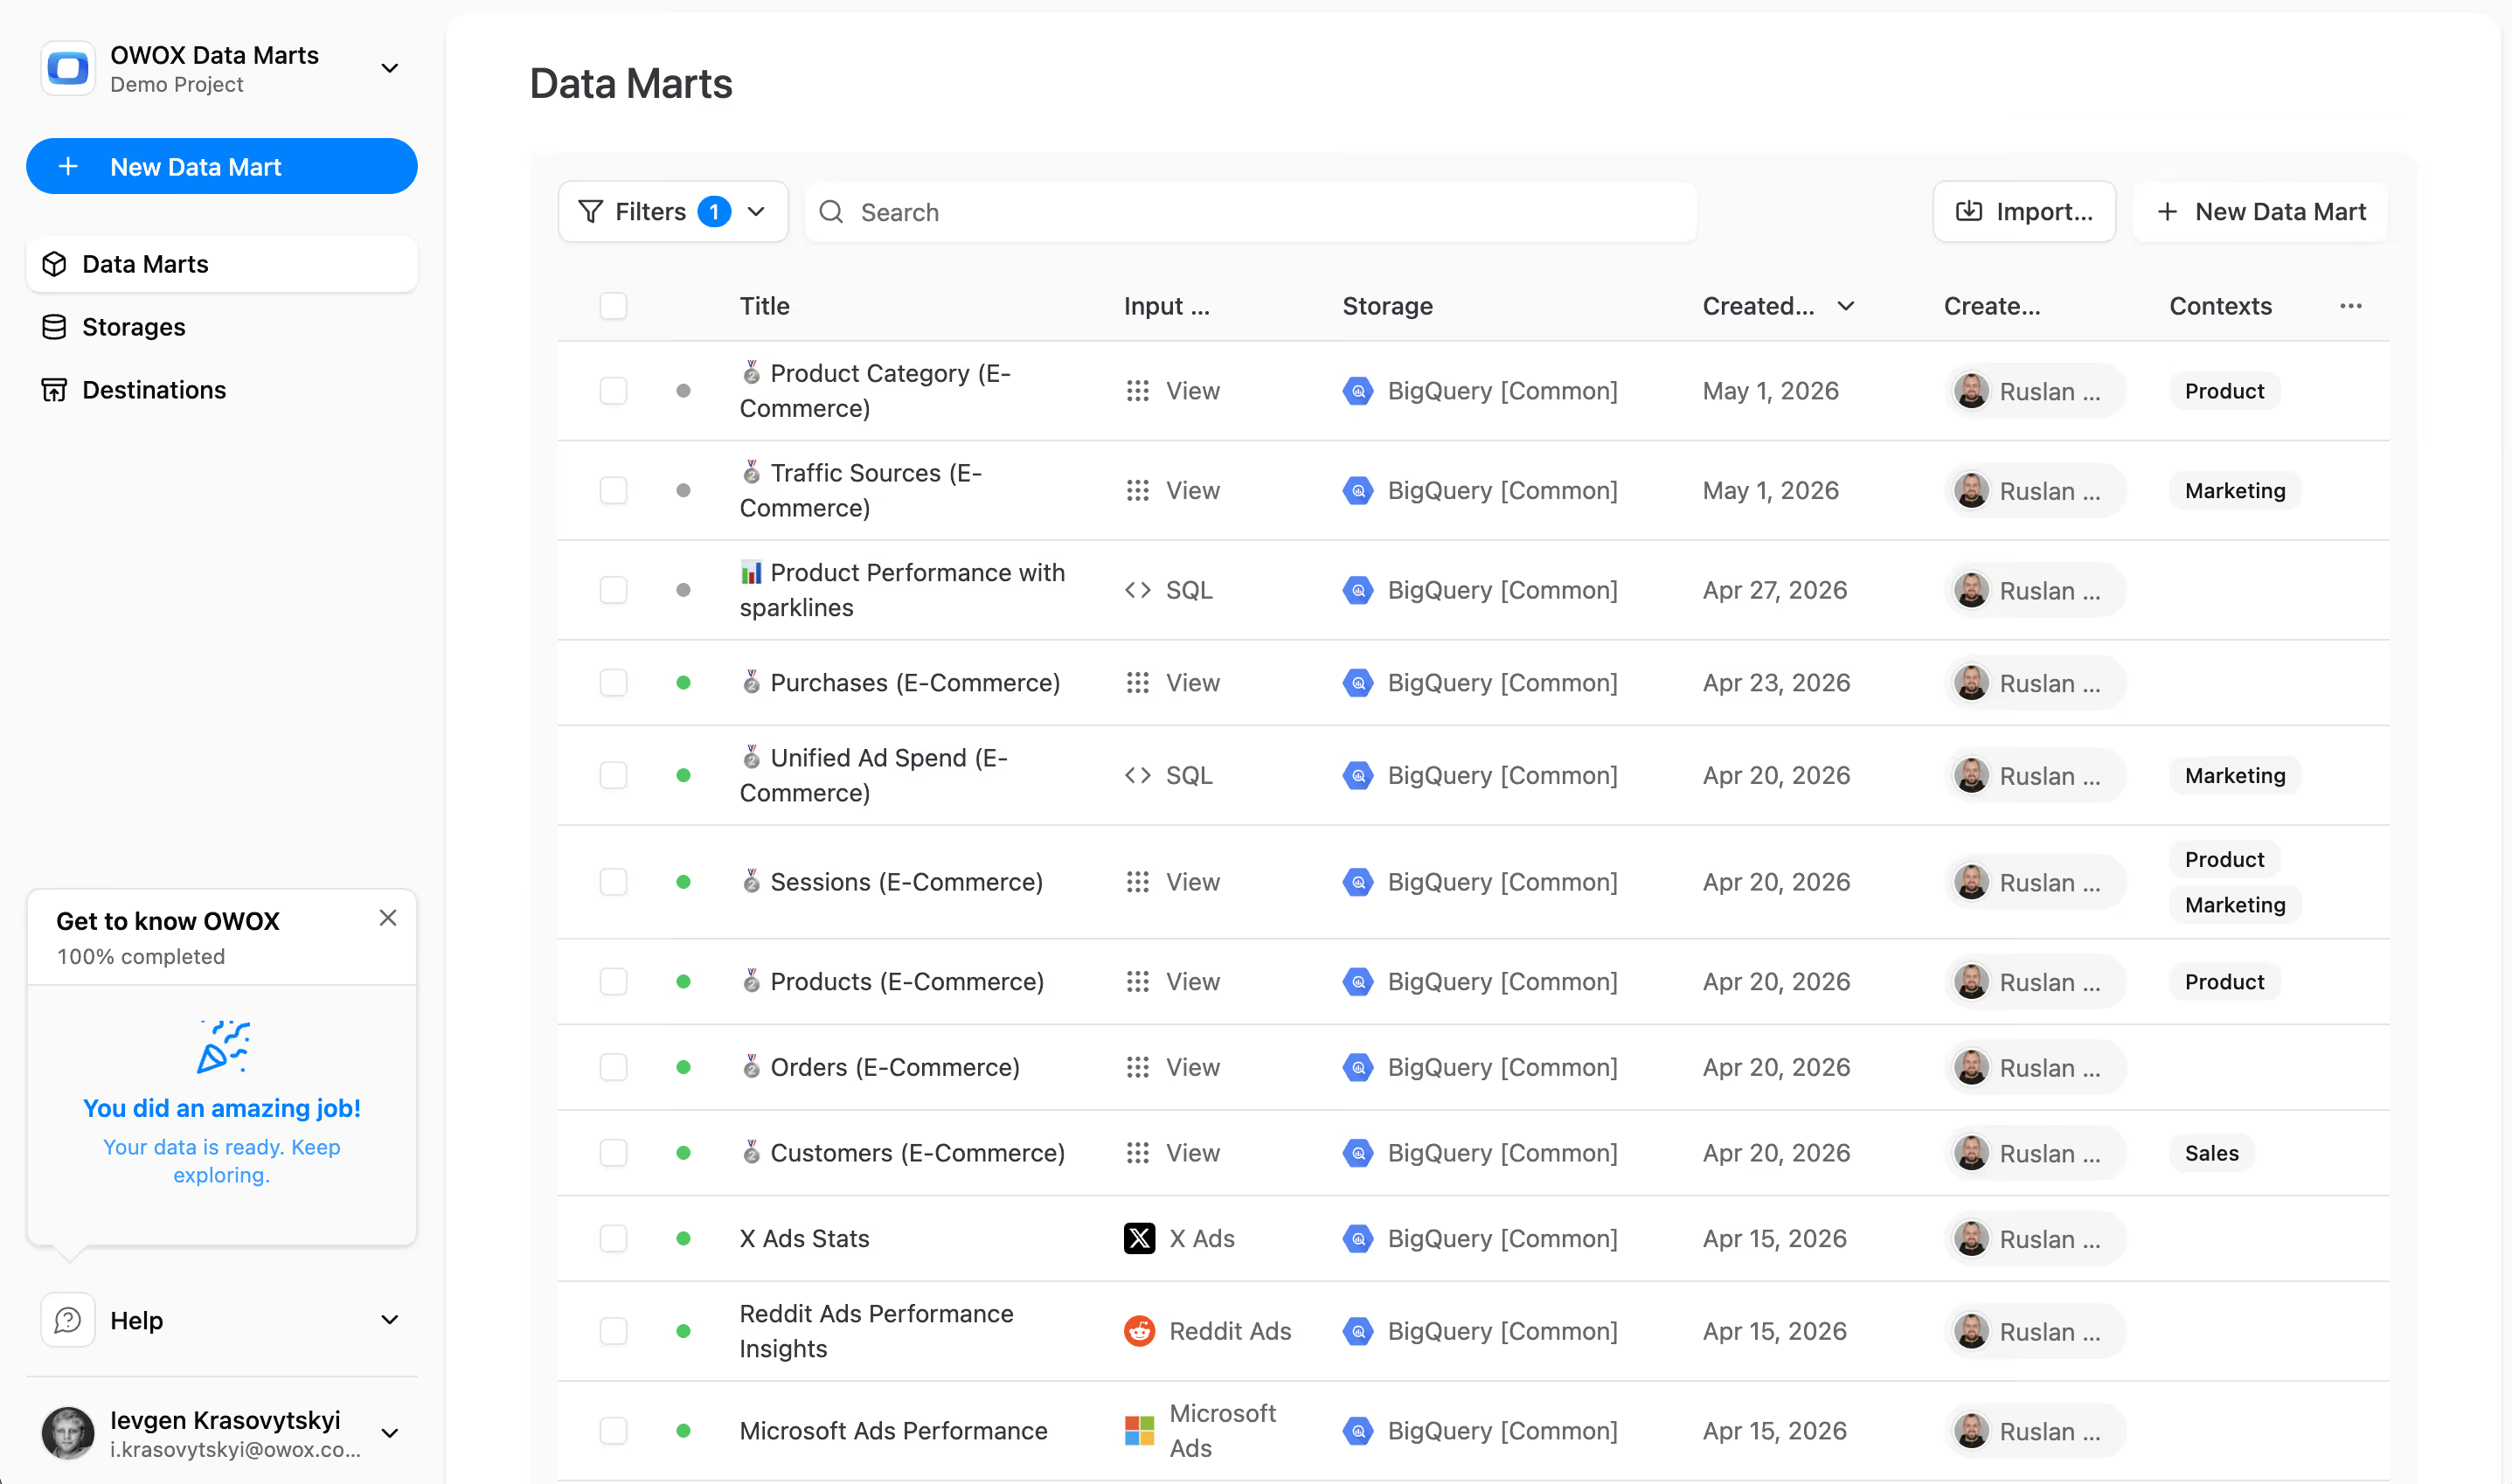
The principles above are not theoretical. OWOX implements them as a product – building governed data marts that sit between your raw warehouse and any AI tool, human analyst, or reporting layer that needs to query your data.
How OWOX structures data marts for AI readability
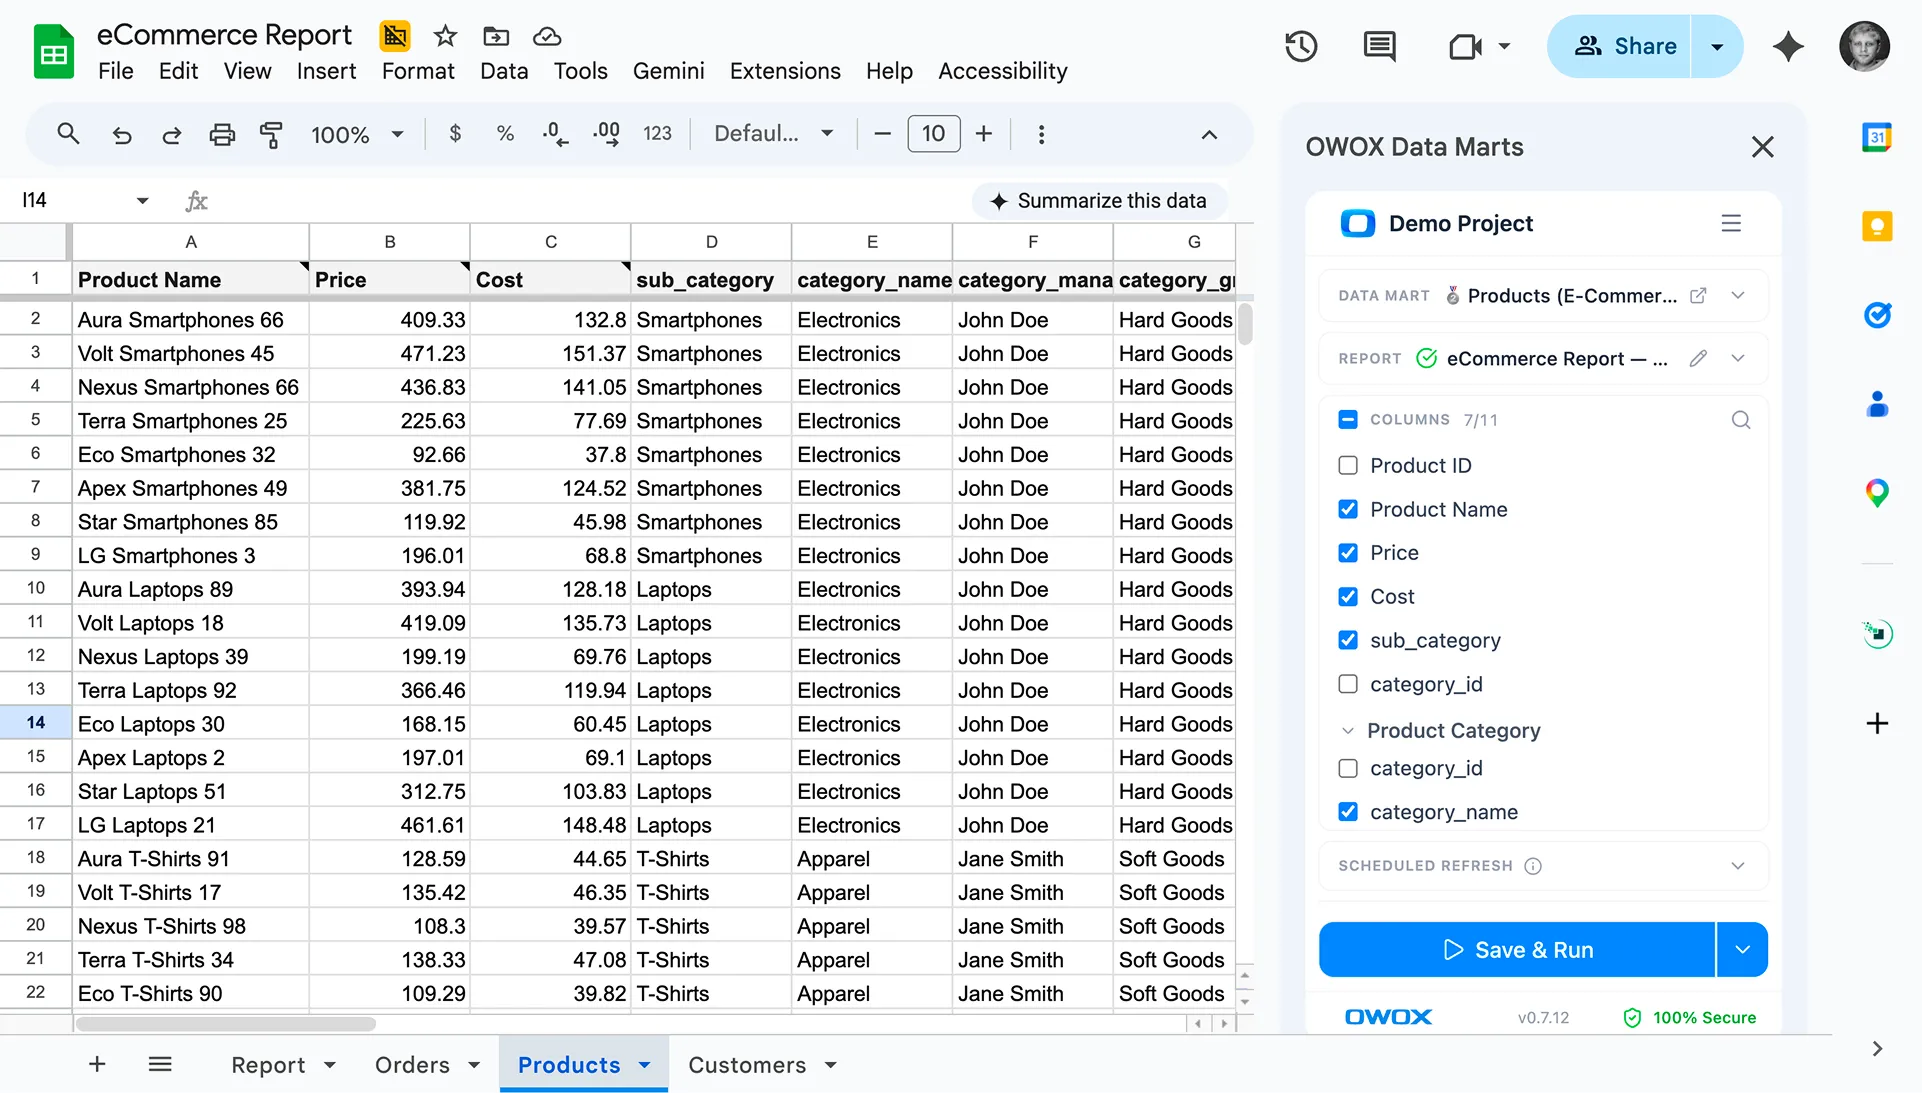
OWOX data marts use flat, wide table designs with business-friendly column names. Instead of requiring AI to navigate dozens of normalized tables and guess at join logic, each data mart presents a single, pre-joined table where:
- Every column name describes what it contains in plain language
- Every metric is pre-calculated according to your business definitions
- Every row represents a single, unambiguous unit (one customer, one day, one campaign)
- Join paths between data marts are explicitly defined and enforced
This architecture eliminates the three hallucination types described earlier. There are no ambiguous joins to hallucinate, no grain mismatches to miscalculate, and no cryptic column names for the AI to misinterpret.
Pre-built governance for marketing and business data
Setting up governed data marts in OWOX takes minutes, not months.
Connect your data warehouse as a storage, import your data sources, and create data marts with clean output schemas and joins and pre-defined calculations.
The result is a governed data layer that any AI tool – ChatGPT, Claude – can query accurately.
The governance lives in the data structure, not in the prompt. That is the difference between hoping your AI gets the right answer and knowing it will.
I've seen teams go from filing tickets for every data question to self-service analytics that actually works – not because the AI got smarter, but because the data got organized.
The governance checklist for AI-powered analytics
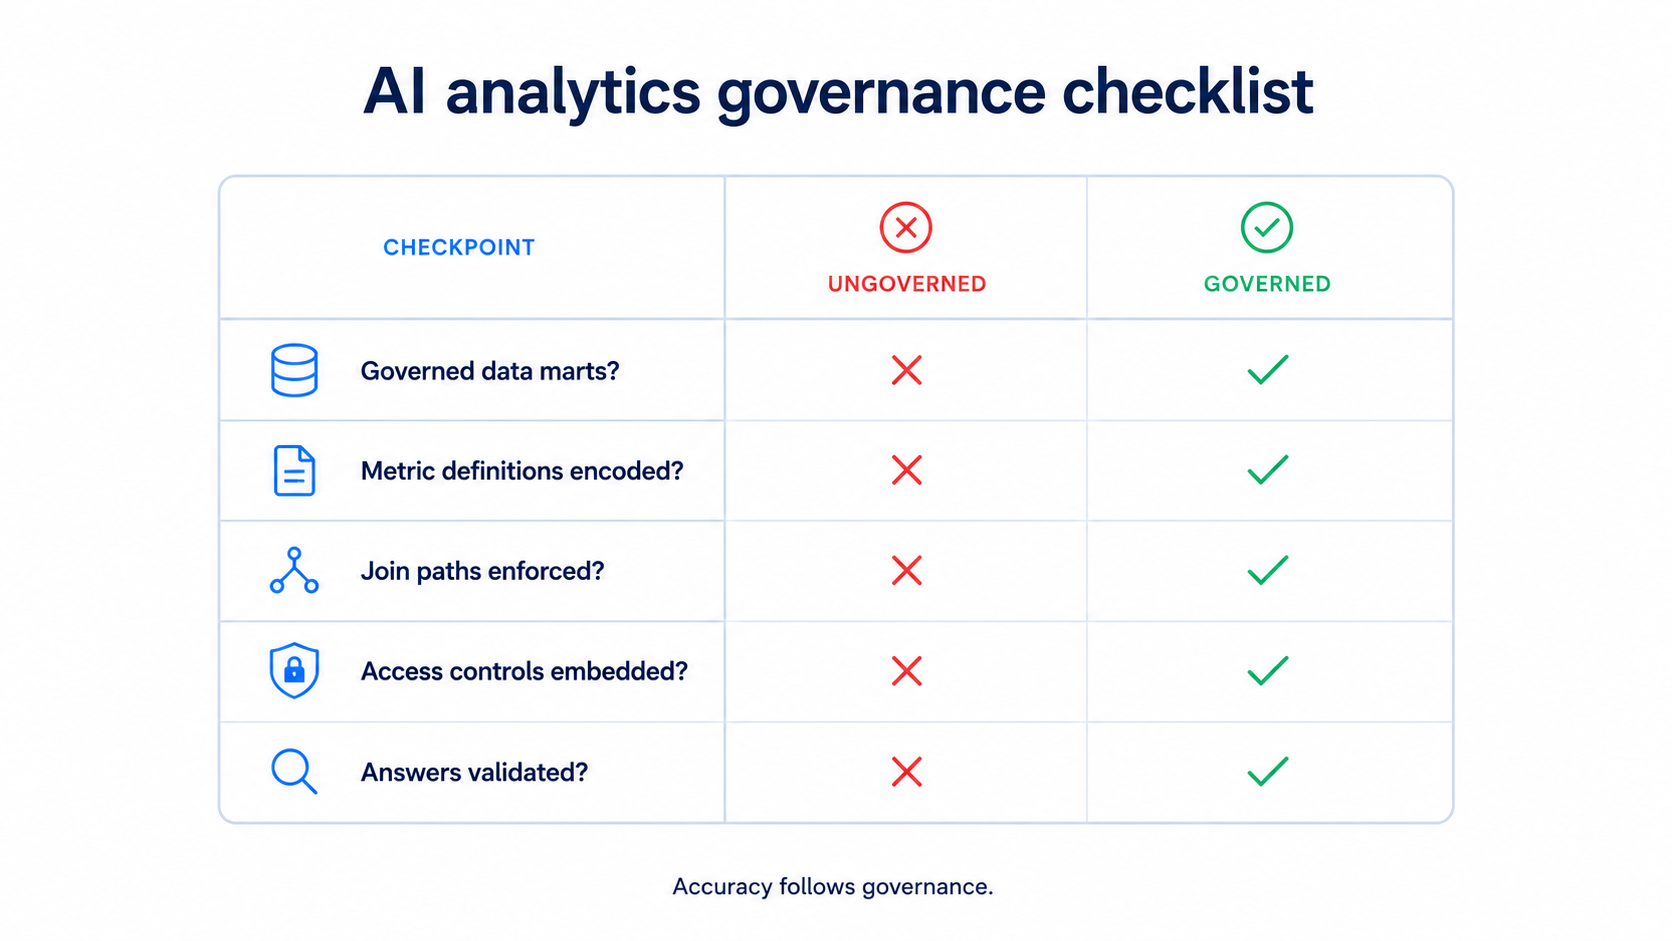
Before you connect any AI tool to your data, run through these questions. They separate organizations that will get value from vibe analytics from those that will get hallucinations.
Five questions to ask before connecting AI to your warehouse
1. Does the AI query governed data marts or raw tables?
If the answer is raw tables, every answer is a guess. Governed data marts with defined metrics and enforced joins are the minimum viable architecture for AI analytics.
2. Are metric definitions encoded in the schema?
If "revenue" means different things to different teams, the AI will pick whichever definition its training data suggests – which is probably none of yours. Metric governance must be structural, not documented in a wiki nobody reads.
3. Are join paths enforced or AI-guessed?
The difference between 10% and 90% accuracy. If the AI decides how tables connect, you have a hallucination machine. If the data mart defines those connections, you have a reliable tool.
4. Who has access to what data?
AI tools bypass traditional access controls by default. A marketing intern asking an AI to pull data might inadvertently access executive compensation tables or restricted PII. Access governance must be embedded in the data layer, not assumed.
5. How do you validate AI-generated answers?
Speed without accuracy is noise. Every AI analytics deployment needs a validation mechanism – whether that is deterministic SQL comparison, data quality frameworks, or human spot-checks on a defined cadence.
Measuring what matters – accuracy over speed
The vibe analytics pitch is speed. And speed matters. But 52% of organizations cite data quality as the primary barrier to AI adoption, and 30% of AI projects will be abandoned due to governance gaps.
The right metric for AI analytics is not "how fast did I get an answer?" It is "how often is the answer correct?" Gartner predicts that by 2026, 50% of large enterprises will have formal AI risk management programs, up from less than 10% in 2023. The organizations that build governance first will be the ones still using AI analytics in two years. The ones that skipped governance will be the ones cleaning up the mess.
The bottom line
Vibe analytics is not the problem. Ungoverned vibe analytics is the problem. The technology is genuinely powerful – natural language to instant insights is a paradigm shift in how organizations access data. But connecting AI to a raw warehouse with 500 tables and hoping for the best is not analytics. It is expensive guessing.
The fix is structural. Governed data marts with clean schemas, defined metrics, enforced joins, and access controls give AI the context it needs to generate correct queries. The accuracy data proves it: 10–51% without governance, 90–100% with it.
If your organization is exploring vibe analytics – and it should be – start with the data layer. Build the governed data marts first. Then let the AI loose. The vibes will be much better when the numbers are actually right.
Frequently asked questions


"AI by its nature will hallucinate. You need guardrails so you can trust your data."
"We had six or seven different channels and no single source of truth. It was almost impossible"
"We regained time. And time is the one resource that never comes back."