GOOGLEFINANCE function in Google Sheets: syntax, attributes list and examples
GOOGLEFINANCE pulls current and historical prices of stocks and currency pairs into Google Sheets. This guide covers the syntax, the complete list of attributes, historical data, exchange rates, candlestick and sparkline charts, the limits Google documents, and the reasons the function returns #N/A.

The GOOGLEFINANCE function returns current or historical market data for a stock or a currency pair. The shortest form needs only a ticker:
=GOOGLEFINANCE("NASDAQ:GOOG")
It returns the current price, which can be delayed by up to 20 minutes. Add an attribute to ask for something else, and dates to get history:
| You need | Formula |
|---|---|
| Current price | =GOOGLEFINANCE("NASDAQ:AAPL", "price") |
| Another current value, for example the 52-week high | =GOOGLEFINANCE("NASDAQ:AAPL", "high52") |
| Closing prices for a period | =GOOGLEFINANCE("NASDAQ:AAPL", "close", DATE(2024,5,20), DATE(2024,5,31)) |
| The closing price on one day, as a single value | =INDEX(GOOGLEFINANCE("NASDAQ:AAPL", "close", DATE(2024,5,20)), 2, 2) |
| An exchange rate | =GOOGLEFINANCE("CURRENCY:USDEUR") |
GOOGLEFINANCE syntax
=GOOGLEFINANCE(ticker, [attribute], [start_date], [end_date|num_days], [interval])
- ticker: the symbol of the security, in quotes. Google asks for the exchange and the ticker together, “NASDAQ:GOOG” rather than “GOOG”. Without the exchange, the function picks one itself. This is the only required argument.
- attribute (optional): which value to return, in quotes. The default is “price”. The attribute is required as soon as you pass a date.
- start_date (optional): the first day of historical data. With a start date and no end date, the function returns that single day.
- end_date|num_days (optional): the last day of historical data, or a number of days counted from the start date.
- interval (optional): how often to return a row of history: “DAILY” or “WEEKLY”. The numbers 1 and 7 mean the same; any other number returns #N/A.
Two things in this syntax decide what you get back:
- No dates: the request is real-time and the result is one value in one cell.
- Any date: the request is historical and the result is a table with a header row (Date and the attribute), even for a single day. Use the historical attributes; “price” is also accepted and returns the closing price, while the other real-time attributes, such as “pe” or “marketcap”, return #N/A with a date.
Write dates with the DATE function, for example DATE(2024,5,20), or with TODAY, for example TODAY()-30.
GOOGLEFINANCE attributes list
Real-time attributes
| Attribute | Returns |
|---|---|
| “price” | Price quote, delayed by up to 20 minutes |
| “priceopen” | Price at market open |
| “high” | Current day’s high price |
| “low” | Current day’s low price |
| “volume” | Current day’s trading volume |
| “marketcap” | Market capitalization |
| “tradetime” | Time of the last trade |
| “datadelay” | How far the real-time data is delayed |
| “volumeavg” | Average daily trading volume |
| “pe” | Price/earnings ratio |
| “eps” | Earnings per share |
| “high52” | 52-week high price |
| “low52” | 52-week low price |
| “change” | Price change since the previous trading day’s close |
| “changepct” | Percentage change since the previous trading day’s close |
| “beta” | Beta value |
| “closeyest” | Previous day’s closing price |
| “shares” | Number of outstanding shares |
| “currency” | Currency in which the security is priced |
Historical attributes
| Attribute | Returns |
|---|---|
| “open” | Opening price for the date or dates |
| “close” | Closing price for the date or dates |
| “high” | High price for the date or dates |
| “low” | Low price for the date or dates |
| “volume” | Volume for the date or dates |
| “all” | All of the above, one column each |
Mutual fund attributes are not supported
Older lists of GOOGLEFINANCE attributes include a third group for mutual funds: returnytd, netassets, yieldpct, morningstarrating, expenseratio and others. Google’s documentation now states that mutual fund attributes are not supported in Google Sheets (checked in October 2026), so do not build a sheet on them. It also notes that some attributes do not return a result for every symbol.
OWOX Data Marts
See your first report built in real time. 15 minutes.
- Connect your data warehouse
- Pick your metrics
- Get a live Google Sheets report
In the time it takes to write a ticket. Then imagine never writing that ticket again.
Book a DemoWe'll use your actual use case
Get current stock data
To get several values for one company, keep the attribute names in a column and pass the cell as the second argument:
=GOOGLEFINANCE("AAPL", C3)
- “AAPL”: the ticker of Apple Inc.
- C3: the cell that holds the attribute name, here price.
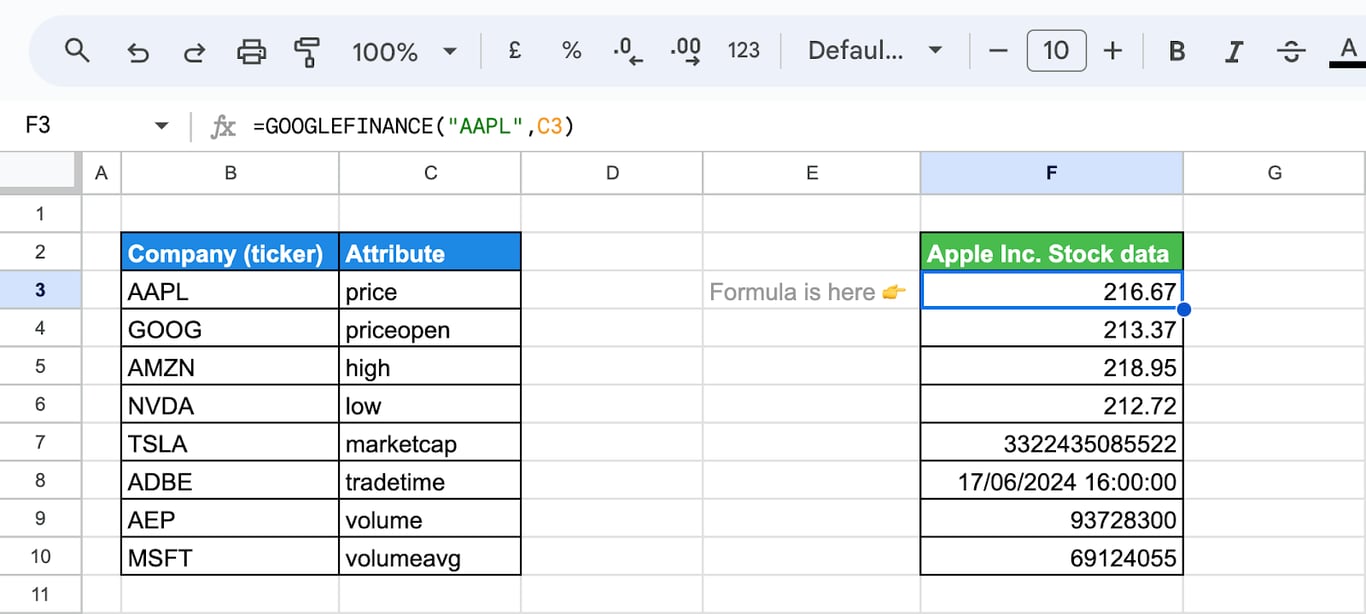
Copied down, the formula returns the price, the opening price, the day’s high and low, the market capitalization, the time of the last trade, the volume and the average volume. The same works in the other direction: tickers in a column, one attribute in the formula, =GOOGLEFINANCE(B3, "price").
One formula takes one ticker. A list such as “AAPL, GOOG” in a single formula returns #N/A.
Get historical stock data
Add a historical attribute and a start date. The fourth argument is either an end date or a number of days:
=GOOGLEFINANCE(B3, "close", DATE(2024,5,20), 7)
- B3: the cell with the ticker, AAPL.
- “close”: the closing price.
- DATE(2024,5,20): the first day, May 20, 2024.
- 7: the number of days to cover, counted from the start date.
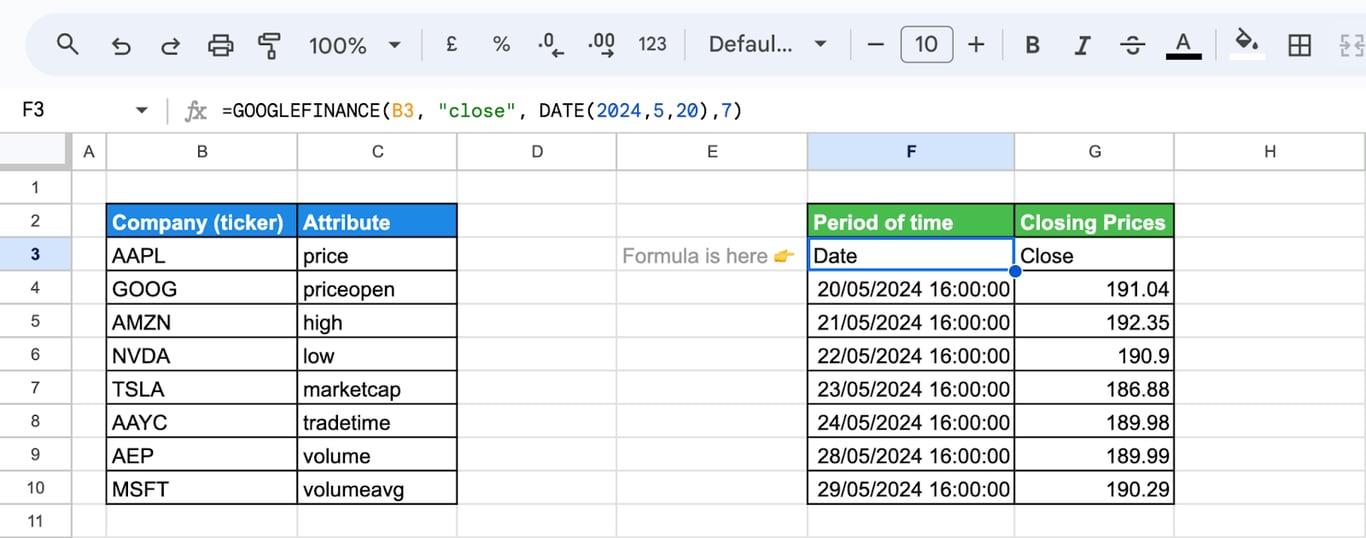
The result is a table with two columns, Date and Close, and one row per trading day. Weekends and market holidays have no row: May 27, 2024 was Memorial Day, and the list goes from May 24 straight to May 28.
For one row per week instead of one per day, add the interval: =GOOGLEFINANCE("AAPL", "close", DATE(2024,5,1), DATE(2024,5,31), "WEEKLY") returns the closing prices of the four Fridays from May 3 to May 24.
To put one historical price into one cell, take the value out of the table with INDEX: =INDEX(GOOGLEFINANCE("AAPL", "close", DATE(2024,5,20)), 2, 2) returns 191.04, the second row and second column of the result.
Build a candlestick chart
A candlestick chart shows four prices for each period: open, close, high and low. The body of the candle spans the open and the close, and the thin lines above and below it reach to the high and the low.
Step 1: get the data
The “all” attribute returns everything the chart needs:
=GOOGLEFINANCE("AAPL", "all", TODAY()-10, TODAY())
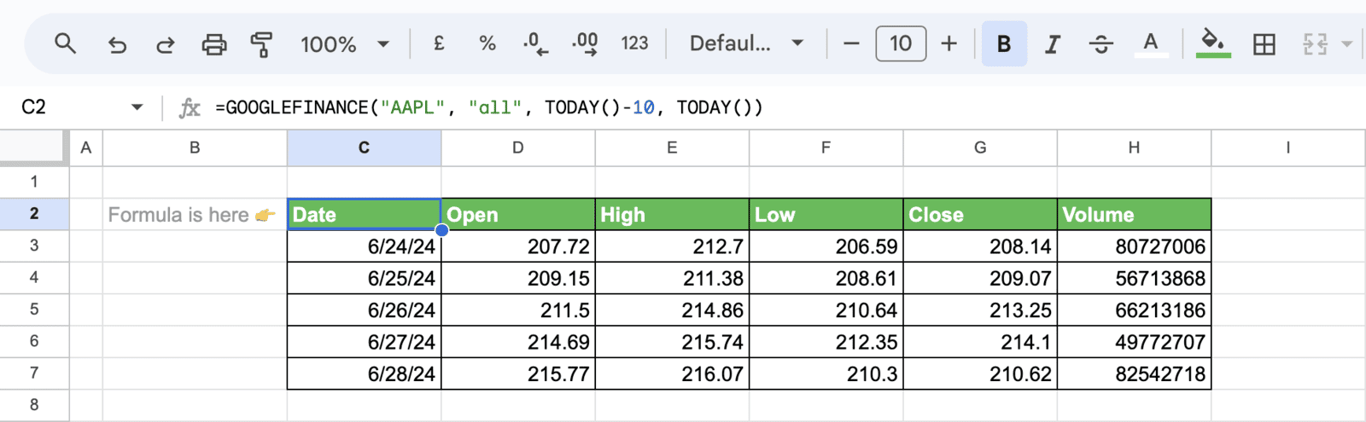
The formula returns the Date, Open, High, Low, Close and Volume columns for the trading days of the last 10 days.
Step 2: add a text date
The chart needs the dates as labels. Add a column next to the data and convert each date to text with the TEXT function:
=TEXT(C3, "MMM DD YYYY")
Copy the formula down for all rows.
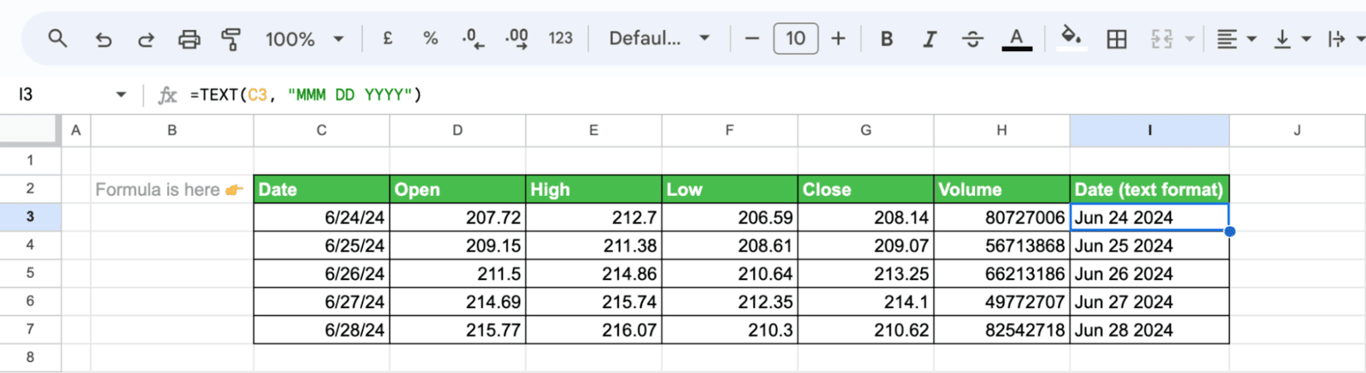
Step 3: insert the chart
Select the data and choose Insert > Chart. In the chart editor, open the Setup tab and pick Candlestick chart as the chart type. The data range has to include the text date and the Open, High, Low and Close columns: the text date is the X-axis, the four prices are the series.
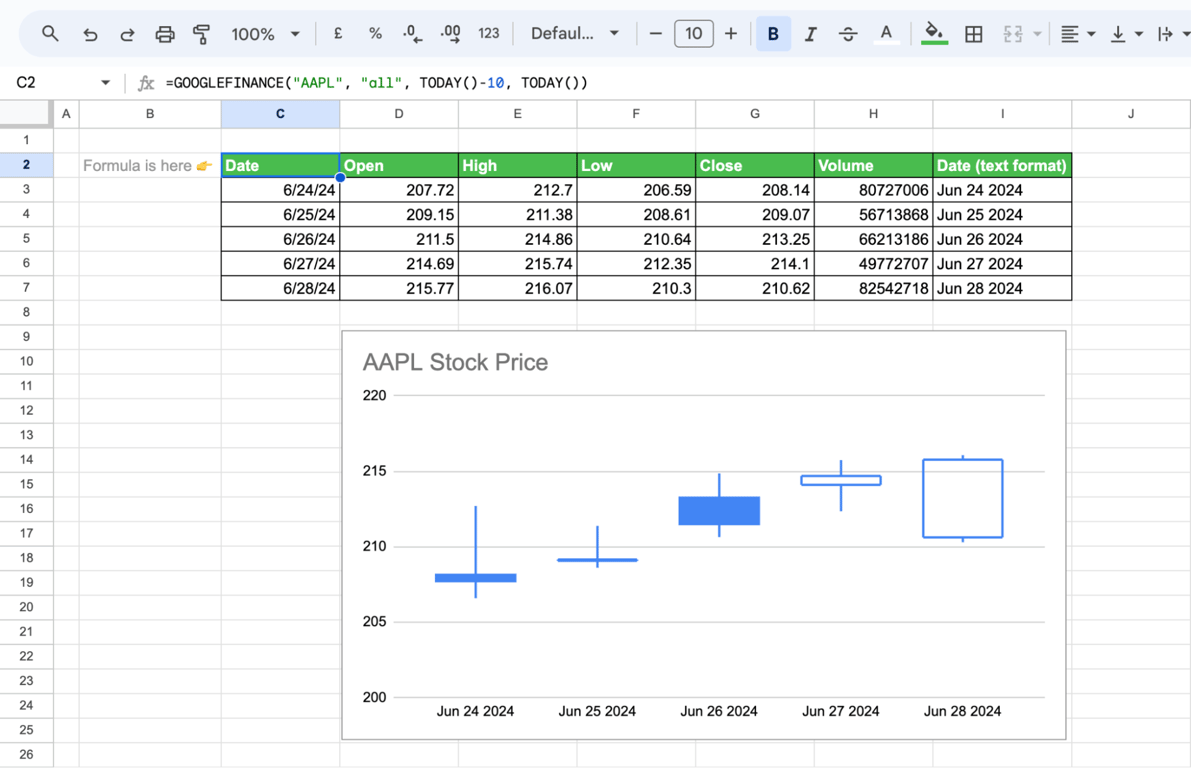
If the candles look flat, open Customize > Vertical axis and set the minimum and maximum close to the lowest and highest prices in the data. More chart types are covered in the guide to charts in Google Sheets.
Get currency exchange rates
For currencies the ticker is the word CURRENCY, a colon and two three-letter currency codes with nothing between them: the currency you convert from, then the currency you convert to.
=GOOGLEFINANCE("CURRENCY:USDEUR")
With the codes in cells, join the parts with ampersands:
=GOOGLEFINANCE("CURRENCY:" & B3 & C3)
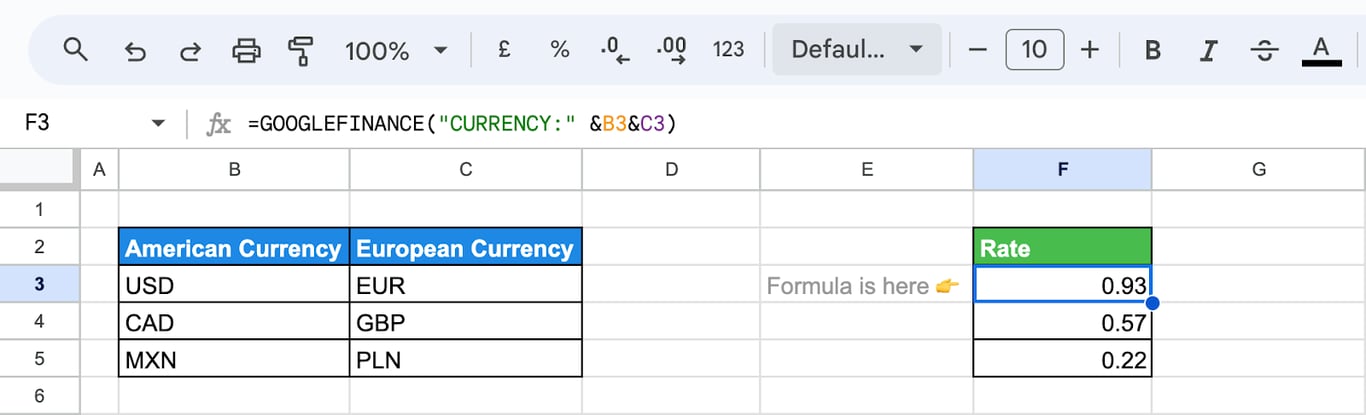
Currencies have no trading day, so the open, high, low and volume attributes return #N/A for a currency pair.
Convert an amount
Multiply the amount by the rate:
=GOOGLEFINANCE("CURRENCY:" & B2 & E2) * B3
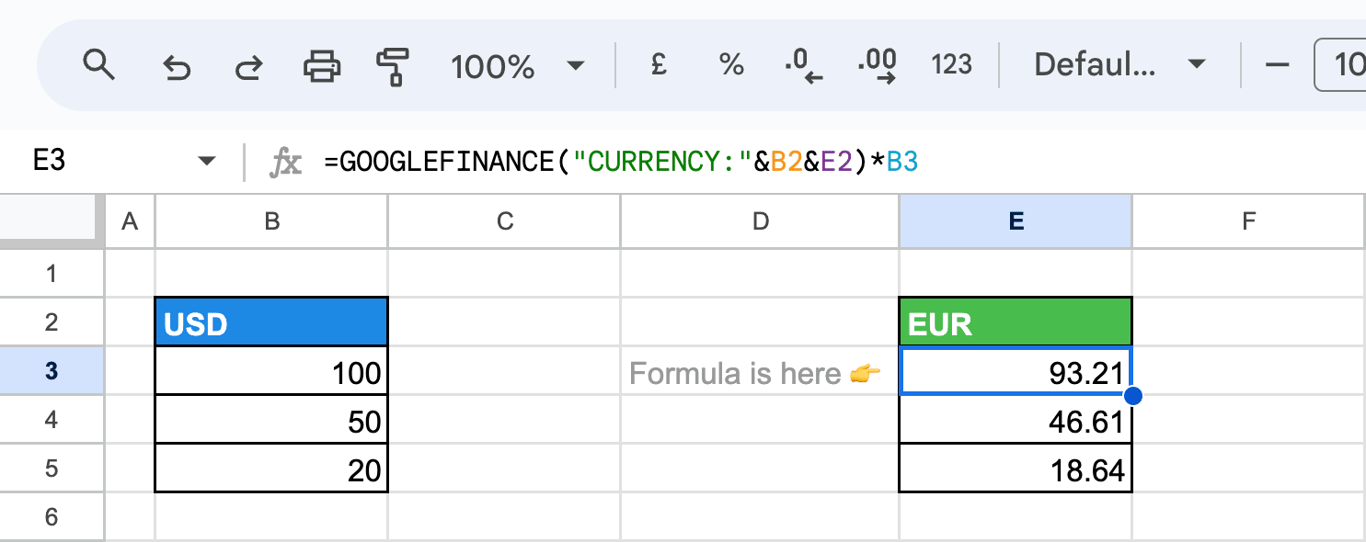
B2 and E2 hold the currency codes, USD and EUR, and B3 holds the amount. The full list of currency codes and more conversion patterns are in the guide to currency conversion with GOOGLEFINANCE.
Get historical exchange rates
Historical rates follow the same rules as historical prices: an attribute, a start date and an end date.
=GOOGLEFINANCE("CURRENCY:" & B3 & C3, "price", DATE(2024,5,25), DATE(2024,5,31))
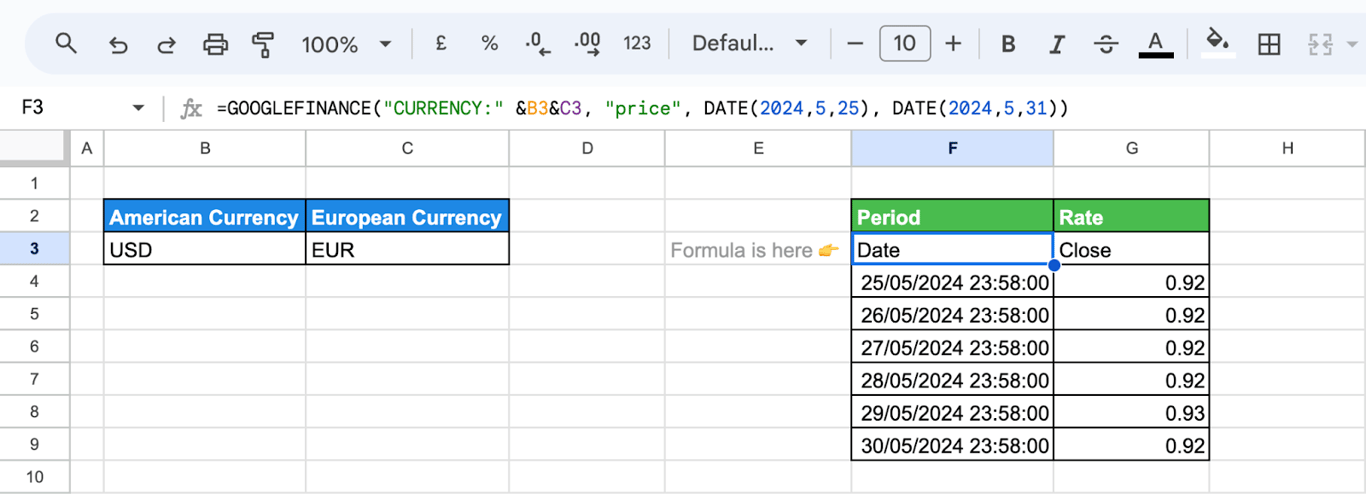
The function returns the USD to EUR rate for each day of the last week of May 2024.
Show a price trend in one cell with SPARKLINE
Show a price trend in one cell with SPARKLINE
SPARKLINE draws a small chart inside a cell, and it accepts the table that GOOGLEFINANCE returns:
=SPARKLINE(GOOGLEFINANCE(B3, "price", TODAY()-30, TODAY()), {"charttype", "line"; "color", "blue"; "linewidth", 2})
- GOOGLEFINANCE(B3, “price”, TODAY()-30, TODAY()): the prices of the ticker in B3 for the last 30 days.
- {“charttype”, “line”; “color”, “blue”; “linewidth”, 2}: the chart options: a blue line, 2 pixels wide.
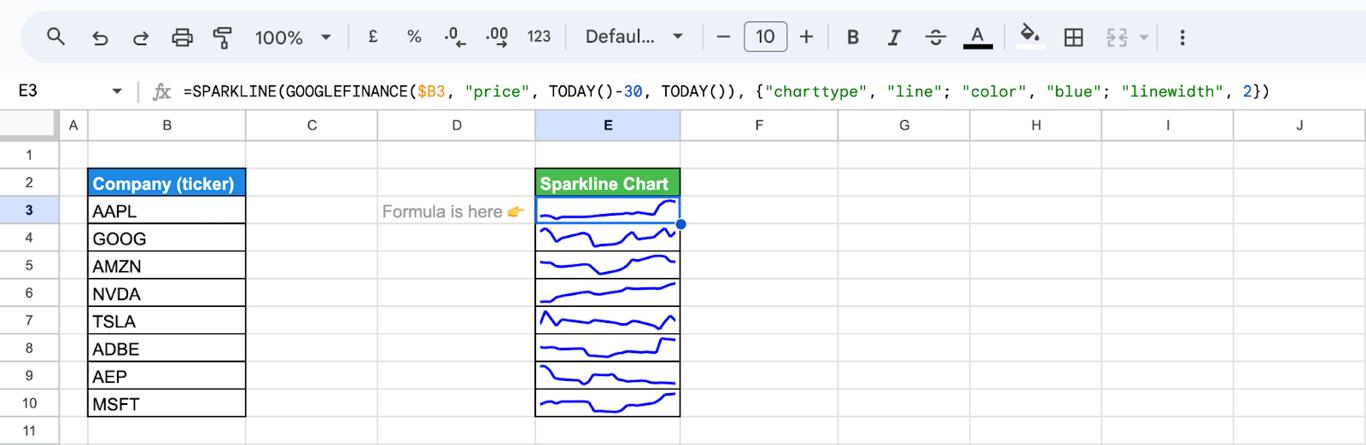
Copied down next to a list of tickers, the formula gives a 30-day trend line for each of them.
Limits of GOOGLEFINANCE
Google’s documentation lists several limits that are worth knowing before you build a report on the function (checked in October 2026):
- Quotes can be delayed by up to 20 minutes and are not sourced from all markets. The “datadelay” attribute shows the delay for a ticker.
- Most international exchanges are not supported.
- Not for professional use. The data is provided for information, not for trading, and professional use may require a licence from the data provider.
- Historical data stays in the sheet. It cannot be read through the Sheets API or Apps Script: the cells return #N/A there.
- Dates are treated as noon UTC. For exchanges that close before that time, the result can be shifted by a day.
GOOGLEFINANCE errors
#N/A error
⚠️ Error: The function returns #N/A. This is its answer to almost every problem, so hover over the cell and read the message.
✅ Solution: Check these causes in turn:
- The ticker is not recognized. Add the exchange, “NASDAQ:AAPL”, and check the symbol on Google Finance.
- The attribute is misspelled or not available for this symbol. Compare it with the list above.
- A real-time attribute is used with dates. With a date in the formula, attributes such as pe, marketcap or high52 return #N/A. Use open, close, high, low, volume or all.
- The date is not a trading day. A single date that falls on a weekend or a market holiday returns #N/A. Use a range of dates instead.
- The interval is a number other than 1 or 7.
- Several tickers are passed in one string. Use one formula per ticker.
To show something more useful than the error, wrap the formula: =IFERROR(GOOGLEFINANCE(B3, "price"), "no data").
#REF! error
⚠️ Error: A historical formula returns #REF! with the message that the array result was not expanded.
✅ Solution: Historical data is a table and needs empty cells below and to the right of the formula. Clear those cells or move the formula.
A date and a header where one number was expected
⚠️ Error: A formula with a single date fills four cells: Date, Close and a row of values.
✅ Solution: That is how historical requests work. Take the one value with INDEX: =INDEX(GOOGLEFINANCE("AAPL", "close", DATE(2024,5,20)), 2, 2).
#ERROR! (formula parse error)
⚠️ Error: The formula is not accepted at all.
✅ Solution: Check that the ticker and the attribute are in straight double quotes, that the parentheses are paired, and that the arguments are separated the way your spreadsheet locale expects: a comma in most English locales, a semicolon in many European ones.
Related Google Sheets functions
Related Google Sheets functions
Functions that are often used next to GOOGLEFINANCE, each with its own guide:
- Currency conversion with GOOGLEFINANCE: Currency codes, conversion formulas and historical rates in detail.
- SPARKLINE: Draws a chart inside a single cell.
- IMPORTXML: Imports data from a web page with an XPath query, for figures GOOGLEFINANCE does not provide.
- ARRAYFORMULA: Applies a formula to an entire range of data.
- QUERY: Filters, sorts and summarizes a table with SQL-like syntax, for example the table of historical prices.
- AVERAGE: Calculates the arithmetic mean of a range, for example the average closing price of a period.
- IF: Returns one result when a condition is true and another when it is false.
GOOGLEFINANCE brings the rate, your own numbers come from elsewhere
GOOGLEFINANCE brings the rate, your own numbers come from elsewhere
GOOGLEFINANCE covers one kind of data: public market prices and exchange rates. The figures you multiply by those rates are a different matter. Revenue by country, ad spend in three currencies or invoices from a billing system sit in a data warehouse, and they usually reach the sheet as an export that someone has to repeat every week.
The OWOX Data Marts extension for Google Sheets covers that half. A data analyst publishes a data mart (a table or an SQL query in your data warehouse) and makes it available for reports. In Sheets you open the extension, pick the data mart, tick the columns you want and run it. The rows land in a tab, ready for your formulas.
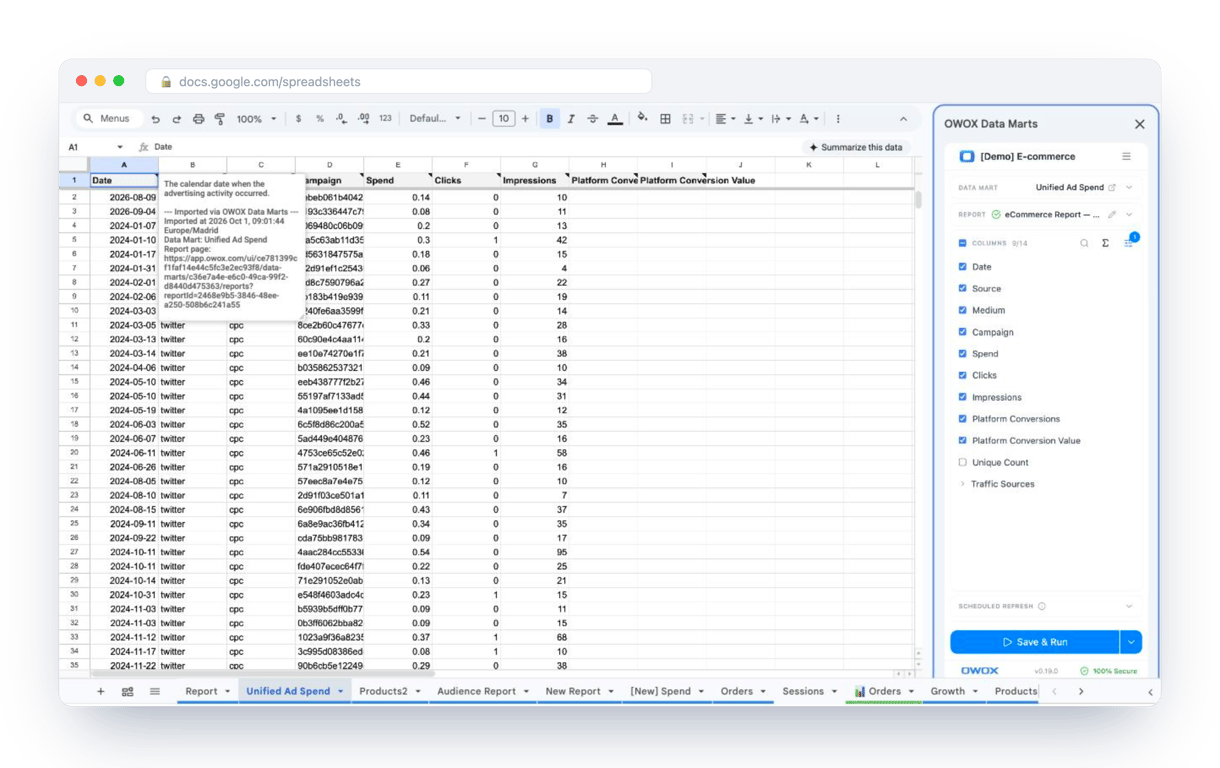
What changes for the person who maintains the sheet:
- Refresh replaces re-export. Refresh current report in the extension menu re-runs the same pull, and a scheduled refresh keeps the tab current without anyone touching it.
- The source is written on the sheet. The header cell of an imported tab carries a note with the data mart it came from, the time of the import and a link to the report.
- No SQL and no warehouse access needed. The analyst decides which data marts and columns are available. You choose from that list.
The extension does not write or change the analyst’s SQL. GOOGLEFINANCE stays in the sheet for the rates, and the amounts next to it come from the same data mart on every refresh. The extension comes with the OWOX Cloud plans of OWOX Data Marts; spreadsheet reporting describes both ways data reaches a sheet.
Turn your data into decisions.
Governed data marts give you the clean foundation ML needs to actually work.
- No AI hallucinations
- Analyst-governed definitions
- Every number traces to SQL
Frequently Asked Questions
What are some common issues I might face while using the GOOGLEFINANCE function, and how can I solve them?
Almost every problem shows up as #N/A: a ticker that is not recognized, a misspelled attribute, a real-time attribute such as pe used together with dates, a single date that is not a trading day, or an interval other than DAILY or WEEKLY. Historical formulas return a table and show #REF! when the cells below them are not empty.
How can I import and analyze historical currency exchange rates?
To import and analyze historical currency exchange rates, use the GOOGLEFINANCE function with appropriate parameters. For example, =GOOGLEFINANCE("CURRENCY:USDEUR", "close", DATE(2022,1,1), DATE(2022,12,31)) fetches the USD to EUR exchange rates for the year 2022.
Can I obtain historical stock data with the GOOGLEFINANCE function? How?
Yes. Add a historical attribute, a start date and an end date: =GOOGLEFINANCE("NASDAQ:AAPL", "close", DATE(2022,1,1), DATE(2022,12,31)) returns a table with the date and the closing price for each trading day of 2022. Add "WEEKLY" as the fifth argument for one row per week.
Is it possible to track currency exchange rates using GOOGLEFINANCE?
Yes. Use the word CURRENCY, a colon and the two currency codes written together: =GOOGLEFINANCE("CURRENCY:USDGBP") returns the current USD to GBP rate. Add "price", a start date and an end date to get the rate for each day of a period.
How do I start using the GOOGLEFINANCE function to track my favorite stocks?
To start using the GOOGLEFINANCE function, open Google Sheets and select a cell where you want the data to appear. Then, type =GOOGLEFINANCE followed by the parameters you want to specify, such as the stock symbol or attribute.
What exactly does the GOOGLEFINANCE function do in google sheets?
The GOOGLEFINANCE function in Google Sheets retrieves current or historical financial market data. It can fetch information such as stock prices, trading volumes, market capitalization, and more.