What is Marketing Attribution Model for Marketer: The Definitive Guide
![]() Get in-depth insights
Get in-depth insights
![]() Get in-depth insights
Get in-depth insights
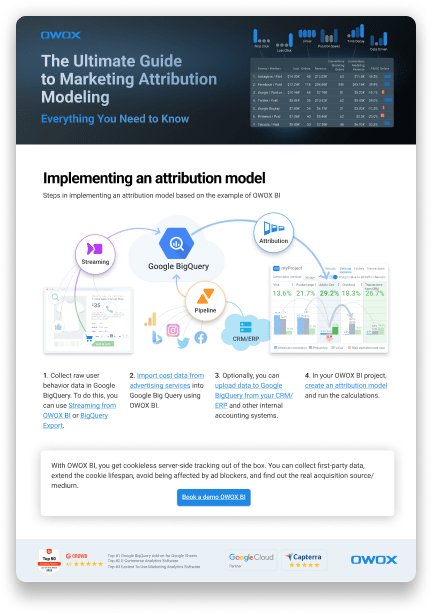
The Ultimate Guide to Marketing Attribution Modeling: Everything You Need to Know
In a perfect world, people just come to your website and buy all things at once.
Unfortunately, in reality, it doesn’t work that way. Usually, there are several visits to your website before converting. As these visits come from different advertising channels, marketers need to know which channel works best for the company and which is less effective. That’s the point where attribution modeling takes place.
In this article, we describe the basic principles, pros, and cons of the most well-known attribution models, from standard models in Google Analytics 4 to Markov chains and the Shapley value. We explain what is attribution modeling, how to evaluate the combined influence of campaigns and channels (not just the Last Click model), and how to choose the model that best suits your business.
To follow along you would need to be aware of the basics of attribution. If you are looking for a source to brush up on your knowledge, do check our article, What is marketing attribution?
Note: This article was originally published in 2019 but was updated to be truly a comprehensive guide in December 2023.
Also, we've added an emerging point for marketers here: How to evaluate the cost efficiency of the marketing attribution model.
What are the different types of attribution models?
There are dozens of possible attribution models and various types of attribution models. They can be classified in different ways depending on the logic used in their calculations.
If we look at what place a channel occupied in the customer journey before the order, then we’re using an attribution model based on position (Time Decay, Position-Based).
If the calculation takes into account all data and not only the position of the channel in the chain, then it’s an algorithmic attribution model (Machine Learning Funnel-based, Markov chains, or Data-driven).
If we give all the value to only one channel that participated in the funnel, then it’s a single-channel model (Last Click, First Click, or Last non-direct Click).
If the value is distributed among all channels in the chain, then it’s a multi-channel attribution model (Linear, Time Decay)
Despite its obvious limitations, 21% of marketers still use only single-channel models for attribution and only 11% of marketers are taking advantage of algorithmic attribution today (2023-24).
Why so?
There are 3 important reasons that lead to the numbers above:
Lack of understanding of attribution impact
Lack of trust in the data used for attribution modeling
No ownership of attribution analytics within an organization

What are the common marketing attribution models?
Let’s start with the simplest marketing attribution models, based on position, which are available in the free version of Google Analytics.
1. First Interaction or First Click marketing attribution model
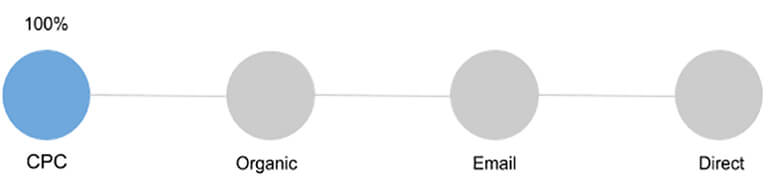
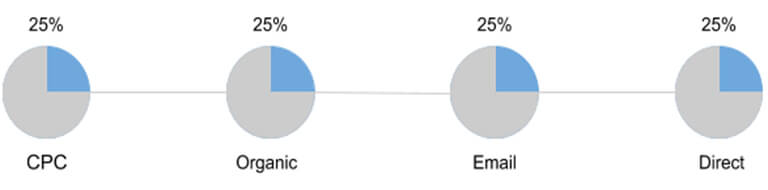
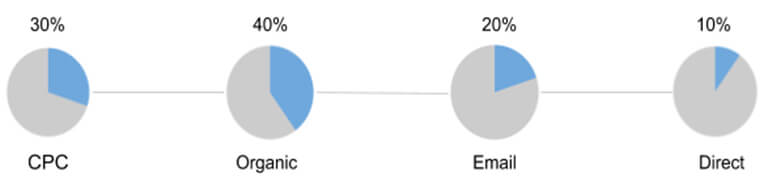
With these models, all the value received from a conversion is attributed to the first source that led the user down the funnel. For example, if we have a chain of four contacts, as shown below, according to the First Click model, the entire value of the conversion will be attributed to the CPC channel.
Pros: Easy to set up and use, as there are no calculations or arguments regarding the distribution of value between channels.
Cons: Doesn’t show the whole picture and overestimates channels at the top; users typically interact with several touchpoints before a purchase, which the First Interaction model completely ignores. With the first touch attribution, you would get a narrow understanding of the customer journey. You also, won’t be able to evaluate the effectiveness of warm or retargeting ads.
Suitable for businesses that want to increase brand awareness and audience reach as well as understand where to buy traffic that will convert. Useful for marketers who focus exclusively on demand generation and brand awareness. The first touch model is also suitable for businesses with short sales cycles.
Here is another example for more clarity: if a customer finds your business through a search ad, completes a subscription form on your site, receives an email, and is then retargeted with an ad on Facebook before actually converting, the search ad will receive 100% credit for this conversion.
Once again, the First Click marketing attribution model is really helpful if your business tends to convert customers immediately. In this case, the first touchpoint is especially important.
2. Last Interaction or Last Click marketing attribution model
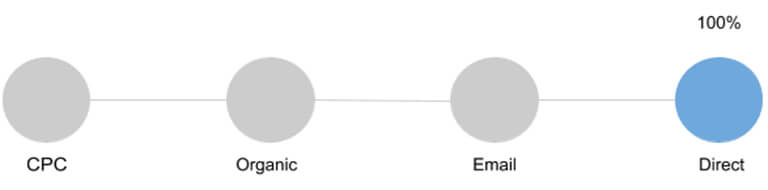
According to this model, the entire value of the conversion goes to the last channel that the user came in contact with before the conversion. The contribution of all other channels is ignored. In our example, all the value will go to the Direct channel.
Pros: A popular model that’s familiar to many marketers; ideal for evaluating campaigns for quick purchases, such as for seasonal items. It also directly shows what was the final touchpoint that led to a conversion.
Cons: Like all single-channel models, it ignores the role of other sources in the chain before ordering, especially if the sales cycle is long.
Suitable for businesses with a short sales cycle that uses up to three advertising channels.
With last-touch attribution, you will gain an understanding of the types of messages and channels that nudge leads over the finish line. These insights can then be used to build more effective retargeting campaigns and for the final stages of your nurture campaigns.

3. Last Non-Direct Click marketing attribution model
The entire conversion value is assigned to the last channel in the chain. However, if that last channel is Direct, then the value is attributed to the previous channel.
The logic is simple: if the user came to you from a bookmark or entered a URL, then they most likely were already familiar with your brand.
Pros: Allows you to ignore channels that are insignificant in terms of advertising costs and focus on paid sources. In addition, Last Non-Direct Click can be used for comparing with other attribution models.
Cons: Doesn’t take into account the contribution of other channels in the user journey.
In addition, often the penultimate source in the chain is email. We understand that the customer came from somewhere and left their email address, but by using Last Non-Direct Click, you underestimate the sources that helped the customer get acquainted with the brand, leave their email, and eventually decide to buy.
Suitable for businesses that want to evaluate the effectiveness of a particular paid channel and for whom brand recognition is no longer so important.
Earlier Google Analytics Universal reports used this model by default.
But nowadays, it depends the most among all models on the quality of measurement and user behavior data collection. Because privacy regulations and cookie restrictions lead to inaccurate acquisition campaign tracking.

As explained earlier, the above 3 attribution models are also called single-channel attribution models.
These models can only evaluate one channel. They oversimplify the omnichannel customer path to purchase, leading to serious misconceptions and certainly not showing the actual situation.
On average, it takes from seven to nine touchpoints (the best performers can reduce this to five) for a customer to convert. Obviously, each of these touchpoints (channels) affects the probability of conversion. It’s only logical that it’s necessary to take into account the influence of all channels on the buyer in this case.
So let’s proceed to understand the multi-channel marketing attribution models.
4. Linear attribution model
Amongst the multi-channel attribution models, the linear model is definitely the most naive. This basic model simply divides the transaction value equally among all sources in the chain.
Pros: Simple, but at the same time more advanced than single-channel attribution models, as it takes into account all sessions before conversion. The linear or equal model is also the most straightforward way to explain the ROI of each marketing channel to your stakeholders.
Cons: May under or overestimate the influence of a marketing channel. That is why, this model is useless if you need to reallocate the budget; to divide it equally between channels is not the best option, since they can’t be equally effective.
Suitable for businesses such as B2B companies with a long sales cycle, for which it’s important to maintain contact with the client at all stages of the funnel.
5. Time Decay attribution model for marketing (and other models that take time into account)
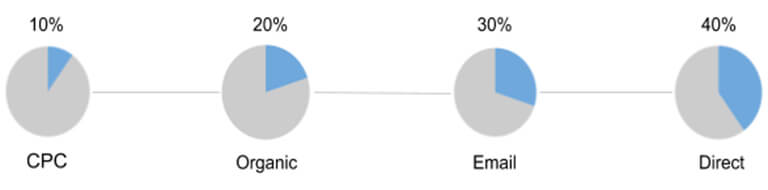
With the Time Decay model, the value of a transaction is distributed between channels incrementally. That is, the first source in the chain receives the least value, and the source that was the last and closest in time to the conversion receives the most value.
Pros:All channels in the chain get their piece of the cake. Works well for clients with businesses heavily dependent on relationship-building. Useful for optimizing your most influential touchpoints right before conversion, at the end of the day, clients & revenue always matter the most.
Cons: The contribution of sources that led the user to the funnel is greatly underestimated. Not as effective for businesses with shorter sales cycles
Suitable for those who want to evaluate the effectiveness of promotional campaigns that are limited in time. The time decay attribution model will work well if you have expensive product offerings and longer sales cycles.
This model is often used by marketers who want to emphasize the impact of touchpoints in the latter stages of the customer journey. It provides insights into the effectiveness of marketing channels and touchpoints as the customer moves closer to making a purchase or conversion decision, helping marketers optimize their strategies accordingly.
6. Position-based or U-shaped marketing attribution model
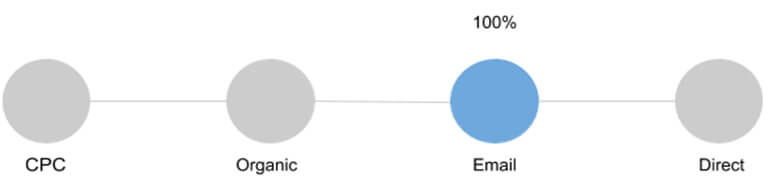
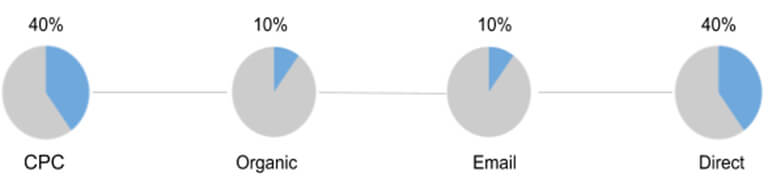
With these models, most credit is given to two sources (40% each): the one that introduced the user to the brand and the one that closed the deal. The remaining 20% is divided equally among all channels in the middle of the funnel.
Pros: Gives the greatest value to the channels that in most cases play the most important role: those that attract the customer and motivate the conversion.
Cons: Sometimes the sessions in the middle of the chain encourage the user through the funnel much more than it seems at first glance. For example, they help the customer add a product to the cart, subscribe to the newsletter, or click Follow the price. With the Position-Based model, such sessions and their sources are underestimated.
Suitable for businesses for whom it’s equally important to attract a new audience and convert existing visitors into buyers.
Important! The first click, linear, time decay, and position-based attribution models are no longer available by default in Google Analytics 4 (starting July 2023). If you need these attribution models and don't want to give them up, you can continue to use them in OWOX BI. With OWOX BI you can get those simple models in a few clicks (as well as more advanced algorithmic models)
What’s the problem with standard marketing attribution models?
When choosing a model, many marketers prefer the one that looks easiest and is most understandable, even though it underestimates all sessions in the chain except for the last click.
In our opinion, there are three main reasons why marketers do this:
They don’t understand the potential of more complex attribution models. For example, if we told you that by switching to an algorithmic model you could increase revenue by 20%, would you switch? Probably yes.
There’s no single person who’s responsible for attribution, so different marketers use different models for the same campaign. As a result, the total attributed income may be more than the real income earned by the business.
Siloed and scattered data. Models that are available in Google Analytics 4 are certainly convenient: all the data is in one system, and you can use standard reports. However, these reports won’t tell you anything about offline data, the completion of your orders, or the ROPO effect.
By eliminating these holdups, it will be much easier to solve the problem of attribution.
Google Ads, Double Click, Facebook, and some other services also have their own attribution models. Their common disadvantage is that you can only use the internal data of the service for calculations.
Algorithmic attribution models
Imagine that you’re setting up ads on Google Ads or Facebook. Evaluating a campaign by the Last Non-direct Click will show you whether the campaign is working. And it will show you how the audience responds to it. Inside your advertising admin panel or Google Analytics 4, it doesn’t make sense to use complex attribution models.
But if you want to evaluate the influence of all your sources on each other, then you already need to combine data from different advertising services, Google Analytics 4, and your CRM into one system and use more complex attribution models. By doing so, you’ll learn which advertising channels work well together and at what stages.
Algorithmic attribution models include Data-Driven (default in Google Analytics 360 and GA4), Markov chains, Machine Learning Funnel Based Attribution by OWOX, and custom algorithms.
1. Data Attribution (Data-Driven Attribution)
Before the launch of Google Analytics 4 (GA4), Users of the paid version of Google Analytics 360 had access to a data-driven attribution model. With GA4, a data-driven attribution model is available to all users.
All attribution models described previously use rules that are set by a web analytics system or by you. In contrast, a Data-Driven attribution model does not have any predefined rules — it calculates the value of channels using your data and the Shapley vector.
The peculiarity of a model based on data is that it doesn’t take into account the order of a channel in the chain, but rather evaluates how the presence of this channel affected the conversion. If you change the order of sessions, the value of the channels in the Shapley model won’t change.
According to Wikipedia, the Shapley value (which belongs to cooperative game theory) is the optimal distribution of winnings between players. It’s a distribution in which the gain of each player is equal to their average contribution to the well-being of the group as a whole.
To understand how a Data-Driven model works, consider a specific example. Suppose we have two chains that lead to transactions:
- Facebook → Direct → $500 transaction
- Direct → $300 transaction
We’ve specifically used short chains in our example so as not to complicate an already complicated formula.
Now, we’ll determine how much each channel brought in separately and how much they brought in together:
V1 (Facebook + Direct) = $500
V2 (Direct) = $300
V3 (Facebook) = 0
The Shapley value of a channel is calculated using the following formula:
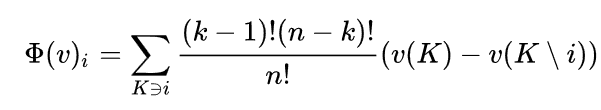
Where:
- n is the number of players (in our case, advertising channels)
- v is the value brought by the source
- k is the number of participants in the coalition K
If we insert the values from our example into this formula, we get the following:
F1 = (1 - 1)! × (2 - 1)! / 2! × (0 - 0) + (2 - 1)! × (2 - 2)! / 2! × ($500 - $300) = 0 + $100 = $100
F2 = (1 - 1)! × (2 - 1)! / 2! × (300 - 0) + (2 - 1)! × (2 - 2)! × ($500 - 0) = $150 + $250 = $400
F1 is the value of the Facebook channel.
F2 is the value of the Direct channel.
We’ll now explain this in simple words for those who got scared by the formula :) Let’s start with Facebook.
This channel hasn’t brought us anything on its own, so the first element we’ll have is 0.
Facebook, in combination with Direct, brought in $500, and Direct alone brought in $300.
We subtract the money earned by Direct from the amount that the combination of channels has brought in, then divide the result by two: ($500 - $300) / 2 = $100. This is our second element.
Now add $0 + $100 = $100. This is the value of the Facebook channel.
Next, consider the value of the Direct channel. Independently, it brought in $300. Divide that by two and you get $150. The Facebook + Direct combination brought in $500, which divided by two gives us $250. We add these numbers and get $400 as the value of the Direct channel.
DDA is suitable for anyone who wants to know which campaigns and keywords work as efficiently as possible and use this information to distribute the marketing budget. Not suitable for businesses that need to know not only the value but also the position of the channel in the chain.
Pros of Data-Driven Attribution
Data-Driven: like other algorithmic models, Google's model uses actual data to determine the contribution of each channel, providing evidence-based insights.
Machine Learning: Utilizes machine learning algorithms to assess the importance of different touchpoints in the conversion path, potentially uncovering insights that may be missed by simpler models.
Ease of Use: Integrated into Google's ecosystem (e.g., Google Ads, Google Analytics 4), making it relatively easy to implement for businesses already using these platforms.
Automatic: Once set up, the model updates automatically with new data, reducing the maintenance workload.
Cons of Data-Driven Attribution
Data Requirements: Requires a significant amount of data; Google recommends having at least 15,000 clicks and a conversion action with at least 600 conversions within 30 days.
Limited Customization: Less customizable compared to some other models as it's designed to work seamlessly within Google's ecosystem.
Black Box: The algorithms used are not fully transparent, which might be a concern for those wanting a deeper understanding or control over the model.
Lack of trust: when you can’t control the calculation algorithms, you can’t be certain about model results.
Platform Dependency: Tied to Google's platform, which might not be preferred by organizations wishing to maintain platform neutrality or those concerned with data privacy issues.
2. Markov chains
A Markov chain is a sequence of random events with a finite number of outcomes, characterized by the fact that with a fixed present, the future is independent of the past.
Initially, Markov chains were used by weathermen, bookmakers, and others to solve problems with forecasting. People began to use them to evaluate advertising campaigns relatively recently, with the development of the digital market. Attribution based on Markov chains helps answer the question of how the lack of a channel will affect conversions.
To understand how Markov chains work, consider a specific example from e-commerce. Suppose we have three chains:
C1 → C2 → C3 → Purchase
C1 → Unsuccessful conversion
C2 → C3 → Unsuccessful conversion
C1, C2, and C3 are sessions with three different sources – for example, Google CPC, Facebook, and email.
Fill in the following table:
| Customer path | Inside view of the model | Breakdown by pairs |
|---|---|---|
| C1 → C2 → C3 → Сonversion | Start → C1 → C2 → C3 → Сonversion | Start → C1,C1 → C2, C2→ C3,C3 → Сonversion |
| C1 | Start→C1 →(null) | Start → C1, C1 → (null) |
| C1 → C2 | Start → C2 → C3 → (null) | Start →C2, C2 → C3,C3 → (null) |
In the first column we have the customer path – three chains, in our example.
The second column shows how the path will look inside the model. We added the entrance to the funnel (the Start stage) and the exit from the funnel (Conversion or Null, meaning failed conversion).
In the third column, we divided the channels into pairs, since we need to evaluate all possible transitions from one step to the next.
Then we need to calculate the probabilities for each of the possible transition options and put them in a separate table. These figures are considered empirically; that is, real data about user actions is analyzed – for example, from Google Analytics. This is done using a programming language such as R or Python.
| Origin | Destination | Probability | Overall probability |
|---|---|---|---|
| Start | C1 | 1/3 | 66,7% |
| Start | C1 | 1/3 | |
| Start | C2 | 1/3 | 33,3% |
| All from Start | 3/3 | ||
| C1 | C2 | 1/2 | 50% |
| C1 | (null) | 1/2 | 50% |
| All from C1 | 2/2 | ||
| C2 | C3 | 1/2 | 100% |
| C2 | C3 | 1/2 | |
| All from C2 | 2/2 | ||
| C3 | Convercion | 1/2 | 50% |
| C3 | (null) | 1/2 | 50% |
| All from C3 | 2/2 | ||
The numbers in the table above are just examples. To make it clear what these numbers mean, let’s show them on a chart:
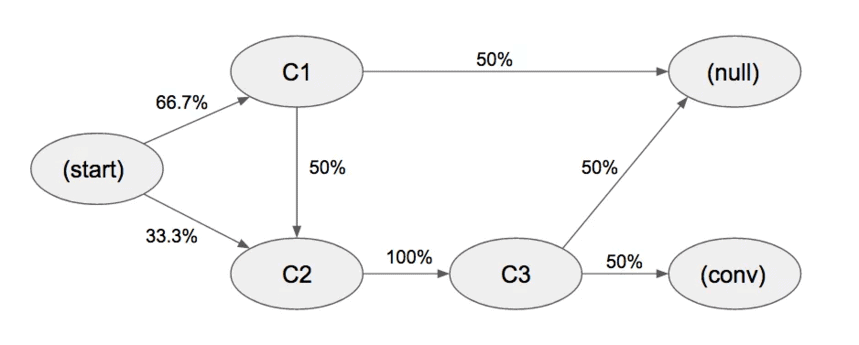
In this chart, we see all possible transition options from our example. Everything starts with the start phase. From there, a third of users go to channel C2 and two-thirds go to C1. Further, half of users from channel C1 leave the funnel, and the other half goes to C2, then to C3. Finally, 50% of the remaining users make a purchase. There are a few more options, but you understand the principle.
Note that in our example, there are essentially only two paths to conversion, and both of them go through channel C2.
How are such sessions evaluated? With the removal effect. That is, we delete each of the sources in turn and see how its absence would affect the number of conversions:
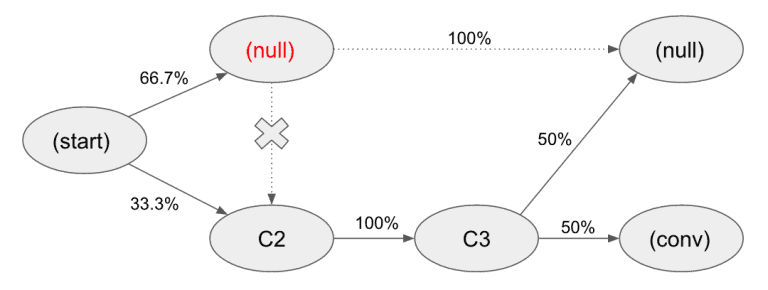
For example, if we remove the C1 source from our example, we lose 50% of the conversions. How did we figure this out?
Calculating the value of channels is carried out in three stages:
1. First, we need to calculate the probability of conversion for each of the channels. More precisely, we need to figure out how many conversions we get if we remove a specific channel from the chain.
The conversion probability (P) for each channel is calculated using the following formula:
P1 = (0.33 × 1 × 0.5) = 0.167
P2 = (0.33 × 0 × 0.5) = 0
P3 = (0.33 × 1 × 0) = 0
Let’s take a closer look at the first formula. This is our probability of conversion for channel C1. We remove the C1 channel from the model and multiply all the remaining transition probabilities from the chains that lead to the purchase. That is, we multiply 0.33 by 1 by 0.5. As a result, we get 0.167, or 16.7%. This is the conversion percentage we would get if we removed the C1 source from the funnel.
If we remove channels C2 and C3, then we’ll have no conversions at all.
2. Next, we determine the deletion effect (R) for each channel. This shows the percentage of conversions we’ll lose if we remove the channel from the funnel, and it’s calculated as follows: the unit of conversion (P) divided by the number of users at the beginning of the chain (transition probability) is subtracted from 1 (i.e. 100%).
R1 = 1 - 0.167 / 0.33 = 0.5
R2 = 1 - 0 = 1
R3 = 1 - 0 = 1
3. Finally, we calculate the value (V) of each channel. To do that, take the percentage of lost conversions (R) and divide it by the sum of all coefficients (R1, R2, and R3).
V1 = 0.5 / (0.5 + 1 + 1) = 0.2
V2 = 1 / (0.5 + 1 + 1) = 0.4
V3 = 1 / (0.5 + 1 + 1) = 0.4
Pros of Markov Chain Model for Marketing Attribution:
Markov Chain Models offer a multi-touch attribution approach, which means they consider all touchpoints in a customer's journey, not just the last click.
Data-Driven: These models utilize actual data to calculate the contribution of each channel to conversions.
Removal Effect: By simulating the removal of certain channels, Markov Chain Models can evaluate the impact of each channel on conversions.
Captures Transition Probabilities: Markov Chains capture the transition probabilities between different states (e.g., from awareness to consideration), providing a more nuanced understanding of the customer journey.
Flexible and Adaptable: The model can adapt to different marketing scenarios and can be tailored to a business's specific needs or Marketing Attribution.
Cons of Markov Chain Model for Marketing Attribution:
Complexity: Markov Chain Models can be complex to implement and require a certain level of statistical knowledge to understand and interpret.
Data Requirements: They require a substantial amount of data to produce reliable results, which can be a challenge for smaller businesses or new marketing campaigns.
Assumption of Memorylessness: The Markov Chain assumes that the probability of moving to the next state depends only on the current state, not on the sequence of events that preceded it. This assumption may not always hold in real-world marketing scenarios.
Long Implementation Time: Setting up, tuning, and interpreting Markov Chain Models may require a longer time compared to simpler models.
Cost: The implementation of Markov Chain Models may require specialized software and expertise, which could be costly for some organizations.
Automate your digital marketing reporting
Manage and analyze all your data in one place! Access fresh & reliable data with OWOX BI — an all-in-one reporting and analytics tool

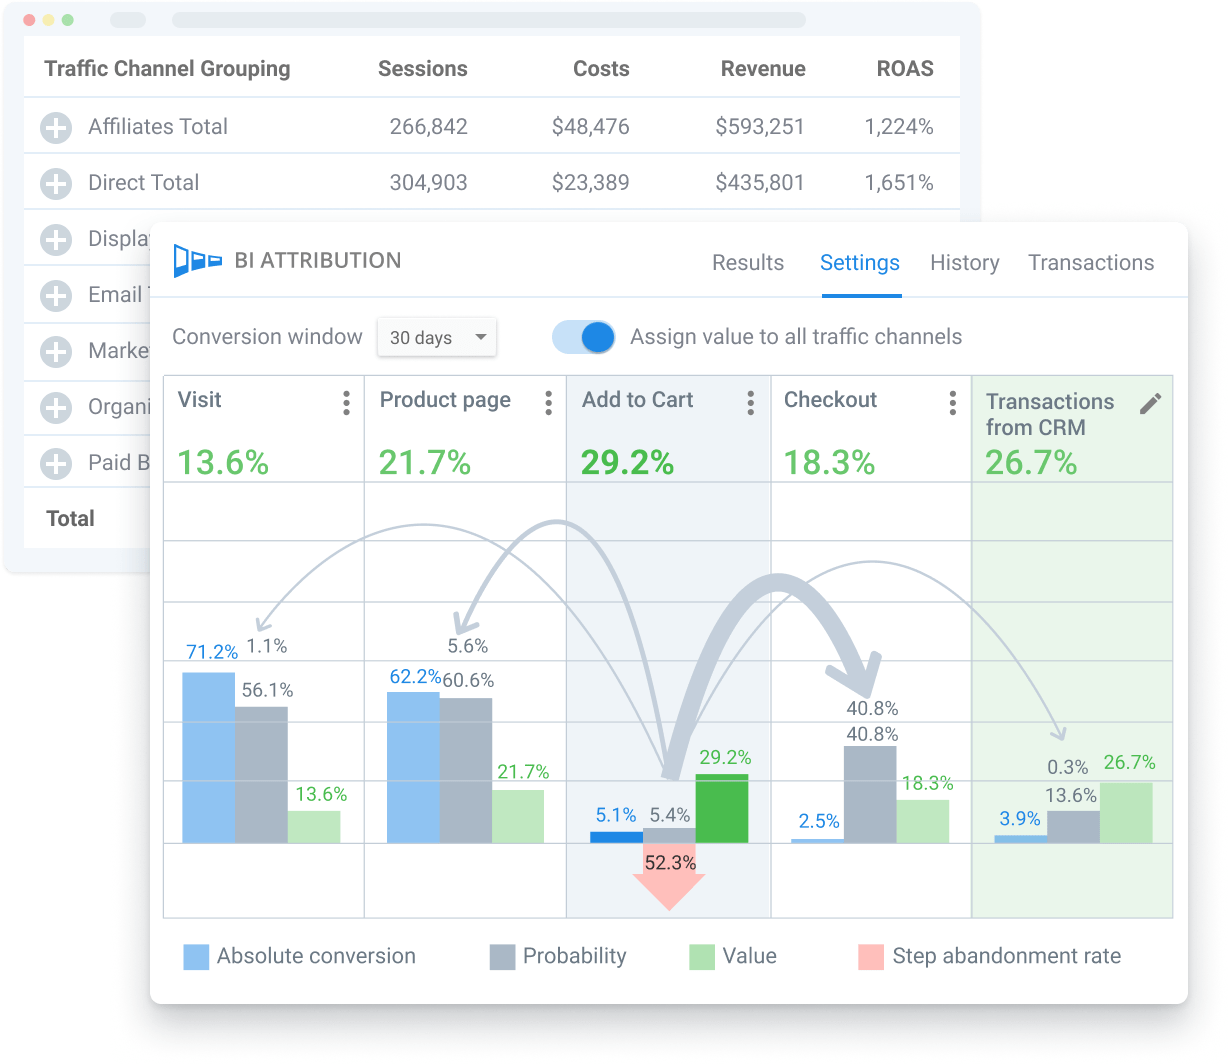
3. Machine Learning Funnel Based Attribution by OWOX BI
Machine Learning Funnel Based Attribution by OWOX BI helps you assess the mutual influence of channels on encouraging a customer through the funnel and achieving a conversion.
Previously, OWOX BI calculated the value of channels using a proprietary algorithm. But recently, we began to use the Markov chain in our calculations.
In the Machine Learning Funnel Based Attribution by OWOX BI, you can use the following information:
Data on user behavior on your site with the most accurate on-site user behavior tracking, collected in raw format to YOUR Google BigQuery (so you get 100% data ownership and control)
Data from all of the advertising services that you use
Data from your internal CRM or CMS system.
Optional (you can also build attribution models with OWOX BI based on the GA4 Export data)
All this data can be analyzed in a complex and used to configure funnel steps (the default funnel is Enhanced E-commerce). You can add any steps and data – for example, transactions from your СRM and any other online and offline events (calls, meetings, etc.).

In addition, we use data from the CRM to make advanced analytics. That is, we use one identifier to associate actions with a user across mobile, desktop, and any other devices. As a result, you’ll get a complete picture of a user’s interaction with your business and take into account the effect of all advertising channels on conversions.
It is suitable for anyone who wants to take into account every step of the user in the funnel and honestly evaluate advertising channels. Book a demo meeting with our specialists and find out what can be done for your company!
Pros of Machine Learning Funnel Model by Owox BI
Allows you to find an effective channel and say exactly where it’s effective. There are no restrictions on the minimum amount of data needed.
OWOX BI defines new and returned users and shows detailed information for each transaction, including which session, source/medium and user actions in the funnel led to it.
It also may account for margin and performance orders from your CRM.
Additionally, you can compare the effectiveness of advertising with your current attribution model and the Machine Learning Funnel Based Attribution by OWOX to identify undervalued or overvalued campaigns.
Cons of Machine Learning Funnel Model by Owox BI
How to Measure the Cost Efficiency of the Attribution Model
Conventional attribution models such as the Last Non-Direct Click are limited because they typically assign conversion credit to the last touchpoint, neglecting the influence of previous interactions. A funnel-based attribution approach, on the other hand, looks at the customer's entire journey, recognizing the contribution of each step within the sales funnel.
To test the cost of a funnel-based attribution model, you need to start by calculating Return on Advertising Spend (ROAS). This assessment helps in understanding the true value campaigns contribute to user journeys and overall business goals. By segmenting audiences and testing different attribution models, businesses can gain insights into more effective budget allocation. A testing period, usually spanning 30 to 90 days, allows for the observation of changes and adjustments in campaign strategy.
Let’s dive in deeper to understand.
1. Build the report with key performance indicators
Choose the performance target to evaluate the efficiency of your advertising efforts. Most businesses focus on ROAS, but in your case, it can also be ROI, CPA, or Share of advertising costs. The important thing is that when you compare this indicator for the two campaigns, you can understand which of the two is performing better.
Now, let’s build a report to compare the values of the chosen KPI and do campaign spend attribution. The first value is calculated according to the Funnel-Based Attribution model. The other value is calculated according to your current attribution model. If you rely on the data found in standard Google Analytics reports, this is most likely the Last Non-Direct Click attribution.
Campaign | Costs | Sessions | Revenue, $ | ROAS | Difference, % | |||
Last Non-Direct Click | Funnel Based | Last Non-Direct Click | Funnel Based | ROAS Difference | Costs difference | |||
campaign1 | 2,325,359 | 332,194 | 69,832,323 | 247,902,077 | 3003% | 10661% | –13% | –305,493 |
campaign2 | 1,184,186 | 296,046 | 11,727,555 | 38,079,496 | 990% | 3216% | –5% | –59,601 |
campaign3 | 2,840,574 | 946,858 | 39,170,752 | 128,024,626 | 1379% | 4507% | –22% | –615,091 |
campaign4 | 1,893,177 | 189,317 | 31,637,394 | 114,599,043 | 1671% | 6053% | 15% | 281,541 |
campaign5 | 442,209 | 315,86 | 10,496,869 | 39,890,792 | 698% | 2148% | 18% | 80,482 |
The ROAS Difference shows the relative difference between the ROAS calculated based on the Funnel attribution model and the ROAS calculated according to the Last Non-Direct Click one. This difference shows how the value of the advertising campaign would change if, rather than assessing the campaign through orders only, you focus on its contribution to each particular user’s journey through the funnel.
2. Segment your users for testing Attribution Cost
How do you understand if the new attribution model and the ROAS you’ve calculated provide a more objective measurement of your advertising campaigns? It’s quite simple — use them while allocating your advertising budget and compare the results.
One user interacts with multiple campaigns. Therefore, you can’t feasibly split advertising campaigns into two groups for testing. Moreover, the same advertising budget can’t be divided in two different ways simultaneously, which means you can’t run classic A/B testing. Thus, you need to identify audience segments that do not overlap yet (e.g. different geos) and, at the same time, are subject to the influence of external factors.
Within segment A, let’s work it out "the old-fashioned way." When allocating the budget in the B segment, let’s calculate ROAS according to the new model
3. Reallocate the advertising budget
The report you built in the first step will reveal which campaigns are overvalued — the Cost difference is negative, and which campaigns are undervalued — the Cost Difference is positive.
Before the reallocation of the budget, you need to decide which holds the higher priority for you:
Maximize revenue at the current advertising budget.
Maximize revenue at the current ROAS.
Preserve revenue at a lower advertising budget.
Before increasing the budget for any of the campaigns, it’s important to factor in an external indicator that can’t be measured by attribution: the amount of traffic a channel can realistically generate. If you conclude that you’ve reached a «growth plateau» in the campaign (a budget increase exponentially increases the average cost per click), this advertising campaign should be the last one to have its budget increased.
4. Determine the testing period
The model testing time depends on the conversion window, i.e., the time during which buyers pass through the funnel. This includes from the first visit to making an order on the website. It is important to consider which advertising campaigns help your customers move through the funnel at its upper steps and require more time to accumulate value. These are the campaigns that are the most likely to be undervalued when using the Last Non-Direct Click attribution.
In our experience, the optimal testing period is between 30 and 90 days. The first 75% of the time is not generally the period when things are happening; this is when you’re re-allocating the budget according to the new attribution model.
Simply put, knowing the true cost of your advertising efforts helps you spend your money smarter. By using a method that looks at every step a customer takes before buying, you can make better decisions about where to put your advertising dollars. This helps you get more bang for your buck and a clearer picture of what works and what doesn’t.
Key takeaways
Most marketers find it difficult to apply attribution results. But not applying the results of attribution doesn’t make sense!
It doesn’t matter what reports you have in Google Sheets or Google Data Studio. If you don’t distribute your budget based on this data and don’t change anything in your strategy, then there’s little sense in having these reports.
If you want to know the real effectiveness of your marketing:
Set a clear task for yourself, determine the KPIs for evaluating it, and decide what reports and dashboards should look like.
Determine who’s responsible for evaluating advertising campaigns in your company.
Determine the path of your users.
Take into account not only online but also offline data.
Verify the quality of incoming data: check whether there are any duplicate transactions on the site and whether every step that you want to take into account in the funnel is monitored.
Try to compare different attribution models and find a flexible solution that’s optimal for your business.
Make decisions based on data.
If you didn’t find an attribution model suitable for your project in this article, you can create a custom model as Answear did. Schedule a call with us and we’ll be happy to help you set up the attribution model (or a few models) you want to test for your business.

FAQ
-
What is the attribution model?
An attribution model is a set of rules that define how conversion credit is assigned to different touchpoints in conversion paths. -
What is a marketing attribution model?
Attribution model helps you figure out which advertising channels and campaigns work best and at what stage of the funnel. -
What are different attribution models?
There are dozens of possible attribution models. They can be classified in different ways depending on the logic used in their calculations.
If we look at what place a channel occupied in the customer journey before the order, then we’re using an attribution model based on position (Time Decay, Position-Based). If the calculation takes into account all data and not only the position of the channel in the chain, then it’s an algorithmic attribution model (Data-Driven, Markov chains).
If we give all the value to only one channel that participated in the funnel, then it’s a single-channel model (Last Click, First Click). If the value is distributed among all channels in the chain, then it’s a multi-channel attribution model (Linear, Time Decay).
![]() Get in-depth insights
Get in-depth insights
![]() Get in-depth insights
Get in-depth insights
The Ultimate Guide to Marketing Attribution Modeling: Everything You Need to Know