How to Drive Sales in Real Time: Pigu Group Case Study
Domas Raulinaitis, Digital marketing specialist at Pigu.lt
Rustam Tagiev, Content Writer @ OWOX
Get in-depth insights

Get in-depth insights
Top 30 Handpicked Google Looker Studio Dashboards for Marketers
Pigu Group is the largest player in the e-commerce market in the Baltic states. The owner of online stores 220.lv in Latvia, Pigu.It in Lithuania, and kaup24.ee in Estonia, Pigu is the first and only company in Lithuania to rank among the five fastest-growing technology companies in Central Europe for three consecutive years.
In 2019, Pigu Group became the first and only e-commerce marketplace in the Baltic states.
In this article, we’ll tell you how Pigu used OWOX BI to track and drive their marketing activities in real time during Black Friday 2019 and hear what Domas Raulinaitis, a digital marketing specialist at Pigu.lt, has to say about the company’s experience.
The challenge
During Black Friday 2019, Pigu wanted to run a number of marketing activities using SMS, mobile app push notifications, and emails with deals and special offers.
It was important for Pigu to see the impact of their 2019 marketing activities on website traffic, as this metric correlated closely with the sales they hoped to drive.
The idea was to monitor in real time how marketing activities drive user sessions across all Pigu Group e-shops and adjust the marketing efforts according to user activity while Black Friday was still on.
During Black Friday, which is the most important day of the year in online retail, we needed something that could help us be as reactive to user behavior as possible.
We wanted to monitor our marketing activities in real time and learn how they impacted user sessions. Knowing this, we could run a successful activity again or try other activities to generate more sessions. We also wanted to compare how sessions were trending during Black Friday 2019 in comparison to Black Friday sessions in 2018.
Pigu.lt

The solution
"The free version of Google Analytics can report only real-time pageviews. The Klipfolio tool that we also used was only able to show the number of active users in 15-minute intervals, which wasn’t exactly what we wanted. So eventually we came up with an alternative solution," said Domas Raulinaitis, Digital marketing specialist at Pigu.lt.
Pigu used OWOX BI Pipeline to collect user behavior hit data in real time, then compared it to data for the previous Black Friday and calculated the approximate number of sessions they could get in 2019.
OWOX BI can track user behavior data like pageviews in almost real time. So we decided to calculate how many pageviews per session we had generated during Black Friday 2018. Then we took this ratio and applied it to pageviews we were generating throughout Black Friday 2019 and transformed them into sessions.
As a result, we could on the fly calculate sessions we were getting throughout this Black Friday and see what impact certain marketing activities had on their volume.
Pigu.lt


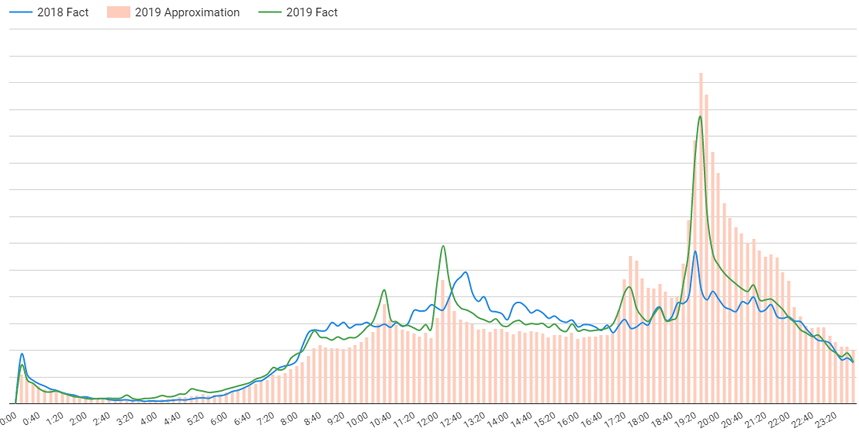
We built a simple line graph that compared last year’s actual Black Friday sessions to this year’s calculated sessions displayed in 10-minute intervals, — said Domas Raulinaitis, Digital marketing specialist at Pigu.lt.
Results
Tracking user activity in real time helped Pigu manage their marketing efforts throughout Black Friday 2019 and generate more sessions than the previous year.
"We were able to see instantly if SMS, mobile app push notifications, and emails sent to our user base worked well and generated traffic spikes of a certain volume which we did and — sometimes — didn’t expect.
All in all, we managed to drive almost 15% more sessions to our website compared to Black Friday 2018," — Domas Raulinaitis, Digital marketing specialist at Pigu.lt.
Additionally, Pigu was able to monitor how traffic was trending this Black Friday compared to the previous year and see if it was going faster or slower in both the first and the second halves of the day.
A day later, comparing the number of sessions calculated on Black Friday with the actual session data for that day proved Pigu’s hypothesis to be actionable.
"The day after Black Friday we checked that our calculated sessions were 13% higher than the actual, which was not a bad accuracy level considering the approach we took," — said Domas Raulinaitis, Digital marketing specialist at Pigu.lt.
However, now the Pigu team knows how they can avoid such discrepancies and get even more accurate real-time analysis in the future.
We could lower the percentage difference between calculated and actual sessions by looking at the pageview source and use different ratios per source. For example, “direct” might generate more pageviews per session than “display.” This would help us calibrate our calculations and increase their accuracy.
Pigu.lt

Get in-depth insights

Get in-depth insights
Top 30 Handpicked Google Looker Studio Dashboards for Marketers


