How to Save 80% on Advertising Costs — Case Study of eBike Manufacturer Delfast
![]() Get in-depth insights
Get in-depth insights
![]() Get in-depth insights
Get in-depth insights
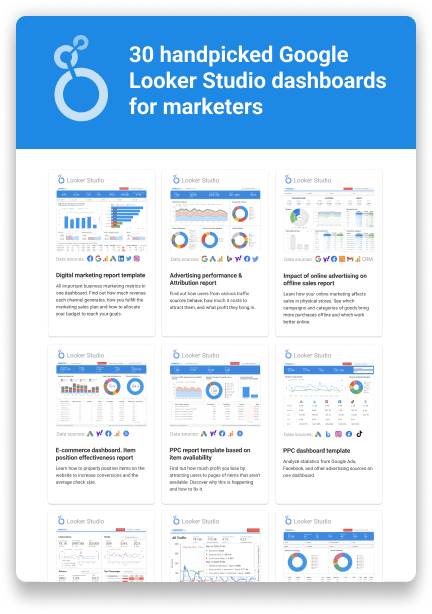
Top 30 Handpicked Google Looker Studio Dashboards for Marketers
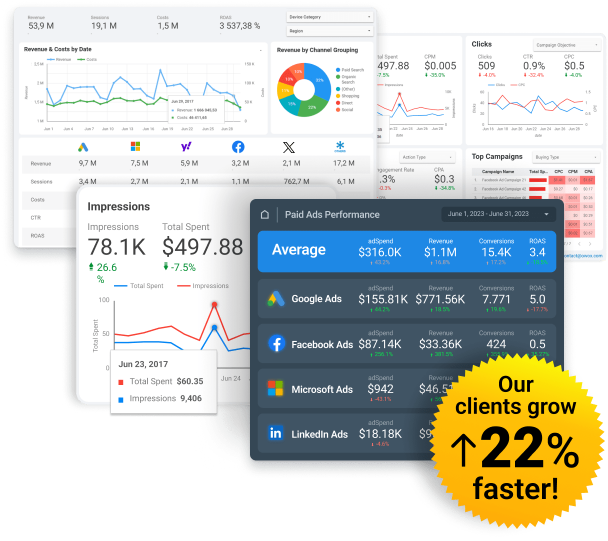
The OWOX team has built a smart dashboard for Delfast, a company that produces and sells eBikes. With the help of end-to-end filters in this dashboard, Delfast was able to identify expensive and ineffective advertising campaigns, turn them off, and save 80% of their monthly advertising budget.
Spend Smarter, See Results Sooner
Learn how to optimize every marketing dollar with personalized insights from OWOX BI
The company
Delfast is a leading global eBike manufacturer, producing unique, eco-friendly electric bikes that are exceptional in their range, power, and speed. The company holds the Guinness World Record for greatest distance traveled by an eBike on a single charge — 228 miles.
Delfast is a Ukrainian–American company with dual headquarters in Kyiv, Ukraine, and Whittier, California. They develop and prototype eBikes in Ukraine, produce them in China, and complete final assembly in Los Angeles.
Delfast started as a courier service in Kyiv, Ukraine, in 2014. In 2017, the company decided to close its successful courier business and dedicate itself fully to eBike development, launching a successful Kickstarter campaign that officially started the era of Delfast Bikes.
Challenges & Goals
Delfast’s marketers wanted to understand which online campaigns were bringing them real profit and which were wasting their advertising budget. For this, they needed a report that combined digital analytics data with sales information from their CRM. The report needed to show which online campaigns were bringing in leads, deals, and completed orders, how much advertising budget was spent on these campaigns, and what revenue they generated.
The problem was that the company’s data was collected and stored in different systems: advertising expenses were stored in advertising services, user actions on the website were stored in Google Analytics, and user and sales information was stored in HubSpot. To build a report based on this data, Delfast marketers needed to check for errors and clean, standardize, group, and merge data into a single format. This needed to be done regularly as data was updated in order to always have a current picture.
Cleaning, normalizing, and testing the compatibility of data from different sources takes a lot of time if you do it from scratch and manually. To prepare reports, analysts need to create and maintain a cascade of interconnected SQL transformations. Later, this turns into a tangle of SQL queries and scripts, the debugging of which takes a lot of time but doesn't create additional value.
Therefore, Delfast decided to automate report preparation using OWOX BI products.
The Solution
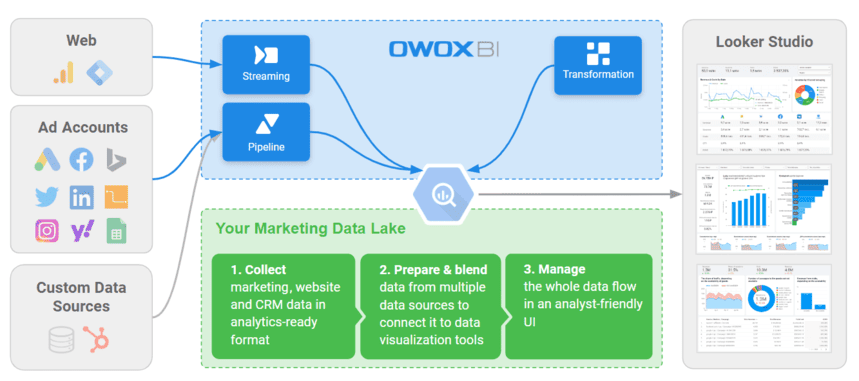
Step 1. Using OWOX BI Pipeline, the company automatically collects data from all its sources in Google BigQuery:
- Information from Google Analytics
- Raw data from the website
- Expenses from advertising services
- Customer data from the HubSpot CRM system
OWOX BI automatically converts the raw data into an analytics-ready format: unified tag formats, a single currency, no duplicates or anomalies, bot detection.
Step 2. OWOX BI Transformation automatically applies basic transformations to the collected data, such as sessionization, merging cost data, determining user type (new or returning), custom channel grouping, and many others. In addition, Delfast can create and apply their own transformations.
Step 3. Using OWOX BI Transformation, OWOX analysts created a data model for Delfast that takes into account necessary metrics and business features. Based on this data model, they built a data mart that is connected to Google Looker Studio.
This is what the data flow looks like:
Thanks to the data model, Delfast analysts and marketers have significantly reduced the time it takes to prepare other reports and dashboards. Now, when they need a report for ad-hoc analysis, they do not turn to raw data but to data that has already been cleaned, deduplicated, and contains the necessary business metrics.
Business Results for Delfast
As a result, Delfast received a nine-page smart dashboard that combines their online data (expenses, sessions, and users) with CRM data (contacts, deals, and closed deals).
Thanks to this dashboard, Delfast marketers identified campaigns that consumed the majority of the budget and brought online conversions but did not generate closed deals.
Delfast marketers then turned off these campaigns and were able to redistribute 80% of the released budget to other campaigns.
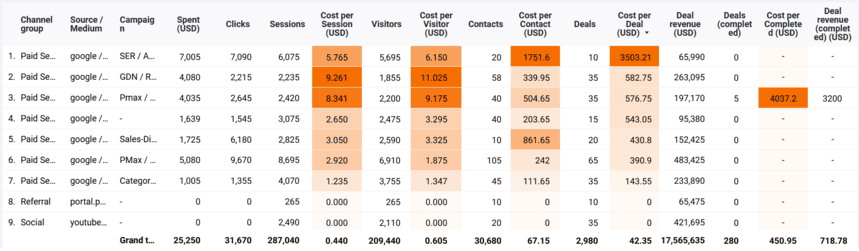
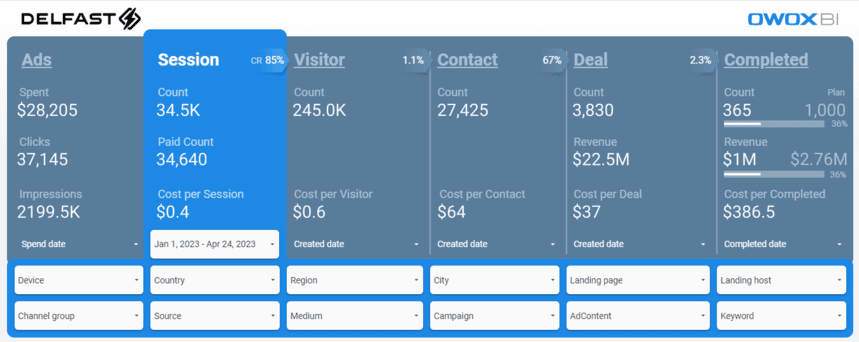
The main dashboard displays statistics on all key indicators broken down by Channel group, Source/Medium, and Campaign.
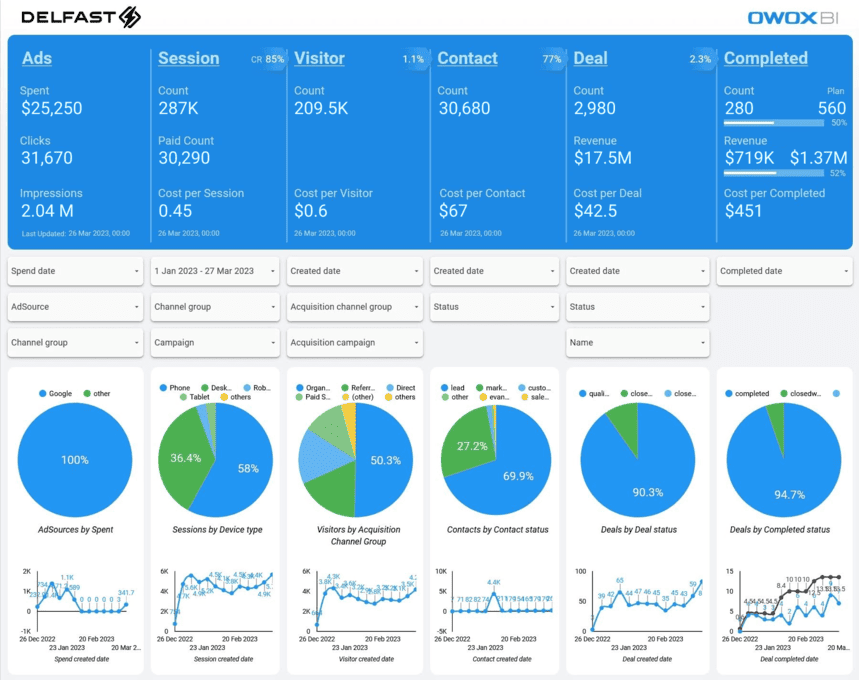
On other pages, detailed information is provided separately for Ads, Sessions, Visitors, Contacts, Deals, and Completed deals.
The key feature of this dashboard is the end-to-end filters. For example, when applying a Channel group filter to sessions (leaving only Paid Search), the dashboard will filter the entire next part of the funnel and update all metrics (visitors, contacts, conversions, and completed orders).
Before applying the filter:
After applying the filter:
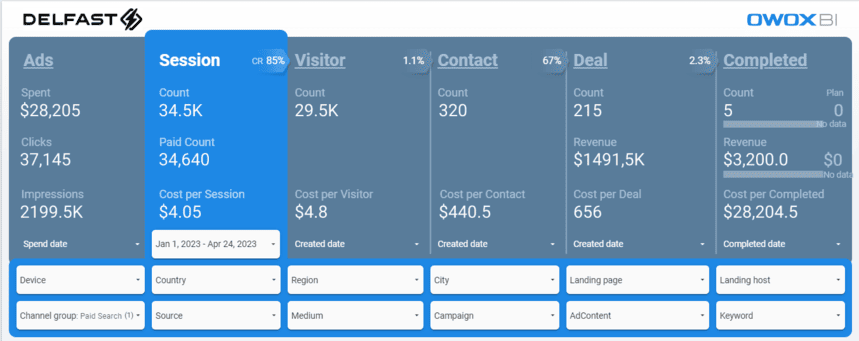
Thanks to this, Delfast specialists can quickly learn about the cost not only of online conversions but also of completed orders.
Another advantage of this dashboard is that the date filter can be applied separately for each object in the funnel. For example, filtering all conversions for February will not reduce unrelated objects in other stages of the funnel.
This allows marketers to see all conversions that campaigns bring, taking into account the delayed effect. For example, say Delfast launched an ad campaign in January and had sessions for it in January. Now they want to know how many conversions this campaign brought not only in January but also in February, March, and April. To see this information, they just need to apply a date filter to the sessions — all other objects (conversions and completed orders) will not be filtered by date.
If you want the same dashboard, sign up for a demo!
![]() Get in-depth insights
Get in-depth insights
![]() Get in-depth insights
Get in-depth insights
Top 30 Handpicked Google Looker Studio Dashboards for Marketers