How to boost sales and customer loyalty by fixing errors on the checkout page
![]() Get in-depth insights
Get in-depth insights
![]() Get in-depth insights
Get in-depth insights
Top 30 Handpicked Google Looker Studio Dashboards for Marketers
In the modern, fast-evolving digital world, customers rely on the online opportunities offered by businesses and expect everything to be no less than perfect. Having once experienced any errors on their customer journey, these clients will remember the bad service and prefer to look for alternative products/services. That’s why it’s so important to prevent any hardships and monitor the business performance constantly.
In this case, we describe the solution provided by the OWOX BI team for a consumer electronics and home appliances retailer that had challenges with fixing errors at the checkout page to increase sales and customer loyalty.
Challenge
Around 700,000 people visit the retailer’s website per day, to read product reviews or browse around to find what they’d like to buy. However, users may sometimes experience website errors at the checkout page that prevent them from completing an order online, thus, decreasing the company’s revenue.
Goal
The analysts along with testers carefully studied the customer complaints to define the typical error scenarios. The errors that the specialists managed to reproduce were fixed. The rest of the critical bugs required setup monitoring. Previously, the company didn’t use to collect such data, remaining unable to evaluate the exact number of bugs and how they affect the conversion rates. The company also needed to know how each bug was connected with a certain user, in order to help the user place an order.
The analysts chose to set up monitoring of the critical bugs on the website and do all their best to help customers successfully place orders at the checkout page. This would increase sales and improve the customer website experience. The challenging factor was that real-time monitoring was required in order not to lose any of the customers currently trying to order something on the website.
Solution
The following plan was prepared to reach the goal:
- Place the additional code on the website to collect data about errors and send them to Google BigQuery.
- Process the obtained data and export it to the table with the structure according to the company’s needs.
- Organize sending data about users and errors to call centers that would contact customers to help them place an order.
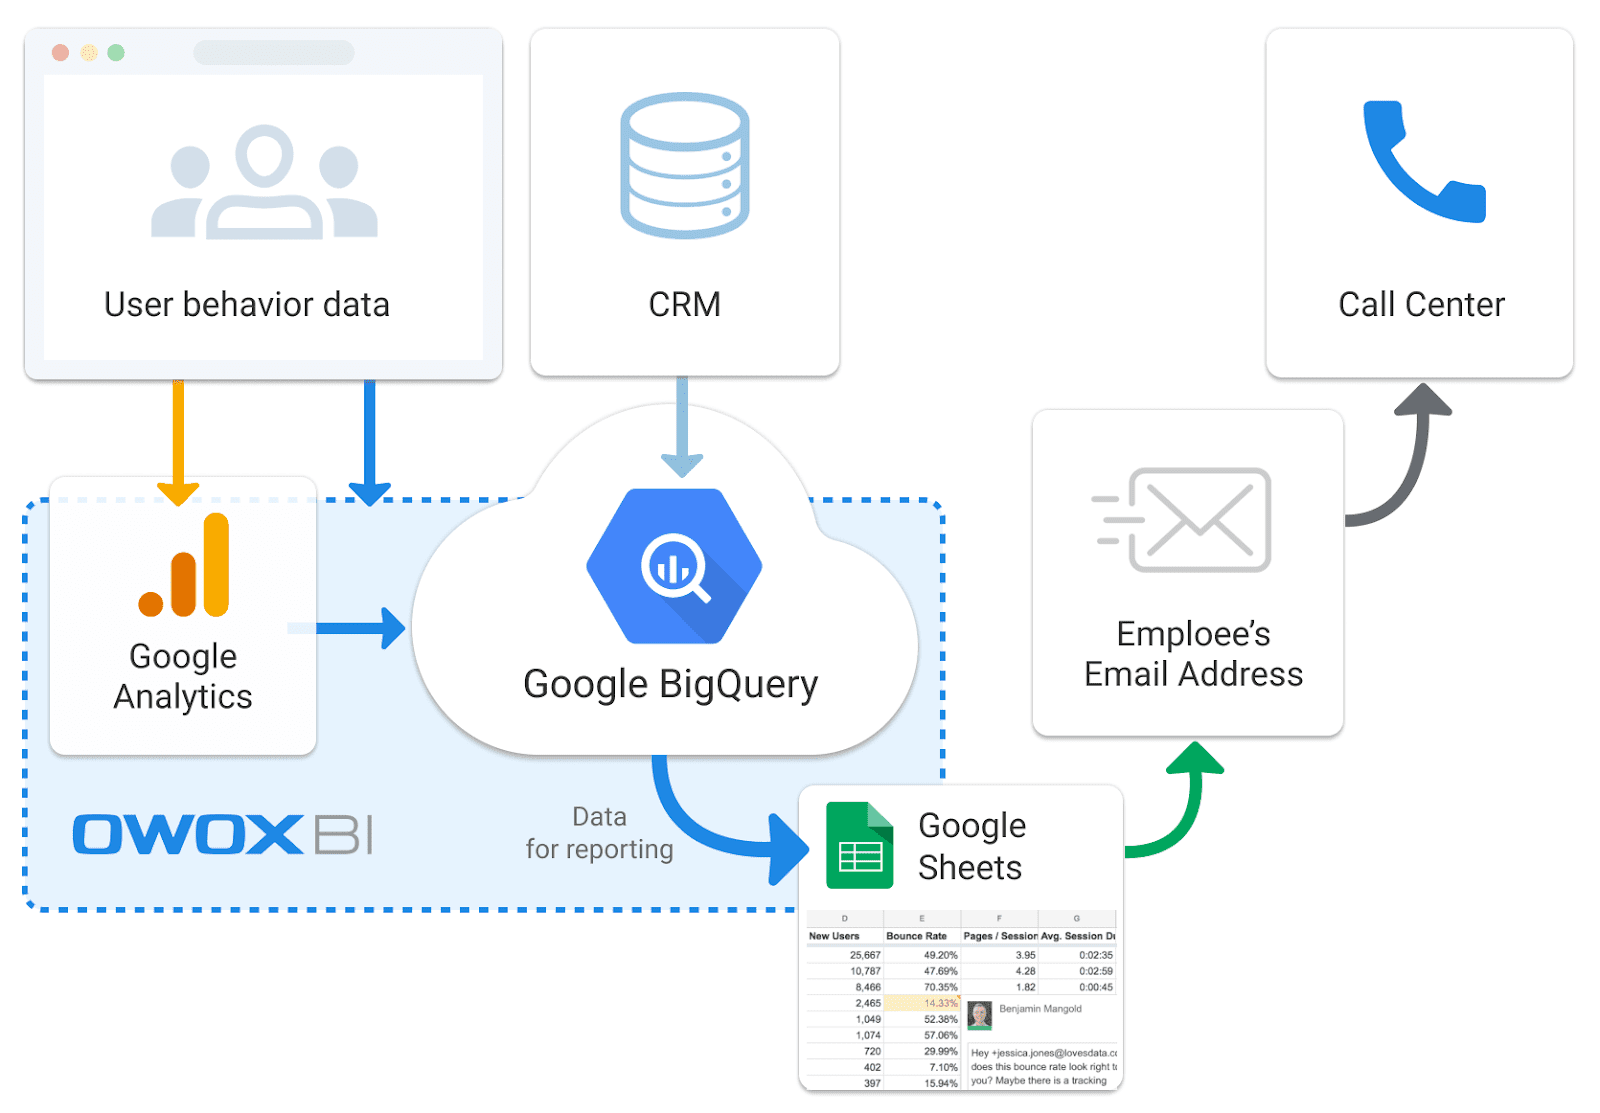
Here’s how the company’s data flow looks:
Step 1. Collect data about errors
The company uses Google Tag Manager to track what users do online. Though, not all logic errors on the website can be tracked by standard Google Tag Manager ways. This is why the custom scripts were written specifically and implemented through Google Tag Manager on the necessary website pages. The scripts add the detailed error data to the DataLayer.
Next, with the help of the Google Tag Manager tags, the error data goes to Google BigQuery through the OWOX BI Pipeline. This allows obtaining raw unsampled data from the website in Google BigQuery, in near-real time.
Using the API, the analysts send the data about users from CRM to Google BigQuery, obtaining all the data they need in the cloud data warehouse:
- Error time.
- Error type.
- User ID.
- User email address.
- User city.
- Current product status in the cart.
Step 2. Process data
Using OWOX BI Pipeline, the data tables with a wide range of parameters were obtained. The OWOX BI analysts created an SQL query to pull data from the table, returning it with a definite structure: a set of lines where each line equals a single mistake.
Below is the SQL query example:
Select
date, hour,minute, email, description, City, productIds, productnames, productprice, cartquantity, cartamount,
From
(
SELECT usererrors.date as date, usererrors.hour as hour, usererrors.minute as minute, usererrors.userEmail as email, usererrors.action as action, usererrors.error as error,
case when action = 'disabled' and error = 'buttonCreateOrder' then 'Unable to checkout in cart'
when action = 'notAdded' and error = 'productToCart' then 'Unable to add product to cart'
when action = 'open' and error = 'emptyCart' then 'Product can not be viewed in cart'
when action = 'open' and error = 'HoldingPageCheckout' then 'Maintenance work in progress (after checkout)'
when action = 'absent' and error = '5discountCart' then '5% discount unavailable online (in cart)'
when action = 'absent' and error = '5discountCheckout' then '5% discount unavailable online (at the checkout page)'
when action = 'disabled' and error = 'buttonSubmit' then 'Button "Place Order" not working at the checkout page'
else 'Other' end as description,
Dimensions.city as City, Dimensions.productids as productIds, Dimensions.productnames as productnames, customMetrics.productprice as productprice, customMetrics.cartquantity as cartquantity, customMetrics.cartamount as cartamount,
FROM
(SELECT date, hour,minute, hitId, userEmail, eventInfo.eventAction as action, eventInfo.eventLabel as error, hour(CURRENT_TIMESTAMP())+2-hour as currenthour
from TABLE_DATE_RANGE([your-site-com:Streaming.streaming_],
DATE_ADD(CURRENT_TIMESTAMP(), 0 ,'DAY'),
DATE_ADD(CURRENT_TIMESTAMP(), 0 , 'DAY') )
where eventInfo.eventCategory = 'Errors' and userEmail is not null
group by 1,2,3,4,5,6,7,8) as usererrors
left join
(SELECT hitId, MAX(IF(customDimensions.index=4, customDimensions.value, NULL)) WITHIN hitId AS city, MAX(IF(customDimensions.index=21, customDimensions.value, NULL)) WITHIN hitId AS productids,
Max(IF(customDimensions.index=22, customDimensions.value, NULL)) WITHIN hitId AS productnames
from TABLE_DATE_RANGE([your-site-com:Streaming.streaming_],
DATE_ADD(CURRENT_TIMESTAMP(), 0 ,'DAY'),
DATE_ADD(CURRENT_TIMESTAMP(), 0 , 'DAY') )) as Dimensions
ON Dimensions.hitId=usererrors.hitId
left join
(SELECT hitId, MAX(IF(customMetrics.index=1, customMetrics.value, NULL)) WITHIN hitId AS productprice, MAX(IF(customMetrics.index=4, customMetrics.value, NULL)) WITHIN hitId AS cartamount, Max(IF(customMetrics.index=5, customMetrics.value, NULL)) WITHIN hitId AS cartquantity
FROM TABLE_DATE_RANGE([your-site-com:Streaming.streaming_],
DATE_ADD(CURRENT_TIMESTAMP(), 0 ,'DAY'),
DATE_ADD(CURRENT_TIMESTAMP(), 0 , 'DAY') )) as customMetrics
ON customMetrics.hitId=usererrors.hitId
where usererrors.currenthour=0
)
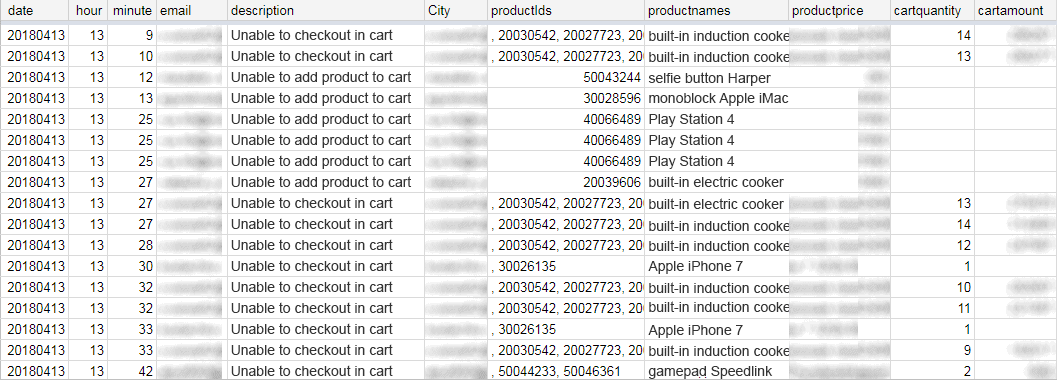
ORDER BY date asc, hour asc, minute asc, email ascAs the result of the query, the analysts obtained a table containing following information:
- Date;
- Hour;
- Minute;
- User email address;
- Error description;
- User city;
- ID of the product in the cart;
- Names of products in the cart;
- Price of products in the cart;
- Total number of products in the cart;
- Total price of products in the cart.
Then, the data import to Google Sheets was set up, using the OWOX BI BigQuery Reports add-on that updates the information in the tables automatically and hourly. This means that the report always contains up-to-date data about errors for the previous hour.
You can find an example of such a report below:
Step 3. Use the obtained data
The users in charge automatically receive the report about errors every hour (9 AM to 6 PM, according to working hours). Next, they send it to the company’s developers in case there are critical issues to fix, and to the customer success managers who call users and help them complete an order on the phone.
Results
- The structured report was created to monitor the website errors that prevent users from making a purchase.
- The company’s developers added a feedback form to the website. It automatically appears each time users who didn’t log in see an error, thus, allowing them to report the problem and leave their contact details. This helps the company quickly react to any errors or bugs, as well as extend the customer base, including contacts of the users who didn’t log in.
- The call centers of the company can quickly get data about users that face problems while adding the product to the cart and checking out. The call center operators get to know what’s inside the cart and help finish the purchase.
- Around 3% of users who received a call because of the website error, successfully finish placing the order on the phone. This gives the company an additional $1,600 that would have been lost if errors were ignored.
![]() Get in-depth insights
Get in-depth insights
![]() Get in-depth insights
Get in-depth insights
Top 30 Handpicked Google Looker Studio Dashboards for Marketers