The four horsemen of digital marketing analytics: Consent mode, ITP, ad blockers, and GA 4

In this article, we talk about the latest marketing analytics trends. If ignored, they can bring many headaches to marketers and analysts responsible for collecting and preparing data for reports. Namely, ignoring them can significantly harm ad campaign evaluations, reducing the effectiveness of campaigns and the number of attracted customers.
Let’s analyze how Consent mode, restrictions on the use of cookies, ad blockers, and the new Google Analytics 4 affect the quality of your data and the work of digital analysts. You’ll also learn why you need to act now and change your usual way of creating marketing reports.
Why you can’t ignore marketing analytics data quality if you want to maximize ROI
As online advertising budgets continue to rise, so does the cost of customer acquisition.
Most marketers try to adapt by optimizing ad campaigns, landing pages, and creatives. But few understand that an advertising campaign can have a low ROI or ROAS not because it is bad but because of poor data quality. To properly optimize your ad campaign, you need to make sure you can trust the data you’re basing your decisions on.
According to Forrester research, one of the main reasons for rising ad spending is poor data quality for marketing analytics. Here are some of the implications in numbers:
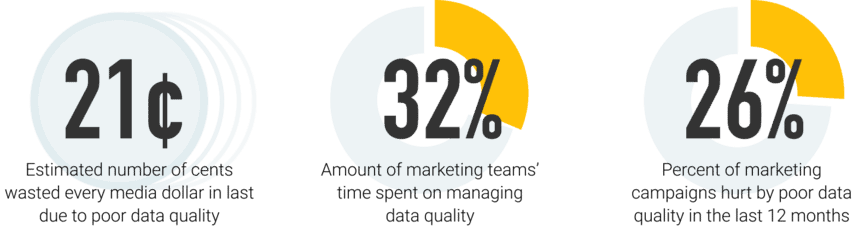
These numbers are not random. The marketing tool stack is growing. In our experience, a simple marketing report requires an average of 10+ data sources. If you do not react to current changes in time, this can lead to up to 60% of conversions in your reports having the wrong traffic source. How will this affect your marketing?
A preliminary assessment allows us to draw the following conclusions:
- Intuitive marketing decisions will become more important, making those decisions less likely to be successful. Reports will show ~30% fewer conversions across all non-direct channels than before.
- Marketing departments will lose almost all evidence of the impact of display campaigns on conversions. Every attribution model will look like last click.
- Marketing departments will have fewer data-driven arguments to prove their results and protect their marketing budgets. The total share of mismatched CRM conversions will be ~40%.
Here is what your report might look like without complete and accurate data:
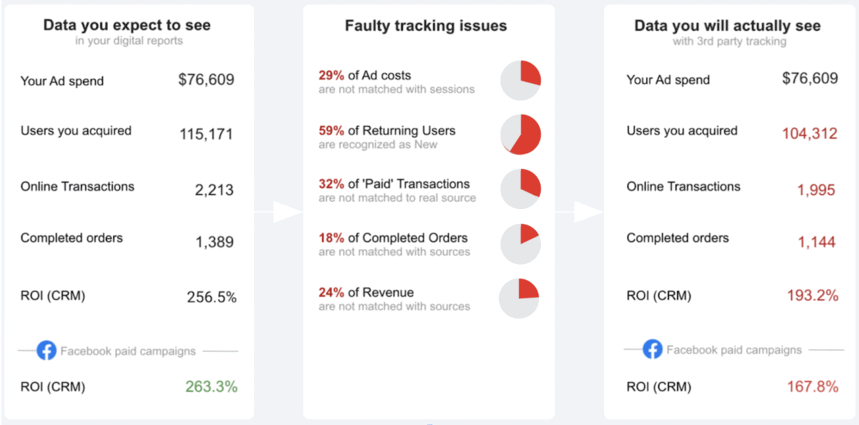
The sadly predictable result is that this data will not meet any of your marketing team’s requirements to ensure timely insights and performance improvements.
Why you receive erroneous or incomplete marketing data and how to fix it
We have identified four main challenges to the quality of data in today’s reports. Imagine all the users you acquire each month. Let’s see what proportion of conversions have the wrong traffic source due to tracking issues.
1. Browsers limit the use of third-party cookies
What’s happening
Browsers and platforms limit the lifetime of third-party cookies set by a third-party domain. This affects the display of important identifiers for analytics systems.
Read more about this issue in our article on how to prepare your marketing and analytics for a world without cookies.
For example, Client ID is the primary ID of a user who is not logged in. It is set by the JavaScript analytics code in the user’s browser and stored in a cookie. But this cookie is subject to restrictions in Safari (ITP 2.2) and Mozilla (ETP). Its lifetime is reduced to seven days, and in some cases down to one day.
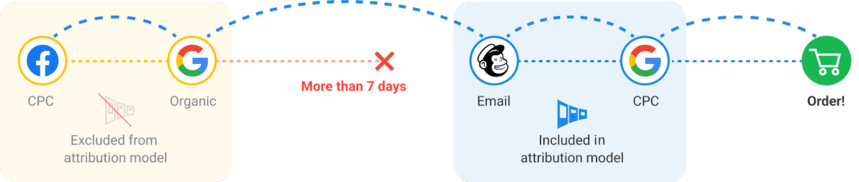
Today, the share of such traffic is 20%. From 2023, Chrome will join Safari and Mozilla, and the share will grow to between 50% and 60%. You can find out how this will affect your project by connecting your data to this dashboard.
What you can expect to see in your reports
You’ll notice the following changes in your marketing reports right now:
- The share of conversions for new visitors will grow by 20-25%. These are not real “new” visitors, but rather former “returning” visitors.
- The share of direct / none conversions will grow by 10-20%.
- The ROI of paid ads in reports will have a margin of error of 10-20%. More often, it will be on the lower side.
How to solve the problem: Implement first-party data collection
To solve this problem, we need to make cookies that are perfect for browsers. Here’s how to do this in technical terms:
- Place the cookie with the server, not with JavaScript
- Create the cookie with the httpOnly, Secure, and SameSite parameters
- Install the cookie on behalf of your own site’s domain (via an A-DNS record)
A first-party cookie is set by the advertiser’s web server and is resistant to ITP 2.2 and ETP used by browsers. And it won’t be reset after one or seven days.
For example, you can use first-party cookies with a long lifetime to identify users with the help of OWOX BI server-side tracking. OWOX writes its unique user identifier, owoxUserId, into each first-party cookie, allowing you to accurately determine referral sources. This will significantly reduce your percentage of direct/none traffic. You can learn more about how it works by signing up for a demo.
What to expect
Let’s give an example of setting a first-party cookie for an e-commerce project:
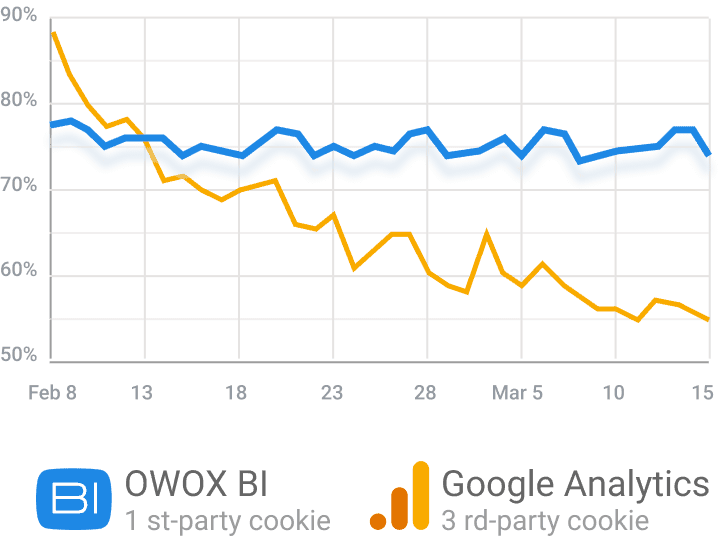
In the chart above, you can see the share of new users from Safari in first-party cookie sessions is 5% less than the share in third-party cookie sessions already in the second week of data collection. By the end of week six, the difference has reached 20%. These 20% are actually returned users and those who have previously visited from other traffic sources.
If you switch to collecting data from first-party cookies, starting in 2023, you can expect 20% of conversions to have more connections to previous traffic sources. Your attribution will be more accurate.
2. Ad blockers affect Google Analytics tracking
What’s happening
More than 27% of users install apps to block ad content. And this share is growing every year. Most of these users do not reach the site, as the advertising message is blocked. But about one-third of users who install ad blockers (about 9% of all users) will still visit your site through organic or unblocked content.
What you can see in your reports
Such users and conversions are invisible for Google Analytics, since sending data to this analytics system also falls under the block.
These conversions can only be found in your CRM, but there they will be registered without a traffic source. Thus, spending on advertising campaigns remains the same, but the events and transactions on which decisions are made are 10% fewer. Since the distribution of this 10% across sources is disproportionate, you will see ROI distorted downwards in reports.
How to solve it: Set up server-side data collection on a custom domain
Set up a separate access point to transfer all events from the server side. The access point is configured on a custom domain (for example, tracker.yoursite.com). With this configuration, most ad blockers won’t block event collection, as this domain won’t appear on their lists.
What to expect
On average, you can expect 7% to 8% more data collected on conversions, users, and online traffic in reports. For CRM sales, you can expect 7% to 8% more traffic sources to be collected.
Uncover in-depth insights
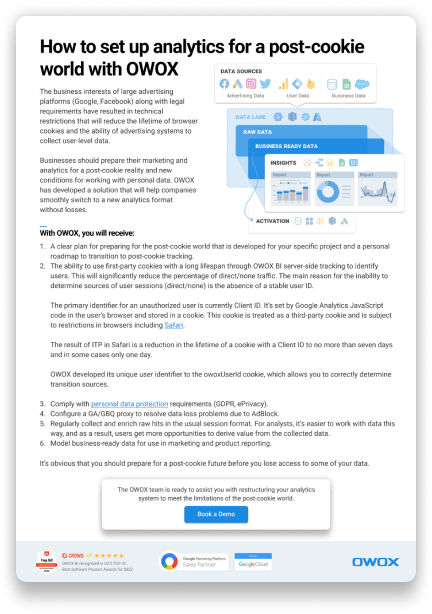
How to set up analytics for a post-cookie world
Download nowBonus for readers
3. Consent mode reduces the number of conversions for which a traffic source can be identified
What’s happening
To comply with GDPR requirements, the website owner must refuse to identify users who don’t want to share their cookies and don’t click on a magic marketing button that says “Accept cookies.”
When users reject cookies, advertisers will continue to collect user activity data. But they won’t be able to determine which interactions with ads lead to conversions.
The average share of users who reject cookies on projects with consent mode implemented is 30%. Depending on the type of project, this share can reach 40%.
What you can see in your reports:
In marketing reports, the volume of online conversions will remain the same. But the conversions won’t be connected to the click source and completed orders in the CRM. As a result, 30% of revenue won’t be associated with advertising campaigns and you will get a very low ROI.
How to solve it: Use conversion modeling
Make sure that consent mode can be configured for your tracker in accordance with all GDPR requirements.
After configuration, check if user data is collected for unconsenting users: the email, phone number, user id, and IP address fields must be empty.
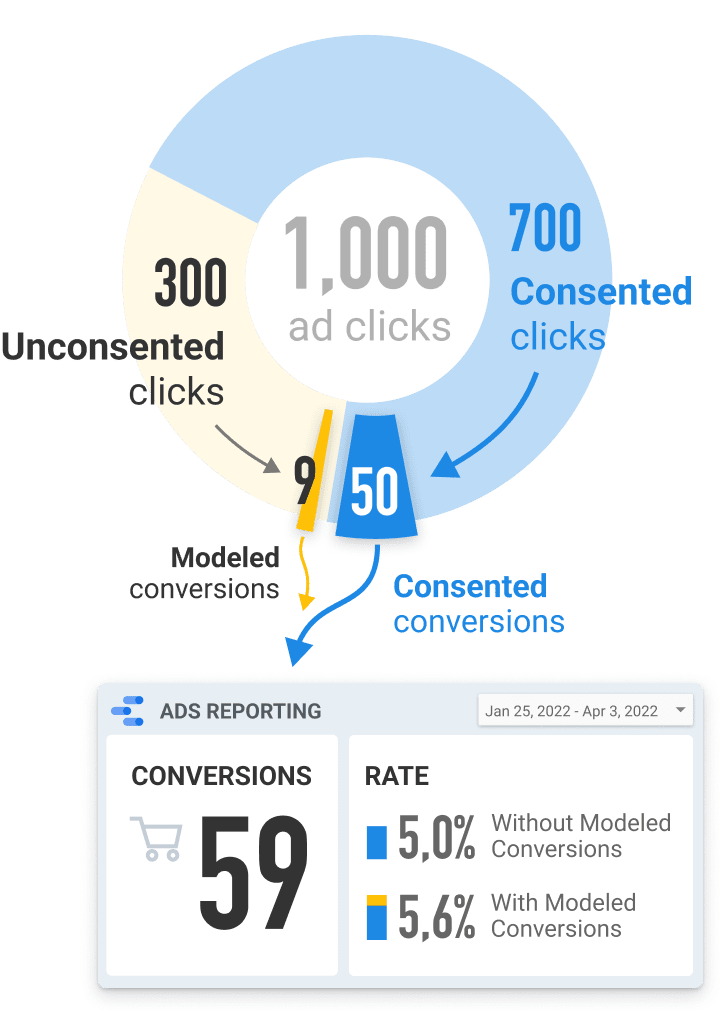
Let’s be clear: After this step, you’ve collected ~70% of conversions with traffic sources (consented) and ~30% without sources and matching IDs (unconsented). But there are non-personal parameters you can use for machine learning modeling of the conversion source: region, browser, and device.
Calculate modeled conversions for the unconsented conversion segment and add this metric to your reports.
How conversion modeling works
For that part of the data that is consented (isConsent = TRUE), we build a report in the old way: we have a source / medium, we see the number of transactions, and we can definitely say that there were two transactions from google / organic and one from facebook / cpc:
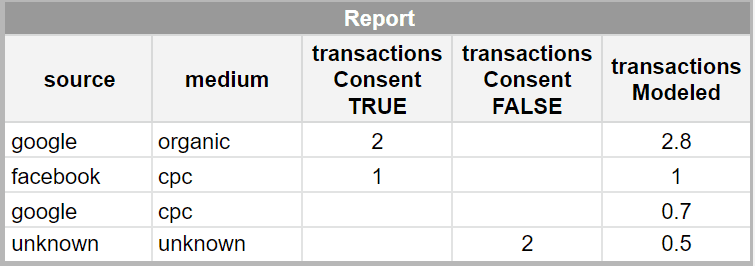
We also have two transactions whose source is unknown because isConsent is FALSE. To determine their source, we use a machine learning model trained on consistent data as well as additional parameters (User-Agent, Geo, Device, and others). To put it simply, the model analyzes matched conversions with known sources and proportionately distributes the remaining inconsistent conversions to those sources / mediums that are in the data.
In the last column of the table above, we see modeled transactions.
What to expect
For 30% of unconsented users’ conversions, a traffic source is identified based on an ML model trained on the consented segment. You will see the adjusted ROI in your reports.
4. The data structure in Google Analytics 4 is fundamentally different from Universal Analytics
What’s happening
The new version of Google Analytics uses a completely different data structure and data collection logic. Universal Analytics has a so-called session-based (cookie-based) data model, with reports built on Client ID and sessions. Google Analytics 4 has an event-based (user-based) model, where everything is built around events (and not around sessions), and any interaction with the website is considered an event. Events are logged, and the user’s path through the website is built from them.
What you can see in your reports
If the structure of the initial data changes, then all reports that use this data will have to be redone.
For example, say you have an old report in Google Sheets or Data Studio based on Universal Analytics data. You’ve set up Google Analytics 4, collected data for a while, and decided to connect it to this report. But Google Analytics 4 collects sessions in a different way, the numbers do not match, and traffic and other indicators are gone. Now the question arises: What is the problem? Did you set up tracking in GA4 incorrectly? Did you build data queries incorrectly? Or did something change in the market?
In order for Universal Analytics data to be comparable to Google Analytics 4 data, your data needs to be transformed into a modeled structure — in short, reduced to a common denominator. In this case, it will be necessary to rewrite all SQL queries that form your reports. And you will have to do this every time you need to change a report, add new metrics, etc. Marketers and other employees cannot order reports in advance because they do not know which may be needed at any given moment.
But constantly rewriting all SQL queries is not an option — they will become obsolete faster than analysts write them.
How to solve it: Set up Google Analytics 4 now
If your KPIs include metrics such as ROAS and/or online conversions, you have approximately two months left to smoothly upgrade to Google Analytics 4. Yes, only two months, even though the Universal Analytics shutdown date is July 1, 2023.
The reason is that the Google Analytics 4 data schema and logic is different from that of Google Analytics Universal. Thus, annual trends are at stake unless you start collecting data in Google Analytics 4 by July 1, 2022.
For example, sessions in Google Analytics 4 do not break at midnight, and events can have traffic sources other than sessions. Thus, you can expect discrepancies between the same indicators.
Root cause analysis is a fundamental activity for every digital analyst and is almost impossible without seasonality data.
OWOX has a solution that will help you make the transition to Google Analytics 4 as painless as possible, keep the reports you need, and get new ones without having to rewrite SQL queries. A lot of our clients have already taken advantage of it.
Find out how OWOX BI can help you transition to GA4 by signing up for a demo.
Key takeaways
- Due to problems with data timeliness and accuracy, marketing departments waste 21% of the budget and 32% of the team’s extra time.
- Modern tracking restrictions that affect data completeness also add to these problems. Up to 60% of online conversions may have the wrong source.
- With such ROI accuracy, it’s harder for the marketing department to protect the budget, draw reliable conclusions, conduct experiments, and, therefore, grow. Although the chances are high.
- The good news is that maintaining the connection between budgets and performance is an understandable and realistic task. It consists of implementing four technological solutions sequentially and is described in this article. These solutions determine the traffic source chain for over 97% of conversions. And all four of these solutions can be configured with OWOX BI.

FAQ
-
What are the four horsemen of digital marketing analytics?
The four horsemen of digital marketing analytics refer to the key pillars of successful digital marketing analytics: data collection, data processing, data visualization, and data activation. -
Why is data collection important in digital marketing analytics?
Data collection is crucial in digital marketing analytics because it enables you to gather valuable information about user behavior, preferences, and engagement. This data helps marketers make informed decisions, optimize campaigns, and improve overall marketing strategies. -
How does data activation benefit digital marketing?
Data activation in digital marketing is the process of utilizing analyzed data to execute targeted marketing campaigns. By activating data, marketers can personalize their messaging, identify potential customers, and create effective marketing strategies that increase conversion rates and overall performance.