Data Processing with OWOX BI: Normalize, Prepare, and Orchestrate
Olga Mirgorodskaya, Creative writer @ OWOX
Maryna Sharapa, PR Manager @ OWOX
The more data a company collects from various sources, the more complex the entire analytics system becomes. Thus, it becomes more difficult to manage the analytics system and find insights you can trust. Analysts have to spend more time processing and preparing data for reports instead of looking for data growth points and risk areas.
Here at OWOX, we have been involved in analytics for over 20 years and are well aware of the difficulties analysts face at each stage of working with data. As a result, we’ve created software with an analyst-friendly UI that helps analysts simplify reporting and data management and get business-ready data faster and easier.
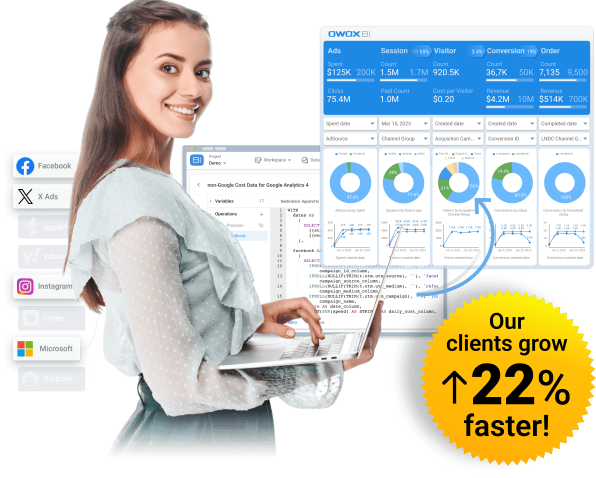
Streamline Analytics for Clarity!
Discover ease in data management. Explore now!
What is business-ready data and why is it needed?
Business-ready data is the final cleaned data set in a structure that matches your business model. Business data actually describes the business model. For example, what exactly is meant in a particular company by the terms users, B2B users, transactions, leads, etc? These definitions describe the business at its core. The business data model allows all employees to have a common understanding of how data is used and understood.
In other words, business-ready data is ready to be used in marketing and product reporting and can be sent to any visualization service (Power BI, Tableau, Google Data Studio).
If you build reports on raw, unmodeled data, you can encounter a lot of recurring problems: searching for errors and the causes of discrepancies takes a lot of time, and business logic needs to be constantly duplicated in all SQL queries.
Therefore, converting raw data to business-ready data is an important step that should not be skipped.
Uncover in-depth insights
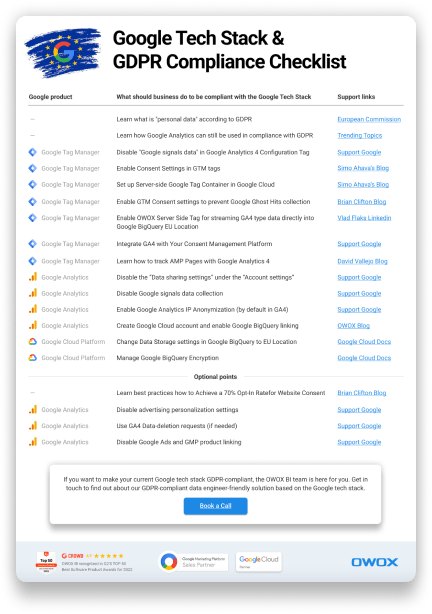
Google Tech Stack and GDPR Compliance Checklist
Download nowBonus for readers
What challenges do analysts face on the way to business-ready data?
1. Lack of analytics-ready digital marketing data
The challenge
Analysts collect data from disparate services and systems. Naturally, the structure and format of data in these sources vary. To build reports, data from different sources must be correctly merged. By itself, the data uploaded through connectors or various ETL services is inaccurate (containing errors, duplicates, and discrepancies) and lacks a unified logic and structure. Inaccurate and fragmented data needs to be cleaned up and normalized into an analytics-ready format.
What is bad about it?
Converting data from disparate sources into a single format is difficult. For example, you can collect cost data from different advertising platforms (Google Ads, Twitter Ads, Facebook Ads) and each system can have its own currency and its own label for this field.
Another goal of data normalization is to solve data redundancy issues (when the same data is stored in the database in several places). Data redundancy contributes to various anomalies, reduces performance, and makes data management inconvenient.
Normalizing all data manually is quite a challenge. When working with a large amount of data, many errors and inconsistencies can appear, mainly related to endless SQL queries and scripts. If something goes wrong or changes (for example, a service API is updated), everything will collapse.
Data normalization is a chore that distracts analysts from taking on more interesting tasks and searching for insights. Not to mention that it usually takes up to 50% of an analyst’s working time.

How OWOX solves these issues
OWOX automatically collects data for analysis in a convenient format from all your marketing sources:
- Google Analytics 4, Firebase, and AppsFlyer
- Raw website data with full GDPR compliance
- Advertising platforms
- CRM systems
- Other marketing sources
With OWOX BI, you don’t need to manually clean, structure, and process data. The service will automatically normalize raw data into an analytics-ready format by:
- Recognizing dynamic parameters in UTM tags so you get complete data on advertising campaigns
- Converting ad costs into a single currency so you can merge and compare them
- Determining users’ geolocation so you can build reports by country and region
- Detecting bot activities to clean your reports of outdated data
- Eliminating data inconsistencies and inaccuracies
- Converting all data into a single format (dates, currencies, etc.)
- Formatting data into tables according to the schema of the target data store
- Conducting deduplication to eliminate redundant data
- Removing unused data and flagging anomalies
- If necessary, merging data from two values into one or, conversely, splitting data from one value into two
- Conducting data quality audits and compliance checks
As a result of these data manipulations, you get accurate structured data as the output: unified tag formats, a single currency, de-doubled data, etc.
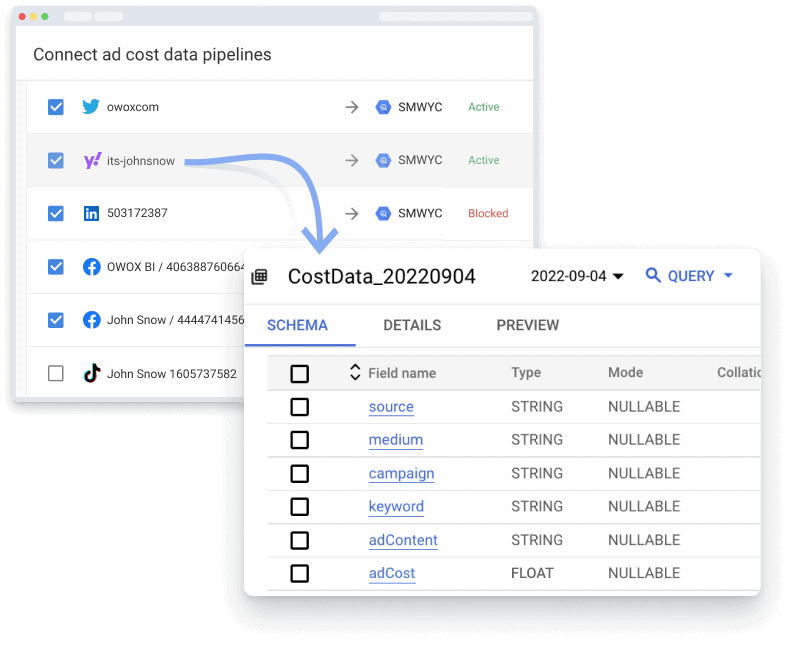
Prepare your cost data into GA4-ready format (no SQL skills required)
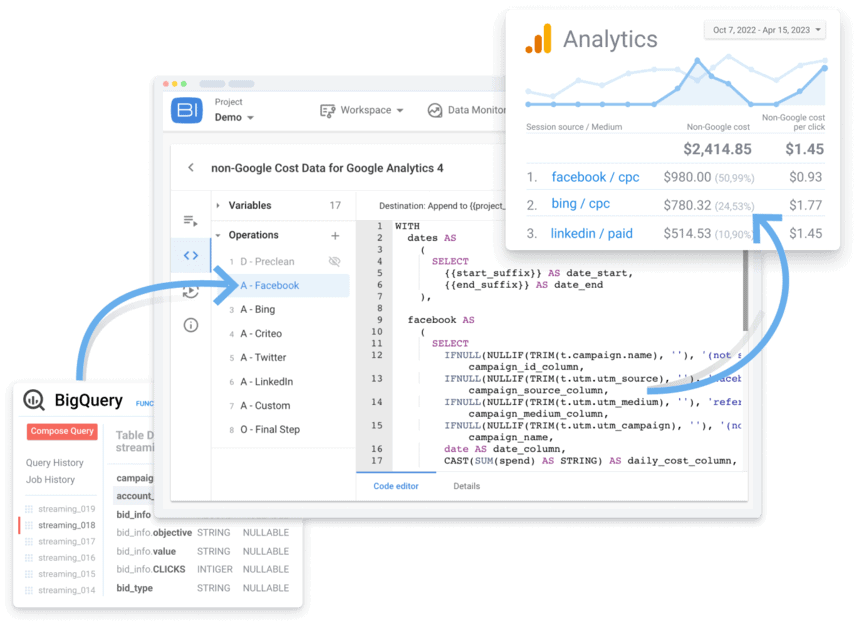
With OWOX BI you can automatically merge your advertising cost data from different platforms and upload to GA4, so you can analyze your return on ad spend (ROAS) and acquisition cost to make fully-informed marketing decisions.
The challenge is that the data format of advertising services is different from GA4. OWOX BI provides an easy solution by seamlessly importing cost data from Facebook Ads, Bing Ads, Twitter Ads, and other advertising services to Google BigQuery with our easy-to-setup pipelines.
Transforming your cost data from advertising platforms is a breeze with OWOX BI. You don't need to have any coding or SQL skills to normalize and transform your data. With our ready-to-use transformation templates you can get all of your data available for GA4 import in just a few moments.
2. Preparing business-ready data
The challenge
As we said above, in order to build reports, data from different sources must be correctly merged. For example, user actions need to be combined into sessions in order to connect conversions to advertising campaigns. Costs from different sources should be combined into a single structure so the effectiveness of these sources can be compared.
Studying data compatibility from different sources takes a lot of time. In addition, data merging must happen regularly as the source data is updated, and an analyst should be able to flexibly manage the business logic in accordance with business requirements.
To prepare a reporting system, an analyst needs to create and maintain a whole cascade of interconnected SQL data transformations. Over time, in any project, this turns into a tangle of SQL queries and scripts, the debugging of which takes a lot of time and does not add new value.
What is bad about it?
Data preparation is a process. It’s not enough to prepare a report (or even a lot of reports). Data must be updated regularly, and changes to reports are made permanently. All this is now done manually by analysts, which takes a lot of time, as well as with the help of SQL queries and scripts.
If you build reports on raw, non-business-ready data, you may encounter lots of recurring problems: searching for errors and causes of discrepancies takes a lot of time, and business logic needs to be constantly duplicated in all SQL queries.
What does the report-building process look like for raw data?
First, a marketer tells an analyst what should be done. Then the analyst writes SQL queries and builds a dashboard based on their results. As usual, some discrepancies are found, some new conditions are added to requests, a couple of iterations are made, feedback is received. But all decisions are made in the context of this one report. When you need another report with data from other sources, new columns, or several slices of data, the process of checking data convergence and validation will need to be repeated. Or an analyst can build 10 reports, in which the number of clients, for example, differs because different calculation logic was applied. With data transformation and modeling, this task is solved before the report is built.
How OWOX solves these issues
OWOX BI Transformation automatically applies the basic transformations everyone needs, such as sessionization and merging cost data. Plus, you can easily make and apply your own (custom) transformations.
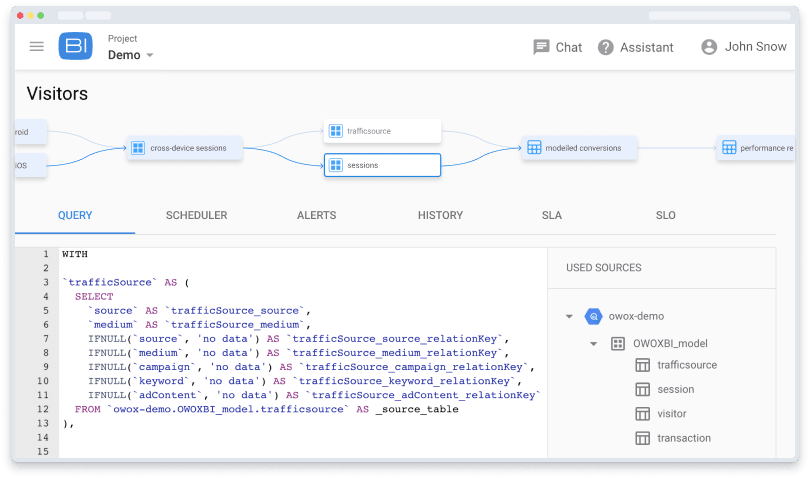
OWOX BI provides you with data that’s ready for analysis, saving hours on data preparation.
1. Automatically merge session hits
The OWOX BI algorithm automatically merges hits in sessions without resorting to the Google Analytics logic of session formation. You’ll get ready-to-use automatically updated session tables in a convenient structure without the need to write complex data transformations.
2. Cost data blending across channels
To convert ad costs, analysts have to upload data from the ad account to separate files and then manually upload it through the BigQuery interface. The disadvantages of this method are obvious — a lot of unnecessary work and no automation.
You can also write your own scripts that will download the information you need from the marketing service. But the work of this solution must be constantly monitored and maintained. In this case, you will spend developer resources to merge data from different accounts and for different dates, check its quality, and respond quickly to possible changes in the advertising service APIs. If this is not done, poor quality data can lead to poor decisions that are costly to the business.
OWOX BI works smoothly with large ad accounts and uploads all data regardless of the number of campaigns. It collects all cost data in an automatically updated, unified, and user-friendly table without unnecessary fields.
Besides automatically importing cost data, OWOX BI recognizes dynamic parameters in UTM tags, converts costs into one currency, updates data in Google BigQuery retroactively if it changes in the advertising service, and monitors data relevance.
3. Single cross-device user profiles
All data about user behavior from your site as well as from various devices and applications is merged into a single profile. You’ll get a complete picture of each user’s behavior to analyze the quality of advertising campaigns.
4. User type (new or returning)
OWOX BI defines user type (new or returning) so you can build reports on different user cohorts.
5. Ad costs attributed to each session
OWOX BI attributes cost data at the session level. You’re no longer limited to evaluating marketing effectiveness within the scope of an advertising campaign and can correctly calculate unit economics. Evaluate the effectiveness of advertising for different cohorts, regions, landing pages, and product groups.
6. Attribution modeling
In OWOX BI, you can connect any standard attribution model to your reporting, set up a data-driven attribution model based on OWOX conversion forecasting, or set up a custom model to fit your rules and your sales funnel. All this can be easily done in the product interface without the help of data engineers.
With OWOX BI data transformations, you have wide opportunities to measure the impact of campaigns on conversions:
- Choose any industry-recognized attribution model (last-click, fist-click, U-shape) from predefined templates
- Use the algorithmic Funnel Based attribution model
- Create your own custom models
- Build reports based on different attribution models to compare results
7. Modeled Conversion
Use Modeled Conversion for cookieless measurement and conversion predictions.
To comply with GDPR requirements, the site owner must refuse to identify users who do not want to share their cookies and do not click the magic “Accept Cookies” button. As a result, Consent mode reduces the number of conversions for which a traffic source can be determined by 30%.
Conversion modeling helps solve this problem. First, machine learning systems process the available data and historical statistics. Then, knowing what percentage of users allowed cookies to be set and how those users converted, they determine the most likely attribution path for those who did not. This allows you to more accurately match campaign results to campaign costs — and at the same time comply with user decisions regarding cookies.
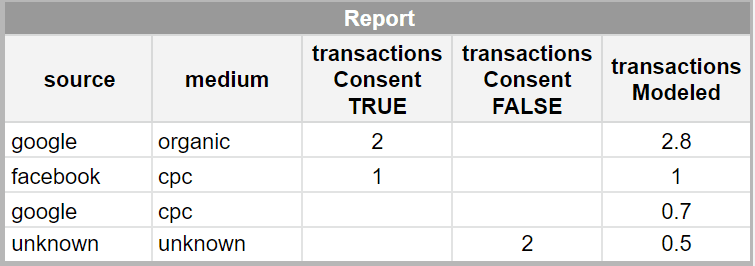
To determine the source for such inconsistent transactions, we use a machine learning model trained on consistent data as well as additional parameters (User-Agent, Geo, Device, and others). Put simply, the model analyzes matched conversions with known sources and proportionately distributes the remaining inconsistent conversions to those sources and mediums that are in the data.
3. Control data processing and transformations
Challenge
No matter how you prepare data for reporting, you will always need to:
- Control the data transformation logic
- Have a clear picture of how data is interrelated
- Quickly identify causes of failure and delays in updating data
What is bad about it?
The more branched the internal data store, the more difficult it is to write any logic that will collect business-ready data — and the more difficult it is for the analyst to manage the data. Without a convenient orchestration tool, analysts rush between a large amount of data, numerous connectors, and various transformations and reports without having a clear picture of how they’re all connected. As a result, searching for and eliminating errors and discrepancies takes a long time.
How OWOX solves these issues
OWOX BI Workspace allows you to manage the data flow in an analysis-friendly UI. We’ve simplified the whole process to offer analysts a completely new way of working with data. Analysts can go all the way from obtaining raw data to visualizing it on their own within the same product.
- Track how data moves and changes from connectors to dashboards
- Set and control data transformation and metrics calculation logic in each report
- Manage SQL transformations in a few clicks
- Schedule data updates to keep data fresh
- Immediately see any error or delay in updating data
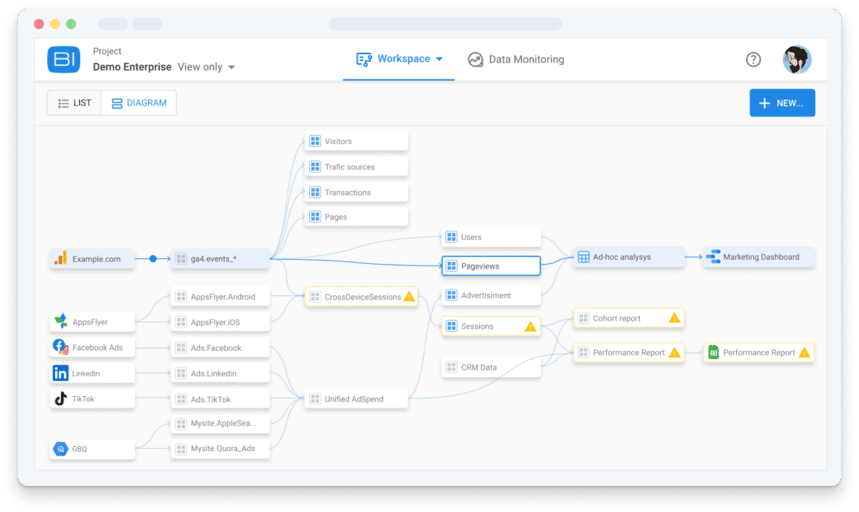
Our product is not a closed box that produces incomprehensible results. You get a clear graph of transformations that clearly shows how your data is moving, where, and why. It’s easy to see and influence the calculation logic. You will not only see the result: you will understand how it came about.
4. Lack of data engineers
Challenge
There are certain things that analysts can’t do on their own, such as defining the attribution model, connecting new data sources, and making difficult data transformations. For these tasks, a data engineer is required.
What is bad about it?
Customizing and maintaining custom transformation orchestration tools like Airflow or dbt requires data engineers — a scarce resource. The use of such tools is convenient for developers but not for analysts. You can read more about this in the benn.substack article.
This is why analysts often have to wait for help, and data engineers often get distracted from their main tasks. All this slows down the time to insights, preventing business users from making data-based decisions in time.
How OWOX solves these issues
OWOX offers a completely new, more efficient way to work with data, in which the analyst becomes a self-sufficient and highly effective business unit. The analyst gets control over the entire flow of working with data and can realize their talents in analysis instead of getting bogged down on routine tasks.
With OWOX, you get accurate business-ready data in an SQL-ready format to easily explore insights, saving critical time for engineers and analysts. You don’t need a data engineer, as OWOX does everything automatically.

Conclusion
On the way to a business-ready format, there’s a lot of work to be done with data. Besides, data for reporting should be updated regularly. In order not to waste analysts’ time on these routine tasks, it’s best to automate the entire process of working with data with the help of OWOX BI and free up your analysts’ time for analyzing data and searching for insights.

