There are many articles on the web that can help you monitor the behavior of website visitors with popular analytics solutions, such as OWOX BI, Google Analytics, and Adobe Analytics. Understanding digital marketing strategies is crucial for monitoring visitors and analyzing traffic data.

Additionally, analyzing competitor website traffic data is important for gaining market insights and enhancing traffic generation strategies. Our blog is no exception. For example, you can read more here about setting up Google Analytics 4.
Now, let’s dive deep into how you can analyze the information you get by your digital traffic using these web analytics tools. Read on, and you will know the difference between a Digital Analyst and a Data Scientist, and what tasks can be solved through statistical methods.
Note: This post was originally published in December 2017 and was completely updated in August 2024 for accuracy and comprehensiveness on Web Analytics.
Why You Need Web Analytics Metrics and Website Statistics
How can you use the information you get from your website? The first and simplest thing is to learn more about your traffic: where it comes from, the number of visits, clicks, and so on. Organic search traffic is a key indicator of the website's performance. Search engines play a crucial role in organic traffic growth, so it's critical to monitor performance across various platforms.
Standard Google Analytics reports are enough for this task. However, Google Analytics alone is not the best fit for calculating relative Web analytics metrics lists (ROAS, CPC, etc.). You can’t really focus on metrics without considering the specifics of individual advertising channels, external factors, and running tests.
Statistical methods can help meet many objectives and business challenges, including:
- Classify your users and manage to advertise more efficiently.
- Evaluate the effect website redesign has on business performance. For example, A/B testing can be used to see how reducing the number of fields in a checkout form affects conversion rates.
- Evaluate the effect of an increase or decrease of a certain Web metric has on business by having determined the permissible values for the main performance indicators.
- Predict the behavior of website users by different indicators. Identify your potential buyers and run targeted advertising campaigns.
Three Main Phases of Data Analysis
Roughly speaking, the whole process of data analysis can be divided into three main phases:
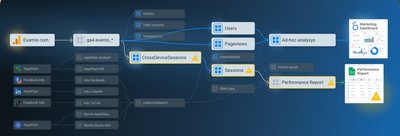
Phase 1: Digital analytics - collecting and analyzing data
This phase mainly includes a superficial analysis of user interactions with the website and an evaluation of advertising performance. For example, Digital Analysts can identify the most popular web pages and product categories and discover very weak spots in website functionality.
Phase 2: Data governance - managing the data
This phase includes coordinating responsibilities among different company departments and managing access to the data.
Phase 3: Data science - data processing and management
This phase includes a deeper analysis of the collected data: website user behavior, offline transactions, purchases made over the phone, and data from CRM systems. Data scientists can assess the impact of a particular factor (acquisition source, location, day of the week, etc.) on the observed results, such as conversion rates, and predict future outcomes.
Streamline Your Marketing Data in One Place
Connect, manage, and visualize all your marketing data easily with OWOX BI. Say goodbye to manual reports and hello to instant insights

The Difference Between a Digital Analyst and a Data Scientist
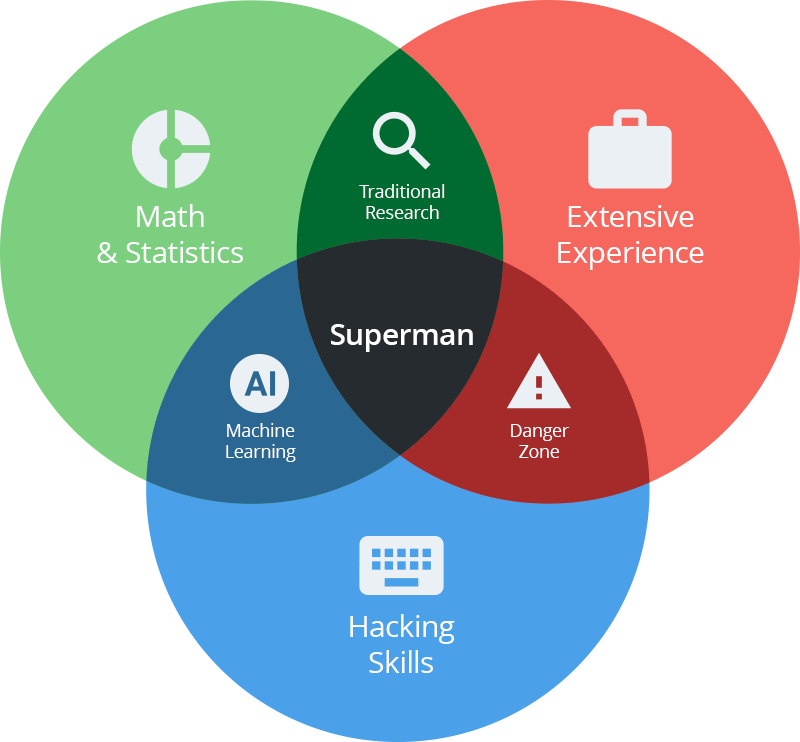
Digital analytics is, in fact, the first step towards Data Science. Data science is widely used in various fields: analytics, biology, medicine, psychology, political science, etc. Regardless of the field, any Data Scientist should:
- Be familiar with the subject area and know how to analyze the available information.
- Be able to work with large amounts of data (have competence in such programming languages as R and Python, know how to apply machine learning).
- I have a good understanding of statistical analysis methods (and some math background).
If you try to sketch these requirements schematically, you’ll get a picture like this one, with a Data Scientist in the very center:
To better grasp the difference between a Digital Analyst and a Data Scientist, let’s take a look at one particular example. Let’s say the revenue generated by monthly unique visitors to the website decreased by 3%, as compared to the average value for the previous week.
Digital Analysts would be able to:
- Point towards the source that generated significantly less traffic than before.
- Tell the time when the traffic began decreasing.
- Calculate the exact percentage of the traffic drop for different traffic sources.
- Analyze keyword rankings using tools like Google Search Console and SEMrush to optimize content and improve search engine positions.
Data Scientists in the other hand:
- Will consider the situation from a different perspective, using mathematical statistics methods
- Start by checking whether the obtained revenue values are outside the range of admissible values for this indicator (the so-called confidence interval) and whether this change is to be considered critical.
- Perhaps no instant action should be taken if, for example, the revenue for the day was less than on the same day in the last week but isn’t less than the average value for the month.
In general, Data Science includes performing the following tasks:
- Manage risks, that is, recommend management decisions to reduce the likelihood of poor outcomes and minimize possible business losses.
- Make forecasts for any indicators that are important for business. You can do this using the Box-Jenkins approach. Thanks to these forecasts, you can plan purchases, pricing, advertising campaigns and promotions. For example, to forecast sales for particular products over the given period of time.
- Classify users for different purposes, such as targeting, using logistic regression, probit regression, or an ROC curve.
Therefore, Data scientists are the innovators in the data realm, leveraging advanced techniques like machine learning and statistical modeling to tackle complex problems and predict future trends.
Their work is research-oriented, focusing on developing new algorithms and models to extract deep insights from data. They operate on a level that involves exploring and pushing the boundaries of data’s potential, often working with big data technologies.
Data analysts, in contrast, concentrate on extracting actionable insights from structured data to support decision-making. They specialize in analyzing data, creating reports, and visualizations to make complex information accessible to non-technical stakeholders.
While their work doesn’t typically involve the advanced modeling of data scientists, it’s crucial for operational and business intelligence tasks, helping organizations to interpret data and apply it in strategic contexts.
Automate your digital marketing reporting
Manage and analyze all your data in one place! Access fresh & reliable data with OWOX BI — an all-in-one reporting and analytics tool
Key Statistical Methods for Web Analytics
Implementing Web traffic analytics often involves the collection, reporting, and analysis of website data to understand and optimize web usage. Web analytics tools are essential resources for measuring and understanding website performance, providing valuable website statistics and insights.
Statistical methods play a crucial role in web analytics by helping to uncover patterns, trends, and insights from web data. Here are some key statistical methods used in web analytics, with examples of how they can be applied:
1. Regression Analysis
Regression analysis is a statistical method used to determine the relationship between a dependent variable and one or more independent variables. It helps in predicting the impact of changes in independent variables on the dependent variable.
Application in Web Analytics: In web analytics, regression analysis can be used to predict the impact of various factors on website traffic or conversion rates. For example, a regression model can help determine how changes in advertising spend, social media activity, or website design changes are likely to affect the number of visitors or conversions on a website.
Measuring how much traffic is to landing pages is crucial, and regression analysis can help optimize their performance by understanding the effectiveness of these pages in conjunction with other marketing assets.
Example about Predicting Sales: A regression model could analyze how website traffic, average time spent on the site, and the number of pages visited influence online sales. This can help in optimizing the website layout and content to maximize sales.
2. Hypothesis Testing
Hypothesis testing is a statistical method used to make decisions about the properties of a population based on sample data. It involves setting up a null hypothesis (no effect) and an alternative hypothesis (some effect), then using statistical tests to determine which hypothesis is supported by the data.
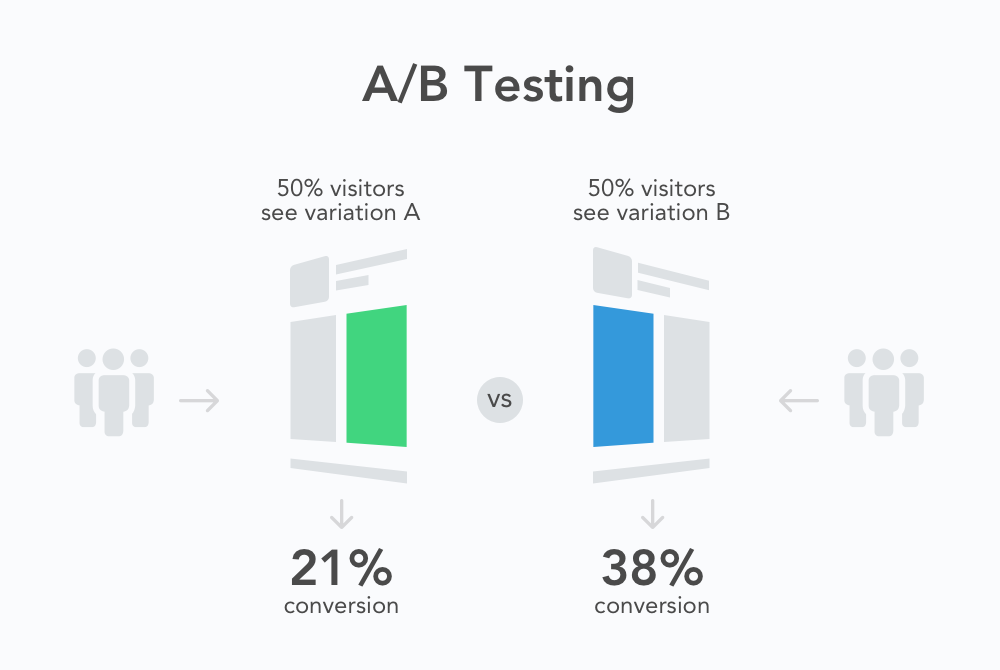
Application in Web Analytics: Hypothesis testing is commonly used in A/B testing of website analytics, where two versions of a web page (A and B) are compared to see which one performs better in terms of specific Web analytics metrics lists, such as conversion rate or click-through rate. Tracking unique visitors is crucial in A/B testing to understand site engagement and visitor behavior.
Example about A/B Testing for Conversion Optimization: An e-commerce site might test two different checkout page designs to see which one results in a higher conversion rate. Hypothesis testing can statistically determine if the observed difference in conversion rates between the two versions is significant or due to random chance.
3. Clustering
Clustering is a method of unsupervised learning that involves grouping a set of objects in such a way that objects in the same group (called a cluster) are more similar to each other than to those in other groups.
Application in Web Analytics: Clustering can be used to segment website visitors based on their behavior, preferences, or demographics to provide more personalized content or guidance. Understanding site visitors through clustering helps improve user experience and optimize business objectives by analyzing where they come from and how they engage with content.
Example about Customer Segmentation: By clustering visitors based on their browsing behavior, purchase history, and engagement levels, a business can identify distinct segments of the target audience, such as "frequent buyers" or "window shoppers." This information can then be used to tailor marketing strategies and website content to each segment, improving engagement and conversion rates.
4. Time Series Analysis
Time series analysis involves analyzing data points collected or recorded at specific time intervals to identify trends, cycles, or seasonal variations in the data.
Application in Web Analytics: Time series analysis can be used to analyze web traffic, sales, or other metrics over time to identify trends, seasonal patterns, or the impact of specific events or campaigns. Incorporating monthly traffic estimates into this analysis is crucial for understanding web traffic trends and making informed decisions to improve website strategy.
Example about Analyzing Seasonal Trends: By applying time series analysis to website traffic data, a retailer could identify seasonal trends in visitor behavior, such as increased referral traffic during the holiday season. This insight can help in planning marketing campaigns and stock inventory accordingly.
These statistical methods, when applied to web analytics and traffic analysis, can provide deep insights into behavior of users, preferences, and the effectiveness of different web strategies, enabling data-driven decision-making to optimize web presence and performance.
Now, let’s take a closer look at a couple of tasks that can be solved using statistical methods.
Uncover in-depth insights
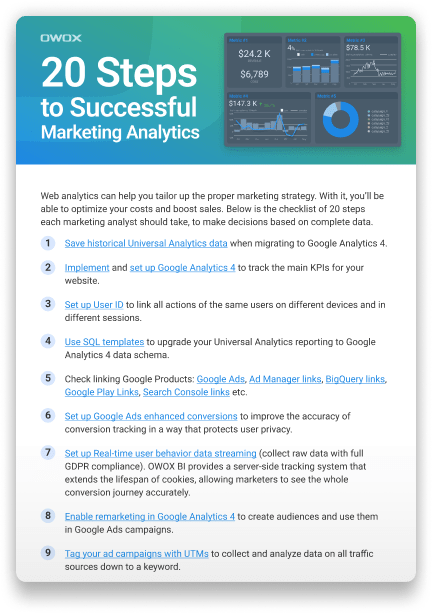
20 Steps to Successful Marketing Analytics
Download nowBonus for readers
How to Apply Statistical Methods in A/B Testing
A/B testing is probably one of the most common tasks in web analytics. The results of testing must be validated in order to make sure that you can rely on them. This is where statistics come to an aid. When conducting A/B tests, it’s worth considering such concepts as statistical power, sample size, confidence interval, and statistical significance. Now, let’s look at a few examples of what these concepts mean and how to apply them.
Statistical power is measured in percentages and determines how likely the test is to show the difference between the two options in consideration. Let’s say you want to test the hypothesis that men prefer green to red.
If you show two different buttons to two different men, and one click on the red one while the other picks the green one, can you say that your hypothesis is refuted? Of course not. One of the two men could possibly be colorblind or simply a fan of bright colors.
However, if you show those buttons to a thousand men who visit your own website alone, you’ll be able to identify which button is more likely to be clicked. That is, the larger the sample, the greater its statistical power. Relying on tests whose statistical power is less than 80% is not recommended.
What should the sample be in order to provide reliable results? It depends on what statistical power and significance (we’re writing about them below) you expect from the test. Fortunately, you don’t have to calculate sample size manually, as there are convenient online calculators like this one.
Another aspect to consider in A/B testing is statistical significance. It determines the likelihood that a result from testing doesn’t occur by chance. The optimal level of significance (also called confidence) in A/B testing is 95%. That is, the probability of error (the so-called P-value) is the remaining 5%. The statistical significance of the test depends on the confidence intervals and the area of their intersection.
Confidence intervals tell you how stable the results of the test are. In other words, the results will be the same if you increase the size of the sample. Let’s say a green button (variant A) was shown to a thousand website visitors, and 30% of them clicked on it.
Then, you can calculate the margin of error (you can do this online), which is equal to ± 2.8%. This means that if you increase the size of the sample, there’s a 95% probability that 27.2% to 32.8% of the new visitors will click on the green button. Another 1000 visitors were shown a red button (variant B), and 26% of them clicked on it. The confidence interval for this group is 23. 3% to 28.7%.
If we compare the confidence intervals for variants A and B, we’ll see that they intersect in the range of 27.2% to 28.7%. The graphical presentation of the comparison looks as follows:
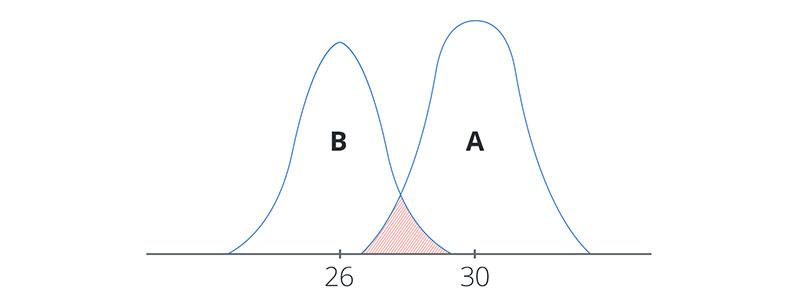
The KPI (in our example, it’s conversion rate) goes on the X-axis, and probability density (the density of a random variable) goes on the Y-axis. The smaller the intersection area of the confidence intervals, the higher the reliability of the test results. In our example, this intersection is 1.5%. This figure does not exceed the P-value of 5%, therefore the test can be trusted.
There are a number of statistical criteria you can apply to decide whether to accept the hypothesis. One of the most well-known and widely used criteria is the t-test, also known as the Student’s test. In fact, the t-test is any statistical hypothesis test in which the test statistic follows the Student’s t-distribution. Here’s a calculator you can use to calculate the t-criteria and validate the test. Just copy the document and fill in the green cells with the values you got as a result of testing.
Rejoice, geeks, we’ve got some formulas for you :)
To start with, the t-test can only be applied under the following conditions:
- The source data should be normally distributed.
- If a two-sample t-test is used for independent samples, the variances should be equal.
A two-sample t-test for independent samples
If there’s little difference in sample sizes, a simplified formula can be applied for approximate calculations:
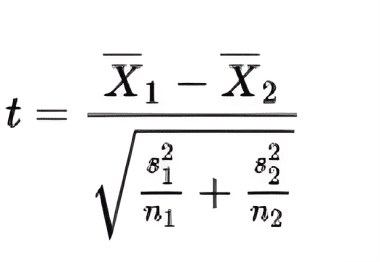
Where X1 and X2 are random variables, n1 and n2 are the number of elements in a sample, and
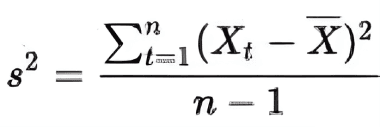
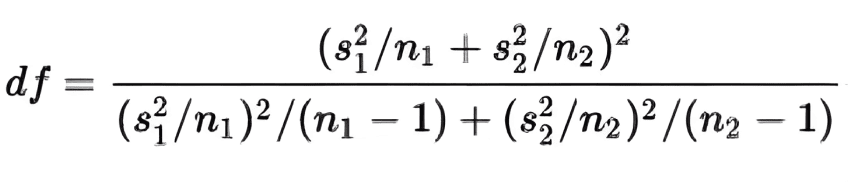
The number of degrees of freedom is calculated as follows:
The t-test approach has the following advantages:
- It works reliably with huge samples, as there’s no limit to the data volume.
- It takes account of the distribution and size of the sample.
- It’s suitable for measuring different parameters, and quantitative indicators can be compared as well.
So, You Want to Become a Data Scientist. Where to Begin?
Here, we made a compilation of useful resources to help you on your journey to becoming a Data Scientist.
There are lots of free online courses on the Internet that provide lectures and presentations in data science. These lectures are usually followed with tasks and topics for self-study. If something doesn’t work out, you can always ask your teacher a question at the forum. In addition, there’s a possibility of getting certificates, usually for a fee. Here are a few websites worth visiting:
The R programming language is the most popular tool for working with big data. Here are a few resources that will help you learn the language and chat with professionals:
Another goodie - online games on probability theory and mathematical statistics:
- Probability
- Statistics
To excel in data science, it's essential to cultivate a blend of technical skills – such as proficiency in Python, data mining, visualization, analysis, and a deep understanding of machine learning, deep learning, and natural language processing – alongside vital soft skills like an analytical mindset, business acumen, critical thinking, adaptability, collaboration, problem-solving, effective communication, and patience.
Achieving certifications and engaging in personal projects can showcase these competencies, making you a well-rounded and valuable asset in the data science field.
We promised you a couple of examples of how you can use statistical methods, and the blog post only accommodated A/B testing. Enter your email, and we’ll send you an example of how you can classify your users. You’ll be able to identify user segments with the most traffic stats, highest and the lowest LTV, and use various marketing strategies for these segments.
Measure CPO and ROAS in GA4
Automatically link your Ad Platforms cost data to Google Analytics 4 conversion data, so you can analyze your marketing KPIs and make fully informed decisions

Web Analytics Best Practices
Web analytics is crucial for understanding website performance, checking traffic and user behavior, and improving online strategies. Here’s how data scientists can leverage these practices to drive value:
- Define Clear Objectives and KPIs with Data Science in Mind: Data scientists should work closely with business stakeholders to define clear objectives and identify Key Performance Indicators (KPIs) that are measurable and directly tied to business outcomes. Advanced statistical methods and machine learning models can then be applied to predict and track these KPIs over time.
- Select and Implement Web Analytics Tools with Advanced Capabilities: Data scientists need robust web analytics tools that can handle not just basic tracking, but also complex data analysis. Tools that offer APIs for data extraction and integration with data science environments (like Python or R) are particularly valuable. This allows for more sophisticated analysis, including predictive modeling and machine learning.
- Segmentation Through a Data Science Lens: Data scientists can apply clustering algorithms and other unsupervised learning techniques to segment users more effectively. This can reveal hidden patterns in behavior that are not apparent through basic segmentation, enabling more personalized and effective targeting strategies.
- Enhanced Conversion Tracking with Predictive Analytics: Beyond tracking conversions, data scientists can use predictive analytics to identify potential conversion opportunities or to forecast future conversion rates under different scenarios. This involves building models that factor in a wide range of variables, including user behavior data, to predict outcomes with a high degree of accuracy.
- Deep Dive into Traffic Source Analysis: By applying network analysis and other data science techniques, data scientists can uncover deeper insights into how different traffic sources contribute to behavior and conversions. This can help optimize marketing spending and Web Analytics strategy.
- Advanced User Behavior Analysis: Utilizing machine learning algorithms, data scientists can analyze behavior on a website in much more depth. Techniques like sequence analysis can help understand the paths users take through a site, identifying friction points and opportunities for optimization.
- Automated Reporting and Real-Time Analysis: Data scientists can automate the generation of custom reports and dashboards that provide real-time insights into web analytics KPIs. This can include the use of natural language processing (NLP) to highlight key trends and anomalies in the data automatically.
- Mobile Optimization Through Data Science: Analyzing mobile user data with machine learning can help identify unique patterns and preferences of mobile users. This can inform more effective mobile optimization strategies, improving user experience and engagement.
- Ensuring Privacy and Compliance with Data Science Methods: Data scientists can apply techniques like differential privacy to analyze user data while ensuring individual privacy is maintained. This is crucial for compliance with regulations like GDPR and CCPA.
- Continuous Experimentation and A/B Testing: Data scientists play a key role in designing and analyzing A/B tests, using statistical methods to ensure results are significant and actionable. This iterative process of testing and learning is essential for continuous improvement.
- Data Integration for a 360-Degree View: Integrating web analytics data with other data sources (CRM, social media, etc.) requires sophisticated data engineering and analysis techniques. Data scientists can use this integrated data to build comprehensive models of customer behavior and preferences.
- Leveraging AI for Predictive Insights: Advanced AI and machine learning techniques can be used to predict future trends, identify anomalies, and automate insights generation. This allows businesses to be proactive rather than reactive in their strategies.
- Focus on search engine optimization to enhance online visibility and capture more traffic from search engines: Emphasizing the role of search engine optimization can significantly boost a website's visibility on search engines like Google, leading to increased traffic and potential business success.
By applying these web analytics best practices through a data science lens, organizations can unlock deeper insights, predict future trends, and make data-driven decisions that significantly improve website performance and user experience.
Track Ad Costs and Conversions in GA4
Easily link ad spend to GA4 conversion data to see your true marketing ROI. Get accurate KPIs and make better business decisions
FAQ
-
Can statisticians become data scientists?
Yes, statisticians can become data scientists. Their strong foundation in statistical theory, data analysis, and mathematical skills provides an excellent basis for transitioning into data science, where these skills are crucial for data modeling, prediction, and decision-making processes.
-
Can data analysts become data scientists?
Individuals in data analytics can transition to data science roles. The analytical skills, understanding of data patterns, and experience with data processing tools form a solid foundation. Additional skills in machine learning, programming, and big data technologies are essential for the transition.
-
Do you need to know statistics to be a data scientist?
Yes, knowledge of statistics is fundamental for data scientists. It is essential for designing experiments, making inferences from data, building predictive models, and validating results. Understanding statistical methods underpins the ability to extract insights and make informed decisions from data.
-
Should I be a statistician or data scientist?
Choosing between being a statistician or a data scientist depends on your interests and career goals. If you prefer theoretical aspects of data analysis, statistical models, and research, a statistician role is ideal. If you're drawn to applying data insights to solve real-world problems using a broader set of tools, including machine learning and big data technologies, consider data science.
-
How do I start statistics for data science?
Begin with foundational concepts such as probability, distributions, hypothesis testing, and regression analysis. Online courses, textbooks, and tutorials specifically designed for data science are excellent resources. Practical application through projects using statistical software or programming languages like Python or R enhances learning.
-
What is website statistic analysis?
Website statistic analysis involves collecting, analyzing, and interpreting data related to website performance. It includes key web analytics metrics like visitor traffic, page views, bounce rates, and conversion rates. This analysis helps understand user behavior, evaluate content effectiveness, and optimize website design for better engagement and performance.