How to Calculate the Cost of Delivery and ROMI considering Purchased Orders
![]() Get in-depth insights
Get in-depth insights
![]() Get in-depth insights
Get in-depth insights
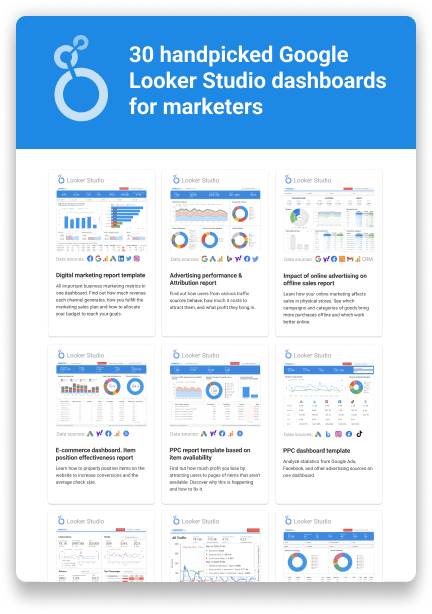
Top 30 Handpicked Google Looker Studio Dashboards for Marketers
The common challenge for retailers is the cost of delivery as sometimes it can be unprofitable. Some of the orders that the company delivers at its own expense aren’t actually purchased by customers at the point of delivery. Therefore, our client decided to calculate how much they were actually spending on delivery and advertising in each region.
In this case, we describe the solution provided by the OWOX BI team for a large fashion retailer in the mid-segment that had challenges with calculating the cost of delivery and ROMI considering purchased orders.
Task
The marketing team wanted to solve two main problems:
- Learn the actual ROMI of advertising campaigns considering purchased orders to more effectively allocate the budget across channels.
- Calculate shipping costs by region to find regions where it’s not profitable for the chain to deliver goods at our own expense and focus marketing efforts on other more promising regions.
Challenge
To attract traffic and increase conversions, many channels are used such as contextual advertising, CPA (TrackAd), email, and others. The advertising costs are calculated using different methodologies and stored in various services. In addition, the retailer offers several shipping options, and in some cases, delivers orders at its own expense. Shipping costs depend on the region and the weight of the purchase. Money is also spent on advertising in various regions, which increases the implementation cost. In order to regularly analyze all the costs of selling goods in different regions, dashboards should be built on actual data, taking into account purchased orders.
When placing an online order, the customers have several payment options: pay on the website, pay in installments, pay when delivered by courier, or pay when picking up the order at a pick-up location. In the latter two cases, customers can try on merchandise and can choose to buy just part of an order. Therefore, the revenue that can be seen from orders created on the website is significantly higher than the actual revenue that is received from purchased orders.
Data on delivered, filled, and purchased orders is also stored in different systems. To understand which products are purchased most often, whether advertising campaigns pay off, and whether delivery to certain regions is profitable, the marketing team needed to compile all our data into one report.
Solution
To set up advanced analytics, we turned to our partner CROC, a B2B integrator that has been working with clients in 42 countries for about 30 years. With the help of OWOX BI, the CROC team managed to collect data from different touchpoints and build dashboards that provided us with the missing information.
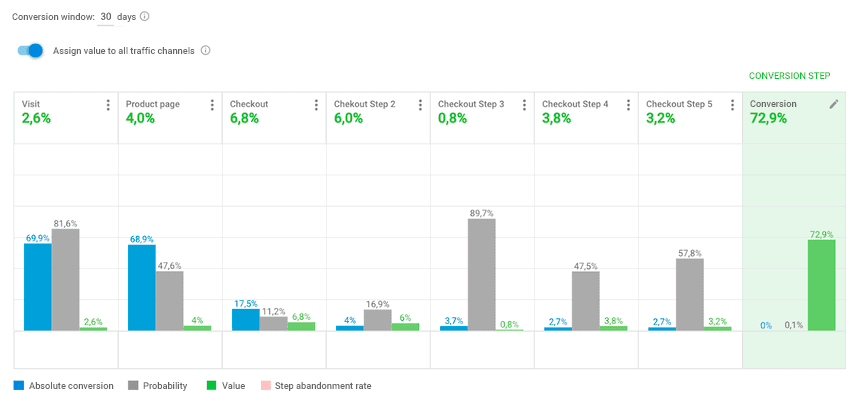
From checkout to purchase can take up to three weeks, so we use a report based on online data to make operational decisions on budget allocation:
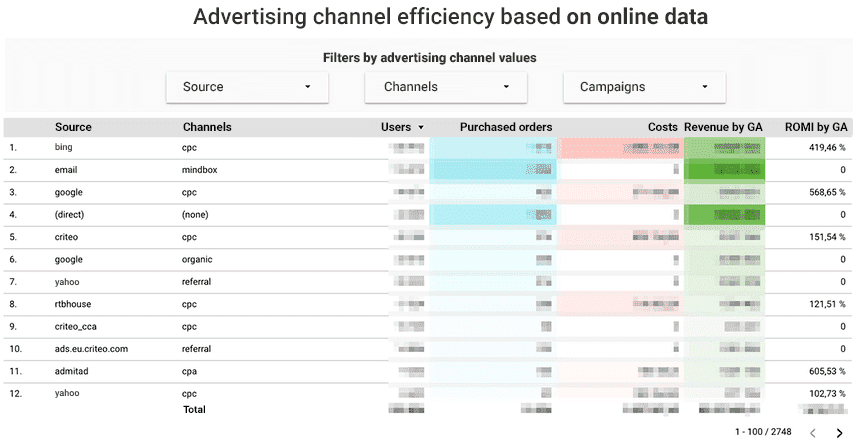
However, not all orders placed on the website are purchased. In fact, this is a problem for most fashion retailers. Roughly speaking, a customer can pick items with a total cost of 500 euros but only buy 150 euros worth of merchandise. A report based on complete data shows the real picture: what percentage of goods are purchased and how much money is brought to us by specific channels.
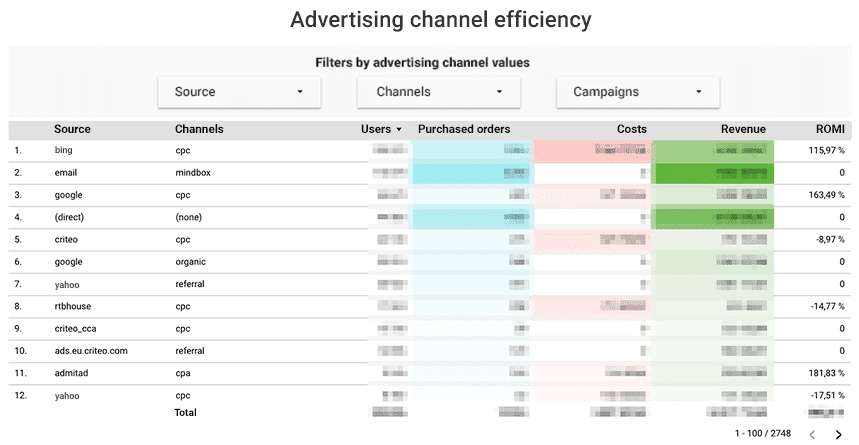
For example, if you look at the ROMI of bing/cpc, then in the first report, we see a figure of 419.46%, and in the second we see 115.97%. The difference is almost 3.5 times.
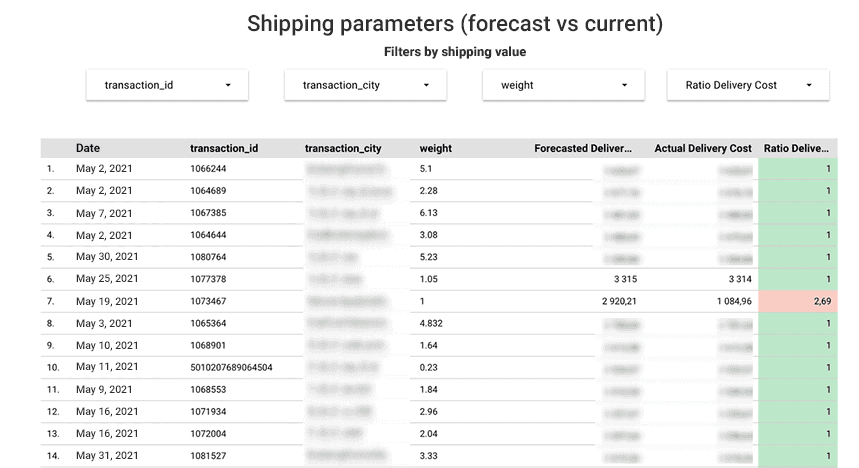
Therefore, at the end of the month, the marketing team looks at the full data report and adjusts the rates for the next month to consider redeemability. The report on delivery parameters helps to determine in which regions there are more orders and cut off unprofitable regions:
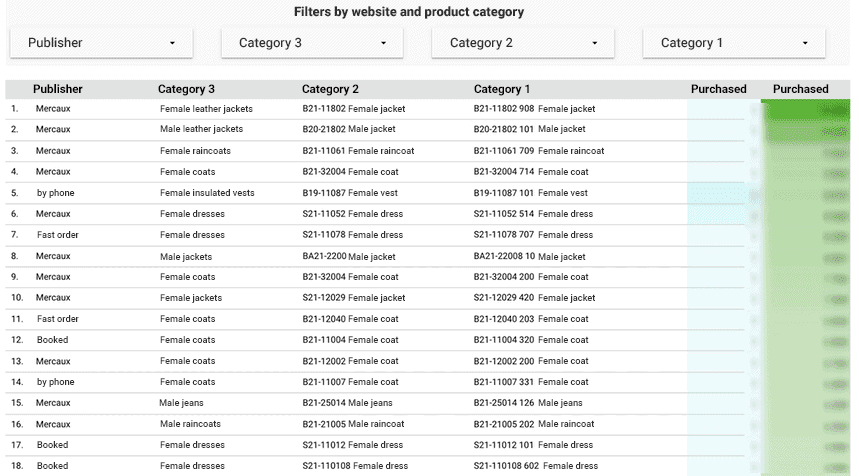
Using a website and category report, marketers analyze which products are best sold on certain websites, which websites should invest more, and which websites take time and don’t bring profit:
Since the retailer has many activities related to emails, it was also needed to understand which campaign works best and encourages the user to complete the purchase. Thanks to the report, which uses data from the marketing automation platform, the marketers see all parts of the funnel from the moment an email was sent to the moment of purchase.
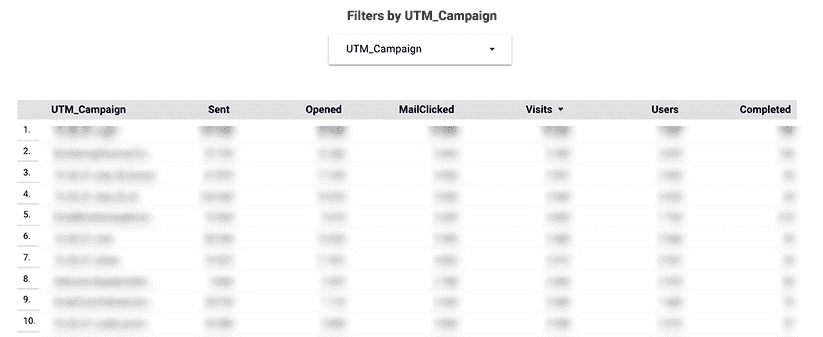
Insights obtained from this report:
- The conversion rate of emails sent before the actual purchase averages 0.2%.
- The largest percentage of conversions are made by customers who receive trigger mailings for product views and abandoned carts.
- Some users can open an email and make a purchase six months after receiving the email.
How data for reports was merged
Step 1. Set up raw data streaming using OWOX BI to simultaneously transfer data from the website to Google BigQuery, avoid data sampling, and build reports with all available parameters.
Step 2. Also with the help of OWOX BI, marketers set up automatic import of cost data from advertising services so data won’t be merged each time manually. This way, cost data is collected in one place and in a single format and is automatically updated regularly.
Data from Facebook and Criteo is transmitted directly to Google BigQuery. Using the Google Analytics → BigQuery (Cost Data) streaming, it was also possible to get CPA cost data uploaded to Google Analytics by a third-party service. The Google Ads cost data is imported into BigQuery using a native integration.
Step 3. Set up the upload of email campaign data using a custom integration by OWOX BI.
Step 4. With the own solution, configure the upload of transaction and delivery data from the internal systems to Google BigQuery.
Here’s a scheme of the data collection and movement:
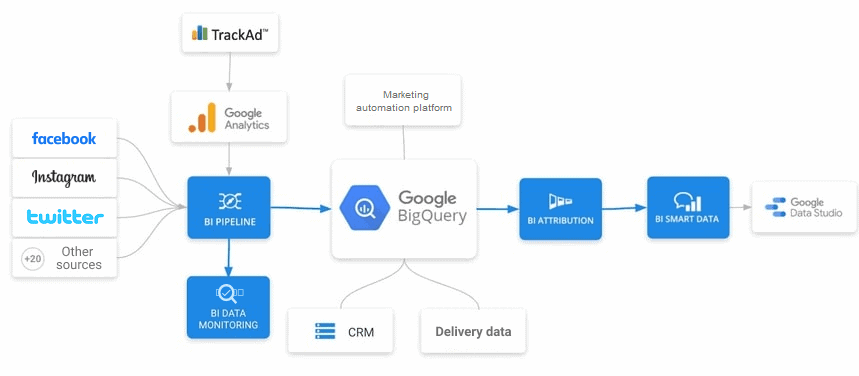
Step 5. Set up OWOX BI attribution based on a funnel with two different conversion steps: placing an order on the website and purchasing the order. The result is two reports on the effectiveness of advertising campaigns: one report only on online data and one on complete data.
Step 6. Several dashboards were built that answered important questions.
Results
As a result of a joint project to configure advanced analytics, the marketing team was able to build reports that helped them answer previously unanswered questions. The calculation of real ROMI, considering purchased orders, allowed them to efficiently distribute their budget among channels. And understanding how much it costs to deliver to each region helped them decide which regions were unprofitable to deliver to at their own expense.
The next step for the marketing team will be to finalize the upload of sales data in offline stores to build ROPO analysis. This will help to clearly track how online activities affect offline sales. Often, a campaign that seems ineffective online leads customers to offline stores.
![]() Get in-depth insights
Get in-depth insights
![]() Get in-depth insights
Get in-depth insights
Top 30 Handpicked Google Looker Studio Dashboards for Marketers