![]() Get in-depth insights
Get in-depth insights
![]() Get in-depth insights
Get in-depth insights
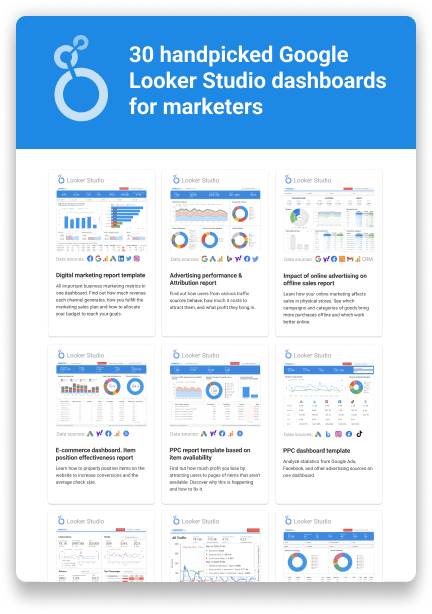
Top 30 Handpicked Google Looker Studio Dashboards for Marketers
Online advertising is often underestimated as many people start looking for goods on the internet and then go and buy them in a physical store. Especially, that’s become a thing for certain products like designer shoes and accessories. Online sales can’t compete with sales in physical shops, where customers have fully personalized service. That’s why marketers want to learn how online marketing affects sales in physical stores and find out which campaigns and categories of goods bring more purchases offline and which bring more online.
In this case, we describe the solution provided by the OWOX BI team for a chain of stores that sell footwear, bags, and accessories at low, mid-range, and high price points. The company has 90 brick-and-mortar shops and a convenient online shop. The main challenge was to identify the online influence on offline purchases.
Goal
The sales department noticed that lots of customers prefer to gather information online before making purchases in a physical shop. On the website, customers filter items by price and check their availability in the chain’s retail shops. In most cases, when customers come to a physical shop, they know pretty well what they’re looking for and have certain expectations about the service.
That’s why the marketers decided to:
- define the influence of online marketing efforts on offline sales;
- reallocate online marketing budgets;
- reevaluate the efficiency of ad channels and improve their marketing strategy.
To reach these goals, it was decided to apply ROPO analysis — based on data about online and offline purchases. With it, you can define the part of offline revenue attributed to online ads (the ROPO effect). See why and how to integrate online and offline customer touchpoints in our article.
Challenge
To perform ROPO analysis, you should merge data for online ads with data on offline sales. The retailer has lots of data about customers, who buy goods in different ways:
- Choosing and paying in a shop.
- Looking on the website and then buying in a shop.
- Looking on the website, paying on the website, and ordering home delivery or delivery to a shop.
Accordingly, this data is collected, saved, and processed in different systems:
- Data on client behavior on the website is stored in Google Analytics.
- Data on order processing and activities of offline visitors is stored in the internal CRM system.
It’s hard to merge all data from these systems manually. The marketers were looking for software that would help them merge this data into Google BigQuery (GBQ), which they already used for storing ad campaign data. Google BigQuery is one of the safest RESTful services, with unlimited data storage and processing potential.
Solution
The retailer’s marketers chose OWOX BI Pipeline to solve their tasks.
OWOX BI Attribution had been already used for evaluating ad campaigns and OWOX BI Pipeline had been used for collecting data from Google Analytics into Google BigQuery to build reports about ad campaigns. For both of these tasks, the retailer was satisfied with OWOX BI, so it was chosen again for ROPO analysis.
OWOX BI analysts designed the following plan:
- Collect data on ad campaigns, customers’ behavior on the website, offline sales, and order processing in one system.
- Connect offline orders with online sessions.
- Build reports and dashboards based on data received to revalue the contribution from online sources.
The data flow looks like this:
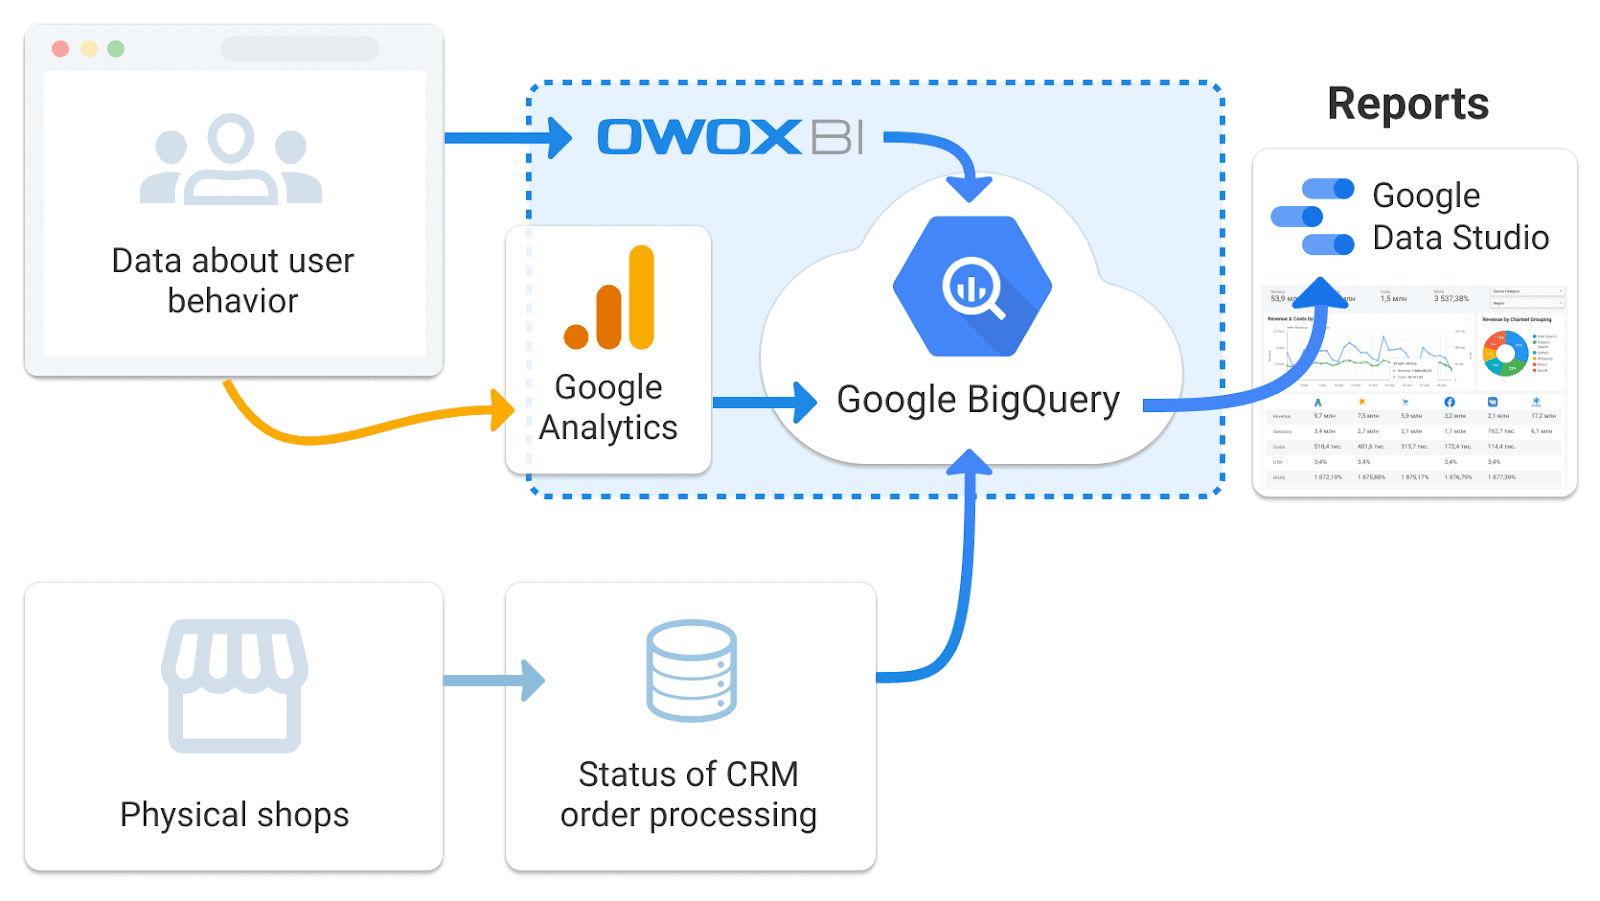
Let’s go through the process step by step.
Step 1. Collect all data in Google BigQuery
Every registered visitor on the website receives a unique user_ID. While performing the conversion goal — completing a transaction — a visitor gets an additional transaction_ID. Data of a visitor’s behavior on the website is transferred to Google BigQuery with these IDs by means of OWOX BI.
Each day, data of online and offline orders from the CRM is also transferred to Google BigQuery and merged with data from the website with the help of the user_ID and transaction_ID keys.
By merging this data, you get what’s needed to perform ROPO analysis.
Step 2. Combine online and offline data
Having combined all the data, OWOX BI analysts began to work with the collected database in Google BigQuery.
The data on online transactions in Google BigQuery was added to the data of each order being processed (paid and unpaid) using the transaction_ID to identify transactions.
Then, the analysts integrated data about sessions of visitors with data about offline purchases using user_ID as the connecting key. This key revealed a history of sessions on the website for many customers who made an offline purchases.
The scheme for merging data looks like this:
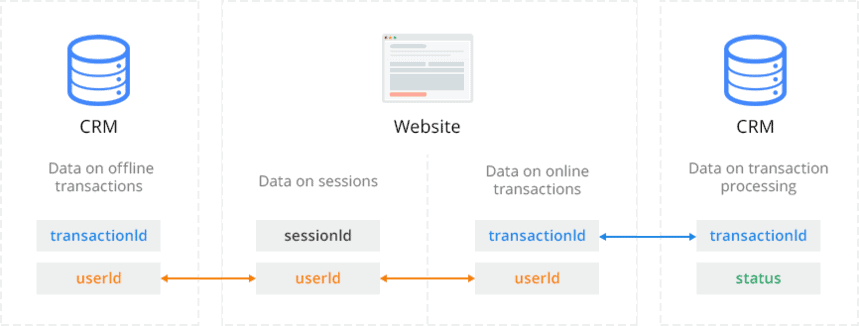
As a result, the retailer’s team got answers to the following questions for each order:
- What type of transaction is it? Online, offline, or ROPO?
- What was the source of the last session before the purchase? What led the client to make a purchase?
- How many days passed between the last session on the website and the purchase? (For those who buy online, this is always zero, as the last visit is the session when the transaction happens. For offline transactions only, this number is always zero too because there’s no online session for this customer. Other customers can be assigned to the ROPO segment.)
- Geolocation of the last session.
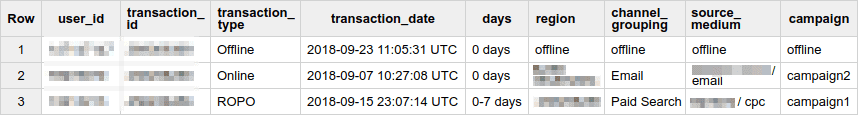
An example of a table with this information:
Step 3. Data visualization
To visualize the received data, Google Data Studio was chosen. OWOX BI analysts created an informative dashboard with dynamic charts in Google Data Studio to support detailed analysis and ad budget planning.
For example, the pie chart on the right shows that ROPO orders account for 20 percent of revenue, and the pie chart on the left shows that almost all customers who made ROPO orders visited the website less than one week before purchasing in a shop.
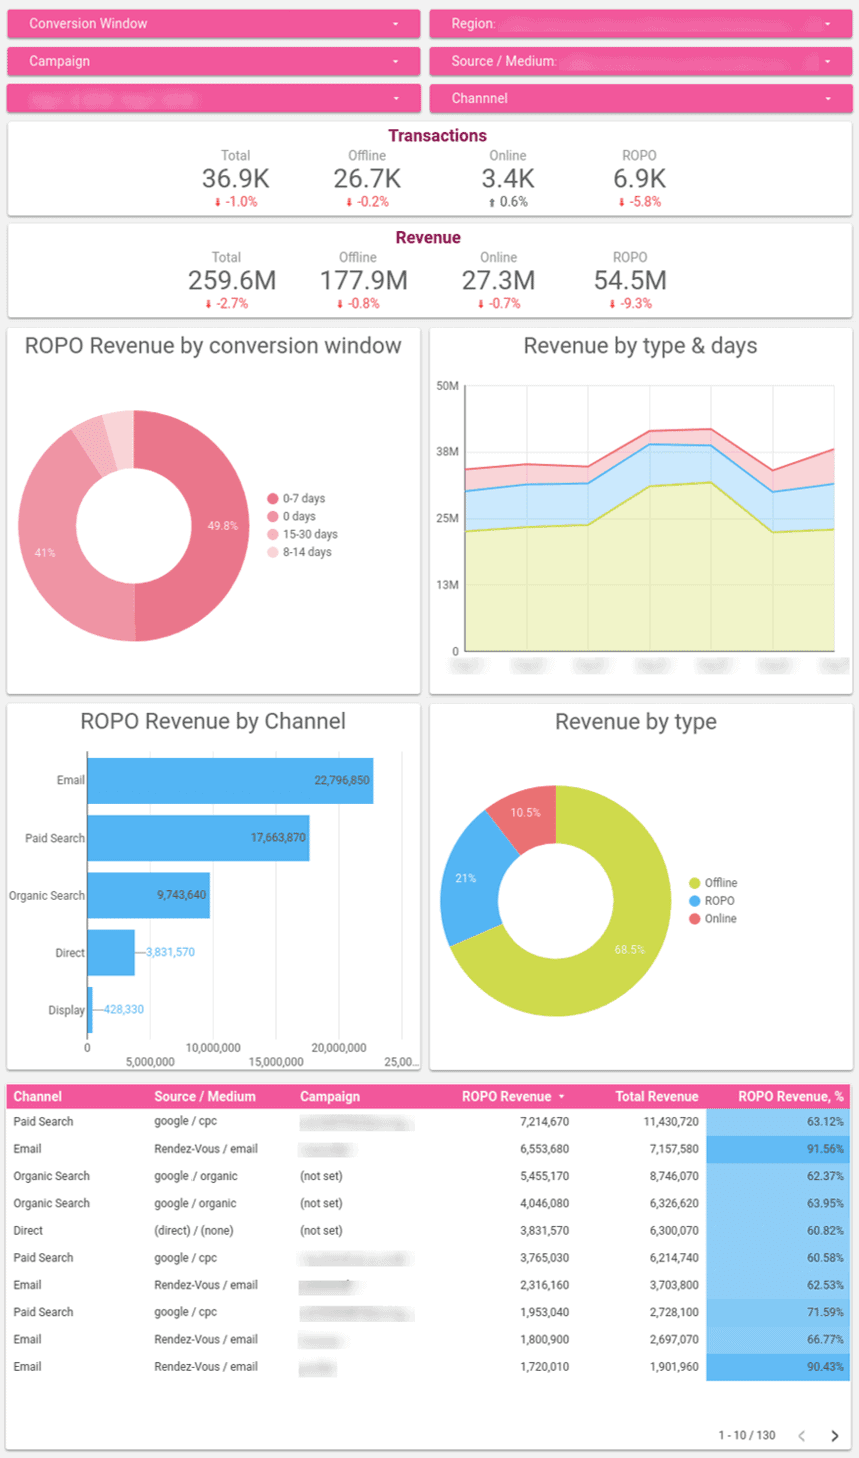
All data on the dashboard can be filtered by region, conversion window, source, channel, and campaign for more detailed segmentation. Additionally, days between the last website visit and the purchase can be seen for each order.
The chart at the bottom of the dashboard helps marketers understand which additional revenue from ROPO orders should be counted while planning the marketing strategy and shows the share of total revenue by source, channel, and campaign.
Results
ROPO analysis confirmed the correlation between online behavior and offline purchases and an informative dashboard that automatically updates data provided these facts:
- 20 percent of offline revenue was attributed to online advertising, meaning that every fifth visitor to an offline shop has already interacted with the website.
- After ROPO attribution of revenue, there appeared clear pieces of evidence of the online campaigns being underrated.
- In the near future, the retailer will review its marketing campaign, taking a new view on the efficiency of ad campaigns and increasing its investment in the digital direction.
![]() Get in-depth insights
Get in-depth insights
![]() Get in-depth insights
Get in-depth insights
Top 30 Handpicked Google Looker Studio Dashboards for Marketers