How to Track Post-view Conversions and Learn the Effectiveness of Video Ads - Case 1+1 Digital
![]() Get in-depth insights
Get in-depth insights
![]() Get in-depth insights
Get in-depth insights
Top 30 Handpicked Google Looker Studio Dashboards for Marketers
If you use video advertising, thanks to the information from the publisher, you surely know how many click-throughs you received. But whether or not these transitions led to conversions is unknown. Also "invisible" is a huge part of the audience who watched the video, didn't press anything, but after some time visited the site and made a purchase. The solution described in our 1+1 Digital case helps you cover these gaps.
About the company
Team 1+1 Digital is responsible for selling special projects and media advertising on web resources. 1+1 Media is one of the largest media holdings in Ukraine. In addition to 6 of its own TV channels, 1+1 Media has the rights to exclusive distribution of 12 other foreign channels and 5 Ukrainian channels. The media group also includes 11 popular web resources and information and news platforms. 1+1 Digital customers can post promotional content on 3,000 1+1 Media partner sites.
The Internet resources of the media group are visited by 10.5 million users per month (according to the GemiusAudience) and the monthly coverage of the Ukrainian Internet audience is 42%.
Unleash Your Ad Insights Now!
Book a demo for smarter ad analytics.
Task
OWOX BI and 1+1 Digital have a common customer - one of the largest multi-channel retailers of consumer appliances and electronics in Ukraine, which actively uses promotional media for advertising, in particular videos.
To evaluate the effectiveness of these movies and learn how they affect micro- and macro-conversions, the client needed to:
- Find out how many people go to the site or offline store after viewing ads.
- Find out how much the company pays for each targeted action of users (purchase, registration) who have moved to the site by clicking on advertising or otherwise. That is, calculate the CPA (price per action) for Post-view and Post-click conversions.
- Calculate the revenue generated by customers who have watched videos, taking into account data from the internal ERP system (redeemed orders, offline purchases).
- Find out which channel was the most effective for returning users to the site after viewing video ads.
- Create a single dashboard for easy analysis of media advertising.
From a technical point of view, the goal of the client was to link all customer actions performed in three scenarios:
- Watching the video without clicking it → Visit the website → Purchase on the website.
- Watching the video without clicking it → Visit the website → Purchase in a physical shop.
- Visit the website → Watch the video without clicking it → Purchase in a physical shop.
Problem
Prior to this case, online store marketers used an audit report from the 1+1 Digital ad publisher to evaluate videos, which contained data on coverage, number of screenings and transitions to the site, and CTR (number of clicks/number of screenings). However, a report like this without a link to the site, conversions or real sales did not give a complete picture.
Earlier, client analysts together with colleagues from OWOX BI did a very important part of the work. They combined data from online and offline and configured marketing analytics and ROPO reports. All that was left was to supplement the client data already collected in Google BigQuery with information about video advertising.
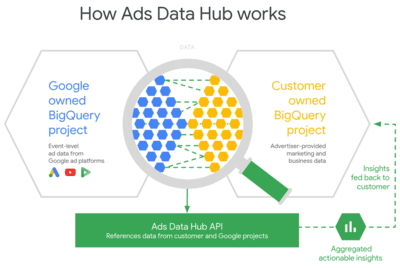
The problem was that GDPR (Europe's new data protection regulation) prohibits the receipt of a user ID from Google systems for publishers. And without this identifier, it's impossible to link views of ads by a specific person with his transition to the site or purchase if the customer didn't click on advertising.
Decision
To solve the problem described above, OWOX BI analysts suggested that colleagues from the online store use a special anonymized OWOX User ID, which allows tracking the intersection of audiences on different sites. With this ID, the view data was combined with customer actions on the site and purchases in physical stores.
Let's take a closer look at each step.
Step 1. Configure Video Display Data Collection
To track ad views, OWOX BI created special tags (code fragments) for each video and handed them over to the client's publisher, 1+1 Digital. The publisher posted these tags through his advertising publishing system.
When a user views a movie, the tag sends almost real-time event data to a client project in Google BigQuery. This data is recorded in a separate table and contains these parameters:
- The name of the movie a user watched.
- User region.
- User device.
- The site where the user watched the ad.
- Time of watching the movie.
- Unique identifier of the OWOX User ID that is automatically assigned to each user.
Step 2. Link all data to each other
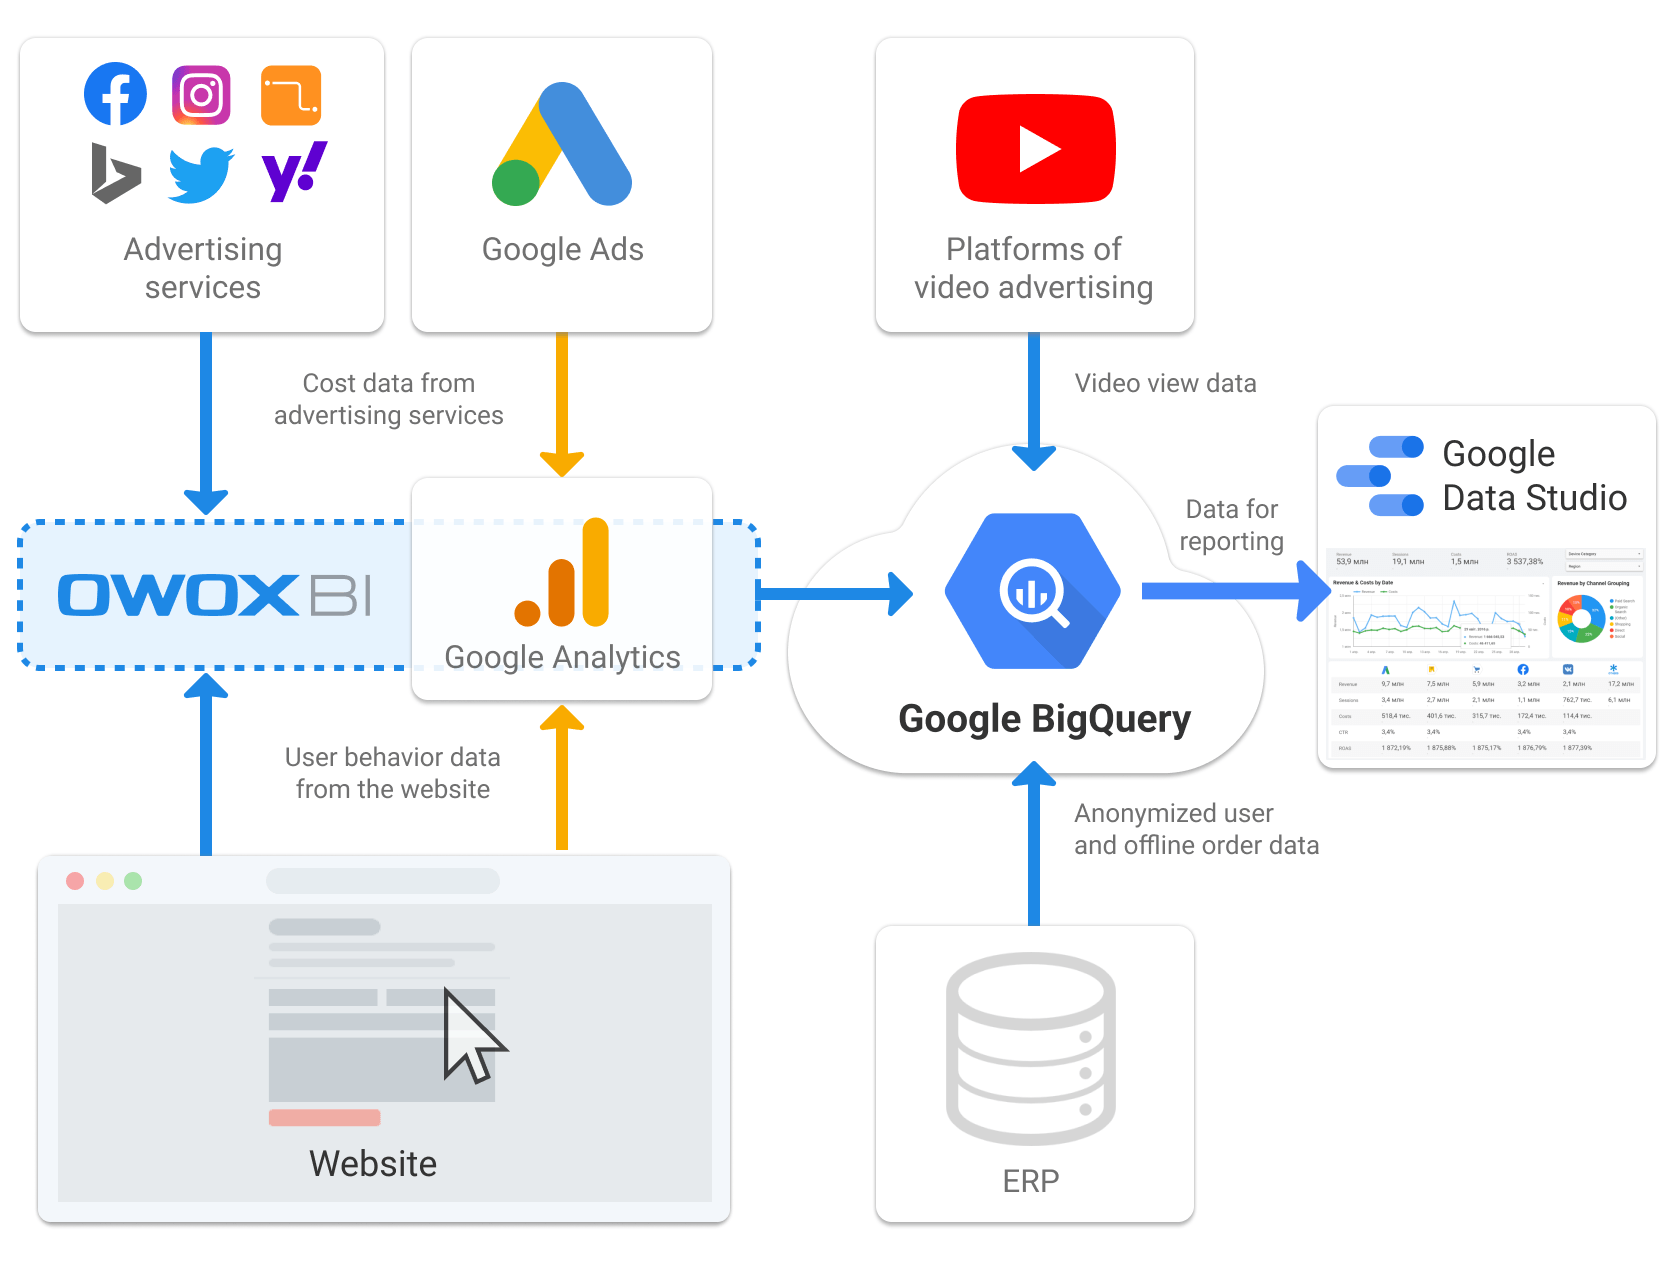
The client collects customer activity data on the Google BigQuery site using OWOX BI. The developers of the online store have also set up their own daily automatic upload of offline sales data from ERP (Axapta) to Google BigQuery.
These data, as well as video information, are collected on three different tables. To build reports, analysts have combined all data into a single table using a SQL query. The key used was the User ID (unique user identifier from the client ERP system) and the anonymous OWOX User ID.
The company began using OWOX User ID back in April 2018. Therefore, after combining all the data, it was possible to find out that 14.8% of people who viewed the advertisement had previously been on the client's website. And the number of customers who went to the site within 9 days after watching the ad was 5.8%.
Step 3. Build Reports
After combining all the data, analysts at OWOX BI created a dashboard for the client in Google Data Studio. A conversion window of 9 days was used to calculate all metrics. A conversion window is a time it takes a user to pass a funnel and perform a targeted action. In our case, it is time from watching ads to buying online or offline.
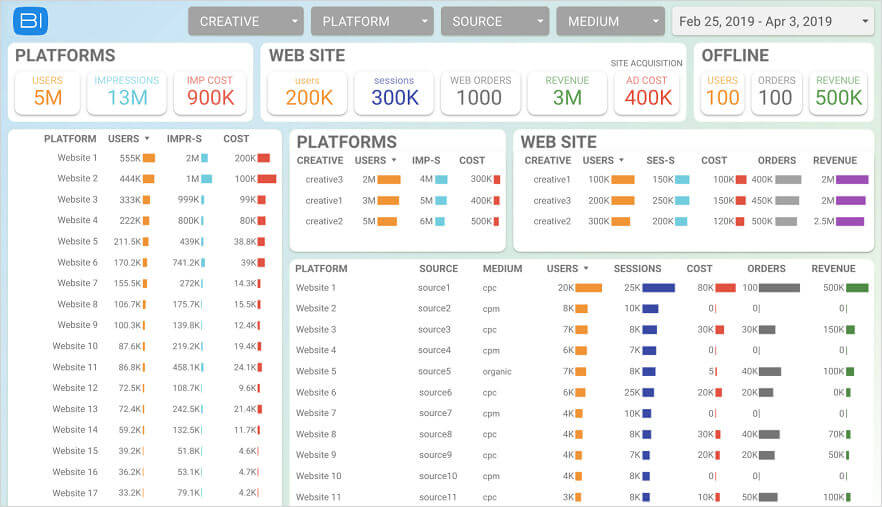
On the first page of the dashboard, marketers of the online store can see:
- How many unique users have seen videos, total views, and total video ad costs.
- How users interacted with the site after watching the clips - how many sessions, online orders, and how much income they generated.
- How much money the company spent on contextual advertising, in cases when users after watching the video visited the site through a paid channel.
- How did video ads affect offline purchases - how many offline orders and what revenue were generated by users who saw the ad.
- Statistics on video advertising in terms of the sites on which it was broadcast - how many shows there were on each site and what their cost was, how many users watched video advertising on a certain site.
- How each video individually affected online shopping - how many users, sessions, orders, and income a certain video brought and how much the company paid for its rotation.
- User paths where video viewing was the first touchpoint.
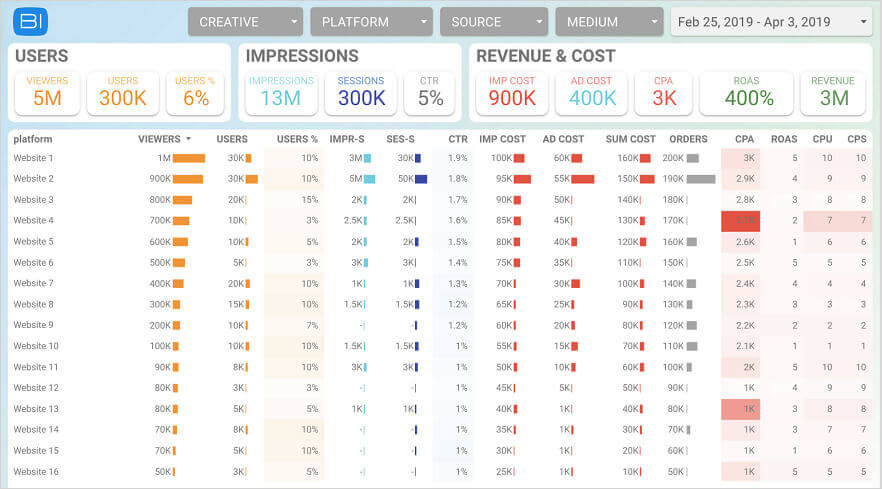
On the second page of the marketing dashboard for the online store we can see quality KPI of video ads in general and in the section of sites:
- CPA with the costs of videos and context ads that participated in the sales funnel.
- ROAS with online and offline sales.
- USERS% are unique users who have already visited the site before watching the video.
Key takeaways
In the past, it was problematic for online marketers to fully assess the effectiveness of video advertising. Thanks to the solution from OWOX BI and 1+1 Digital, the customer was able to link video ad views to online and offline sales, which helped to more accurately calculate the cost of attracting users (CPA) and (ROAS) of media advertising.
Now marketers of the company can easily find out which video or which platform brings the most or least conversions online and offline. Which of them should be allocated a larger budget, and which should be abandoned.
In addition, using OWOX User ID, the company can learn the number of views of video ads by users who have previously visited the site, and analyze further behavior of these cohorts: Retention Rate, conversions, etc.
P. S. If you were inspired by this case and you also want to track Post-view conversions to know what income online and offline your video ad brings, write to us at mail@owox.сom - we will be happy to help.
![]() Get in-depth insights
Get in-depth insights
![]() Get in-depth insights
Get in-depth insights
Top 30 Handpicked Google Looker Studio Dashboards for Marketers