Answear Success Story: How to Evaluate Traffic Channels and Increase SMS Marketing Revenue by 19%
About Answear
Answear is a multi-brand online store selling clothes, footwear and accessories. The company offers more than 220,000 products, from 220 famous brands to online shoppers in Poland, Ukraine, the Czech Republic, the Slovak Republic and Hungary.
Founded in Poland in 2010, Answear managed to gain popularity and expand into the international market thanks to providing 24/7 online service, convenient payment methods, delivery from Europe within 4 days, simple return conditions, and an intelligent loyalty program.
Goal
Since Answear entered new markets over time, the company’s regional departments strive to achieve somewhat different goals. The strategy for the new markets, Ukraine and Hungary, is primarily focused on increasing sales, encouraging repeat purchases and expanding customer databases. The strategy for the company’s already-established markets, Poland and the Czech Republic, is mostly focused on customer retention and re-engagement.
Another factor Answear has to consider in planning their campaigns, is that advertising performance depends on the country. For example, news websites are popular in Ukraine, and placing display ads on such websites yields good results. In Hungary though, news websites aren’t all that popular, that’s why the company runs their paid advertising campaigns on other platforms.
In this success story, we explore how Answear introduced their online store to customers in Ukraine. To attract new customers and increase sales, the company needed to evaluate the performance of traffic sources, and use the results to reallocate their advertising budget. As buyers engage with the company’s website answear.ua through an average of 3 to 5 different channels before making a purchase, it’s important to evaluate not only the first and last channel in the funnel, but also the input of each channel in the customer’s purchase journey.
In addition, the company needed to know what product categories, brands and price segments are popular among customers. This information allows for targeting advertising campaigns to the right audiences.
Challenge
The main analytics tool Answear use in the course of business is Google Analytics. The tool is free, easy to set up, and offers detailed documentation for both users and developers. Using the Enhanced Ecommerce plugin in Google Analytics, the company’s analysts track the following user actions: purchases generated via each advertising channel, using promo codes, and clicks on internal banners.
However, Google Analytics has a number of limitations that Answear was looking to overcome. When the number of website visits exceeded 500,000 per month, Google Analytics started sampling the data. With sampling, reports are based on a smaller percentage of data, e.g., 36.6% instead of 100%. Naturally, this leads to less credible results. The company also needed to track all the necessary information about products and purchases, while the free version of Google Analytics only provides for a maximum of 20 custom dimensions and 20 custom metrics in its reports. For more information about the challenges and limitations you might encounter in Google Analytics, check out our blogpost.
The data about website user behavior, advertising costs, returns, and margins, was stored in different systems. To make informed management decisions, Answear needed to bring all this data together.
Solution
Answear managed to overcome sampling and other reporting limitations, and consolidated the data needed to evaluate the advertising channels, by leveraging the Google BigQuery cloud data warehouse, Google Analytics, Google Sheets, and OWOX BI products.
Google BigQuery was chosen for the following reasons:
- It’s easy to set up and can process terabytes of data in seconds.
- It ensures the security of the data in the cloud.
- The service offers clear pricing options and terms of use.
- Google BigQuery uses SQL-like queries for data processing. The basics of SQL can be mastered within a week.
Let’s take a closer look at the each step Answear took to meet the company’s goals.
Step 1. Bring data together in Google BigQuery
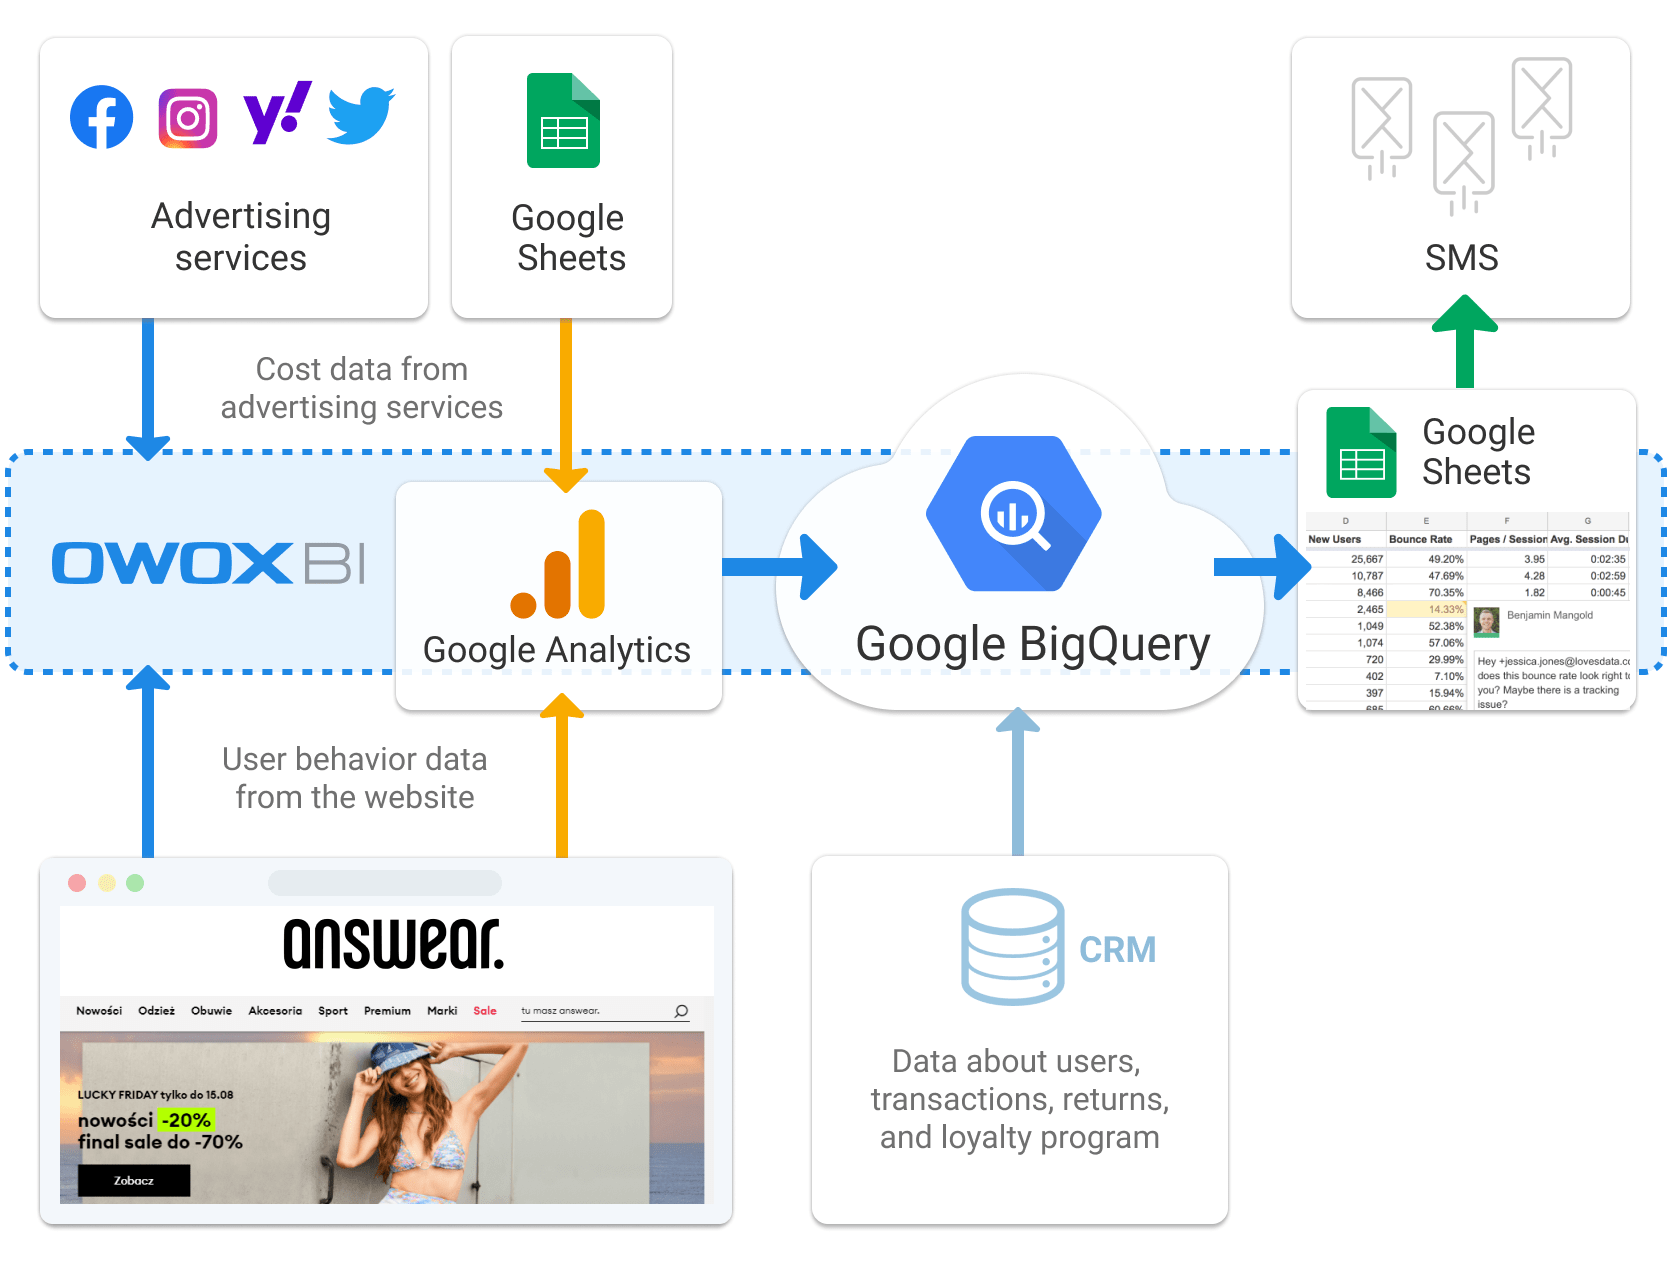
Answear sends real-time user behavior data from their website to Google BigQuery, using OWOX BI Pipeline. For more information on how you can configure real-time data import to Google BigQuery, visit our Help Center.
The data about users, transactions and returns is sent to Google BigQuery from the company’s internal system through the API. When setting up the import, the company determined which data to analyze, in particular: users, orders, and loyalty program. The information is updated several times a day.
Answear uses OWOX BI Pipeline to automatically send cost data from Facebook to Google Analytics. Cost data from services not providing automatic integrations is uploaded to Google Analytics using the OWOX BI Data Upload add-on. After all the cost data is collected and consolidated in Google Analytics, it’s altogether sent to Google BigQuery, via OWOX BI Pipeline.
Answear’s specialists use SQL queries to process and structure the data in Google BigQuery. The results are then visualized in Google Sheets. Answear uploads the data from Google BigQuery to Google Sheets using the free OWOX BI BigQuery Reports add-on, which provides an opportunity to schedule automatic report updates.
The entire data consolidation process is shown on the flow chart below:
A leap forward to better analytics
OWOX BI helped us take ANSWEAR’s analytics strategy up a level. ANSWEAR is a fast developing online retailer and it needs high-quality analysis. Other analytics tools we previously used had limitations, which we really didn’t want to deal with. It wasn’t possible to consolidate the enhanced user data in Google Analytics, or combine data from our email system with the on-site user behavior data. That’s why we went with OWOX BI to meet our needs. By collecting data in Google BigQuery, we’re able to build automated reports to analyze and improve our KPIs, as well as analyze data from across our website, apps, mailing system and other customer touchpoints.

Step 2: Target SMS marketing campaigns
The information needed for the targeting: data about registered users from the company’s internal database, user interactions with the website and their phone numbers was collected in Google BigQuery. Then, Answear grouped users into SMS marketing segments, and sent out messages using the SMS API. This ensured complete data security that wouldn’t be possible with other systems.
This approach allowed sending SMS messages about the sale to users who have already bought a product of a certain brand, and to users who expressed interest in products of this same brand. By including those users who viewed products, but didn’t make any purchases, Answear managed to send out messages to 32% more potential customers. Thanks to this, the revenue generated by the mobile campaign increased by 19%.
Step 3: Evaluate traffic channels
As mentioned above, Answear’s departments in different countries strive to achieve somewhat different goals, depending on how long the store has been operating in the country. This includes attracting new customers and increasing sales in new markets, while focusing on customer retention and reactivation in others. Considering these goals, Answear determined the basic KPIs for customer acquisition channels in each country. The KPIs set for the Ukrainian website were: purchases made by new customers, registrations, percentage of new visits, additions to the shopping cart, additions to the wish list, repeat purchases, newsletter subscriptions, order returns and cancellations.
To assess the efficiency of the channels, the company pre-divided them into logical groups with respective utm_medium tags appended to the URL:
- Comparison — price comparison services: hotline, ceneo.
- Affiliate — affiliate websites: zanox.
- Retargeting — retargeting services: criteo, rtbhouse.
- Cpc — paid search: google brand and non-brand + social.
- Display — display ads: google with graphic ads, viva.
- Email campaigns: external.
More information about what UTM tags are and how to use them can be found in our blogpost.
Answear decided to compare advertising channels within logical groups: paid to paid, free to free, and so on. This decision was due to the fact that each type of advertising has its own specific role. For example, display advertising mainly brings new visitors while brand campains with the «Answear» keyword return customers who are already familiar with the store.
Next, the company assigned a weight to each KPI, based on the goals set for the traffic channels. The greatest weight was assigned to purchases, registrations, and email subscriptions, while order returns and cancellations were given negative weights:
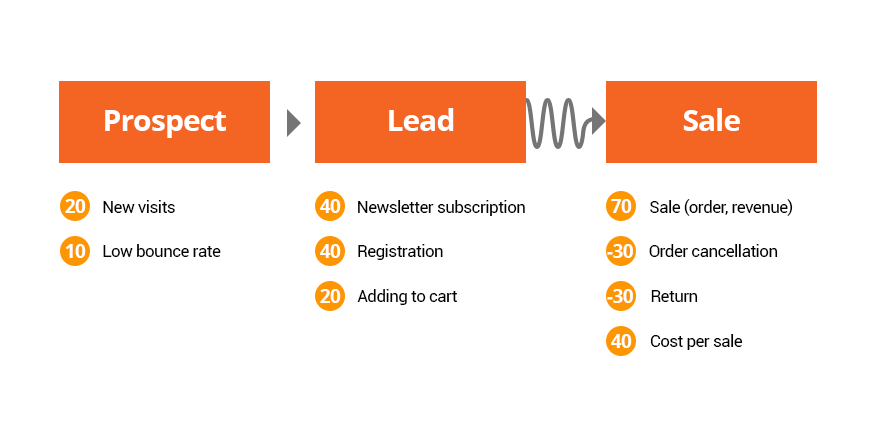
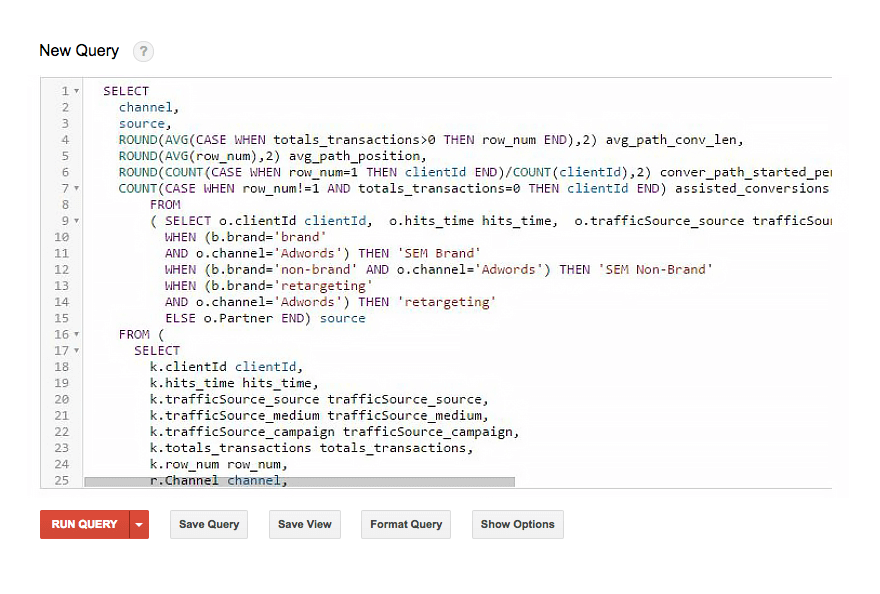
After that, Answear calculated the position of the channel in the purchase path, the number of channels in the path, and the number of times the channel participated in the assisted conversions. This was done by using SQL-query to the data in Google BigQuery.
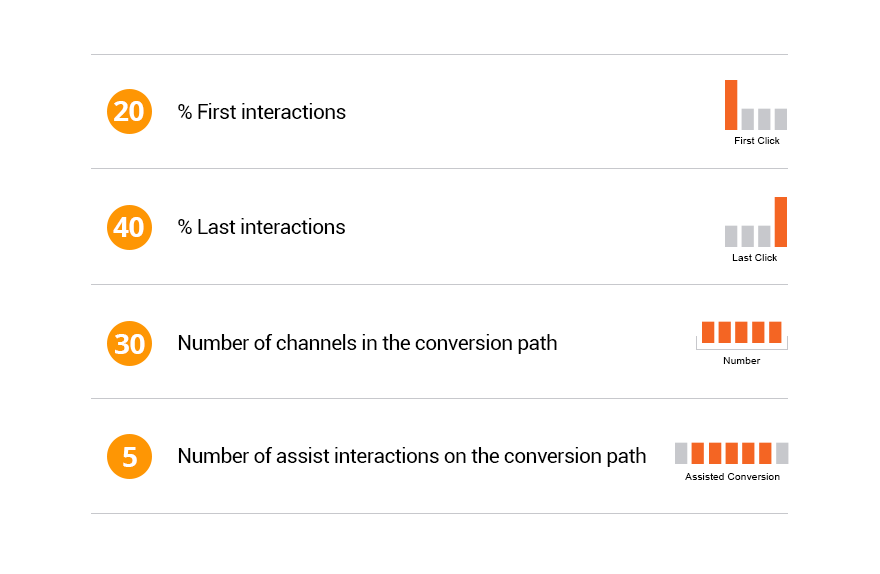
Depending on the role the channel had in the purchase path, it was assigned a corresponding weight. For example, 20 if the channel brought a new user to the website, 40 if the channel was the last one before the purchase, and so on.
The results of the query were exported to Google Sheets using the OWOX BI BigQuery Reports add-on. As a result, the company obtained an automatically updated report with all the KPIs needed to evaluate the advertising channels. To compare the efficiency of the channels, the necessary indicator, i.e., the number of additions to the cart, is multiplied by the weight assigned to the channel. The result is displayed in the Channel Scoring column in the report.
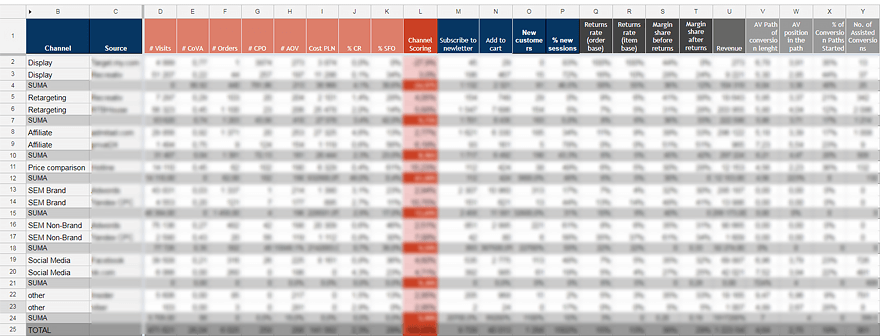
The report helps see both the role the channel played in the purchase path and the value it brought. This helps to reallocate advertising budget resources for greater efficiency.
The example below shows how advertising investments can be optimized, based on the report shown above:
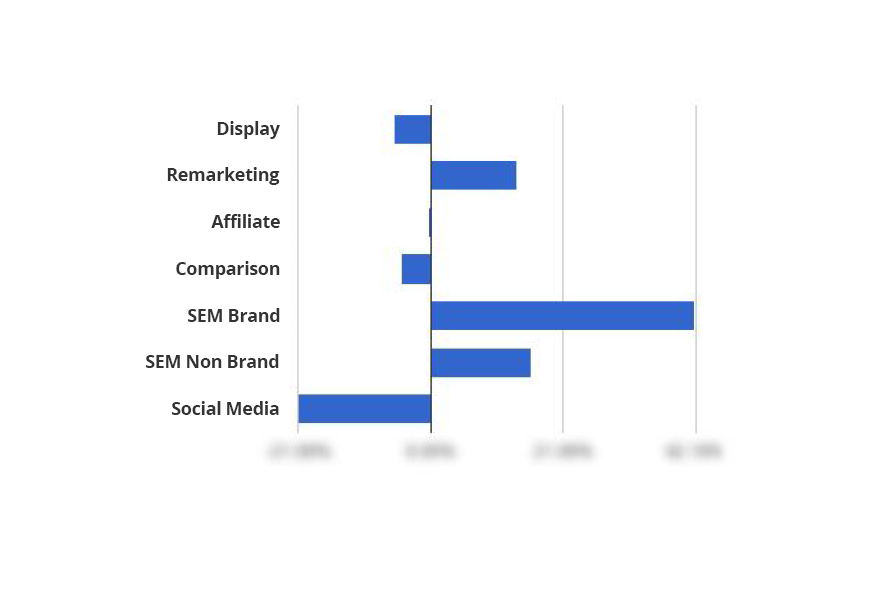
The chart shows that Answear can invest more in remarketing and brand campaigns while spending less on social media ads, as they generate almost no sales.
Results
- Answear built an efficient, almost completely automated analytics system and was able to combine and deeply analyze the data.
- By combining data about registered users with data about their website actions, Answear identified segments of users who were interested in a particular brand, and sent them an SMS message about the sale. As a result, the company managed to include 32% more users into the SMS marketing segment, and received 19% more revenue from the mobile campaign.
- The company was able to evaluate the contribution of each advertising channel in the purchasing journey of their customers and thus reallocate the advertising budget resources more efficiently.
How do you evaluate user acquisition channels? We’re looking forward to your comments and questions.