![]() Get in-depth insights
Get in-depth insights
![]() Get in-depth insights
Get in-depth insights
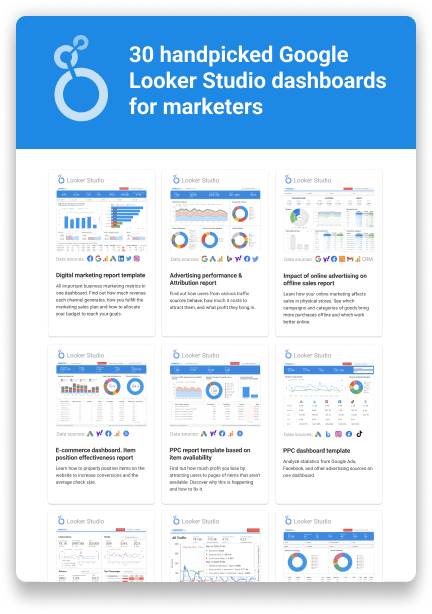
Top 30 Handpicked Google Looker Studio Dashboards for Marketers
Digital everything comes to businesses as well as in all other aspects of life. There’s no more ways for any business to survive and increase its revenue without using data analytics. Data insights are there to optimize performance, discover new opportunities for growth, and help to avoid any risks.
In this case, we describe the solution provided by the OWOX BI team for a large retailer of water supply systems, heating and air conditioning equipment, etc. that had challenges with improving its marketing performance.
Goal
The company offers its customers over 110,000 items from 600 leading manufacturers: the purchases can be made online at the website, over the phone, and in brick-and-mortar retail stores. So these products are actively promoted by using Facebook, Сriteo, and Google AdWords. So, the marketing specialists were looking to improve the efficiency of advertising, by evaluating advertising campaigns and optimizing the allocation of budget resources. At the same time, all the business processes were expected to be as automated as feasibly possible.
For achieving this goal, the company needed to:
- Automate the consolidation of data from different sources: advertising costs, website user behavior, orders made over the phone, and order fulfillment rates from the CRM system.
- Create attribution models based on the consolidated data, in order to accurately evaluate the performance of different advertising services.
- Automate the management of advertising campaigns and bids.
Challenge
Before making a purchase, customers may interact with the company through a variety of different channels. For example, a customer may choose a product online, make an order over the phone, and complete the transaction in an offline store. In order to accurately evaluate the efficiency of advertising, you need to have the data merged across all touchpoints, both online and offline, while the data is originally collected and stored in different systems.
In order to create automatic bid management rules for advertising campaigns, the effectiveness of keywords have to be evaluated. To measure the performance of each keyword, it was necessary to merge all the available data about user actions, such as on-site interactions, phone calls, and offline purchases.
Although, the customer interactions with the website were tracking using Google Analytics, it’s not the best solution when it comes to consolidating data and evaluating ad campaigns. Google Analytics doesn’t allow reprocessing data. In other words, it’s impossible to change the amount of a transaction or add transactions from previous periods. As a result, the following data may be inaccurate or missing:
- Orders placed via the call center.
- Canceled orders and purchase returns.
- Offline purchases in retail stores.
Google Analytics only allows uploading certain types of data. That’s why the company wasn’t able to send data to Google Analytics for a number of parameters they needed, including the data about offline transactions. Google Analytics also has limits for the number of dimensions and metrics in reports. To learn more about Google Analytics limitations and how you can overcome them, see our blog post.
Solution
The Google BigQuery cloud data warehouse was chosen for its advantages like the service guarantees the highest security of data and easily integrates with other services via the API. It’s also easy to upload data to Google BigQuery from files and import it from Google Sheets. Google BigQuery allows its users to create custom unsampled reports with no limitations to the number of dimensions and metrics in a report. What’s better, with OWOX BI Pipeline the company can send unsampled data to Google BigQuery in a structure that is convenient for the business.
The following data is sent to Google BigQuery via OWOX BI Pipeline:
- Advertising costs (automatically collected in Google Analytics also using OWOX BI Pipeline).
- Orders placed over the phone, from the call tracking system.
- Order completions from the CRM system.
The other tools used were:
- Google Data Studio, to visualize advertising data.
- OWOX BI Attribution, to assign value to advertising campaigns.
- Bid management system, to automate bidding using the obtained data.
The company’s resulting data consolidation flowchart is as follows:
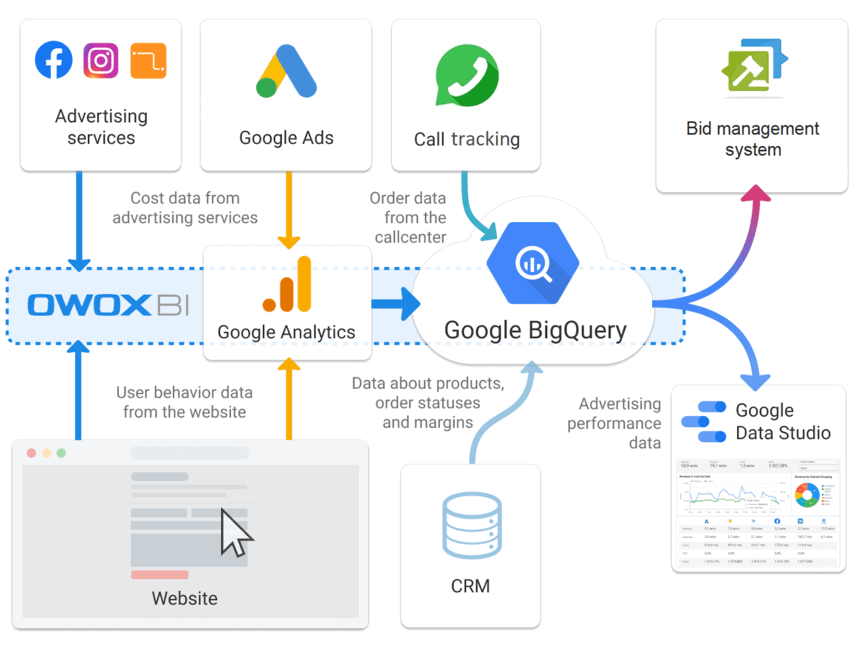
Now let’s take a closer look at each step taken in order to improve the efficiency of advertising.
Step 1. Collect advertising cost data in Google Analytics and Google BigQuery
First, the company’s analysts collect cost data from advertising services in Google Analytics. Cost data from Google AdWords appears in Google Analytics automatically thanks to the native integration. Cost data from other advertising services like Facebook and Criteo is automatically imported to Google Analytics via OWOX BI Pipeline. Next, cost data from all advertising services is automatically sent to Google BigQuery, also using OWOX BI Pipeline.
Step 2. Import data from the call tracking system to Google BigQuery
The call tracking system is used to collect data about orders placed in the call center. With OWOX BI the data about call events is automatically sent to Google BigQuery immediately after each call. When sending the event, the call receives a tag with the phone number at which the call was made.
Collecting the data from call tracking system in Google BigQuery enables the company’s analysts to segment the user audience down to a keyword and understand what keywords bring customers to the website before they make a phone call. First, an analyst queries the data in Google BigQuery to create a segment of completed orders that were placed over the phone. Next, this data is used by the OWOX BI Attribution model to evaluate the channels in the customer purchase path.
Step 3. Send data about order completion rates from the CRM system to Google BigQuery
The data about products, order statuses, and margins is collected in the CRM system. This data is automatically collected in Google BigQuery on a daily basis, thanks to the integration created by the company’s programmers. The company merges the data about order completion rates, website user behavior, advertising costs, and orders placed in the call center to evaluate the efficiency of advertising.
Step 4. Merge the data in Google BigQuery
The data from the call tracking system, Google Analytics, and the CRM system should be brought together to get a full view of how the company’s advertising initiatives perform. To facilitate this task, OWOX BI analysts created SQL queries for merging the data in one Google BigQuery table. Merging all the available data enables the company to track the full customer journey across all touchpoints, from visiting the website and making a call to the purchase.
Step 5. Visualize advertising performance data
OWOX BI analysts helped to create an informative Google Data Studio dashboard based on the data about advertising costs combined in Google BigQuery. The dashboard looks as follows:
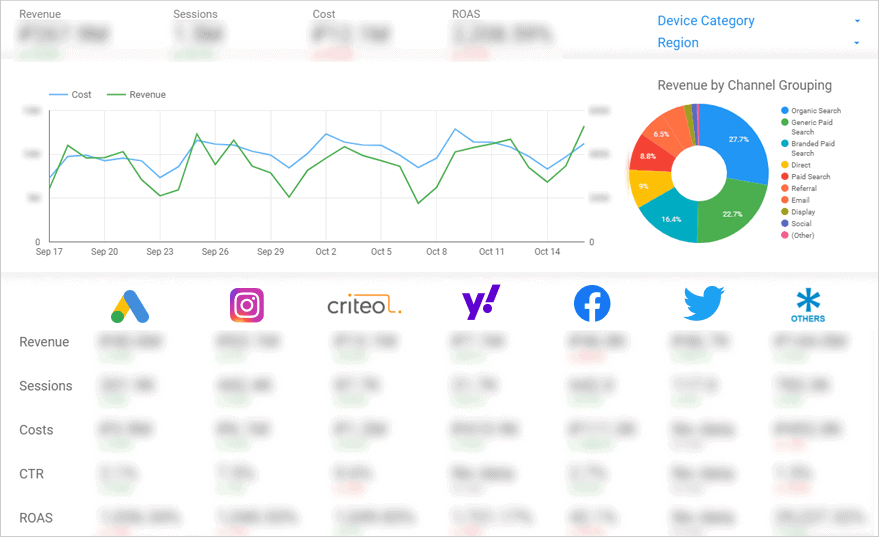
The dashboard makes it easier for the marketing specialists to compare the advertising performance metrics: cost, revenue, number of sessions, CTR, and ROAS, divided by the source, region, and ad campaign. As a result, the marketers can easily identify discrepancies in campaign performance for the same types of campaigns in different regions. This makes it way easier to eliminate errors made during the setup, should there be any.
For example, a campaign targeted at the audience in Kyiv was then duplicated for Lviv. The new campaign appeared to be suspiciously less cost-efficient, with more money spent on the campaign and much less revenue generated. By checking the keywords through which users arrived at the website, marketers could see that in some ads, broad match keywords were used instead of phrase match and exact match keywords, which resulted in money wasted on irrelevant traffic.
Step 6. Evaluate advertising campaigns
OWOX BI Attribution was used to evaluate the performance of advertising by creating a funnel-based attribution model based on the consolidated data from Google BigQuery. The main benefit of this attribution model is that it takes into account the contribution of each session before the order. The company’s purchase funnel looks as follows:
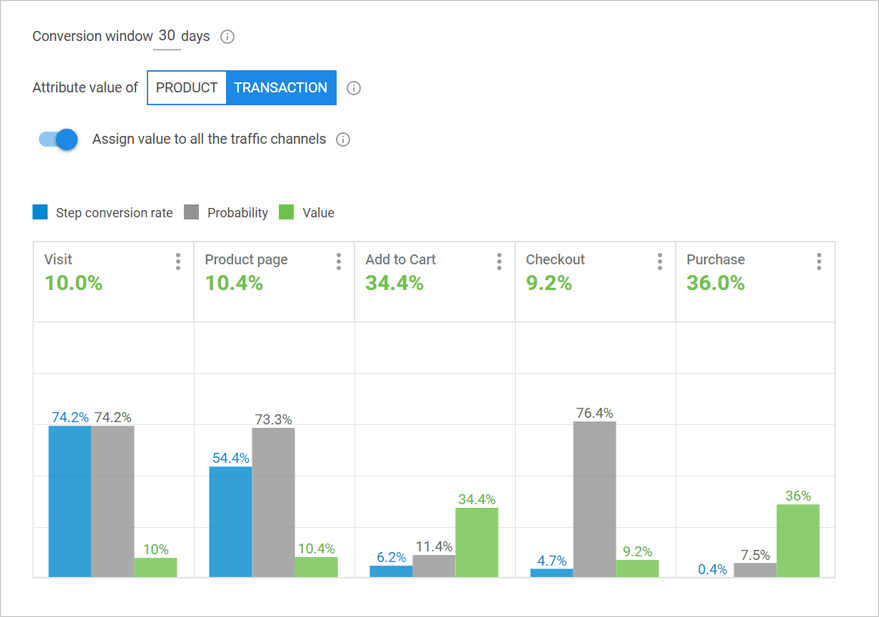
The chart demonstrates the step conversion rate, probability, and value for each user step in the purchase journey. The value of each session depends on the probability of the user moving on from one step of the funnel to another. The lower the probability, the higher value is assigned to the session which helped the customer take the next step, and vice versa. In this example, the Purchase step is the most valuable one, and it’s also the most difficult for customers to take. The probability that a customer moves on through to this step is 6.9%. The model assigns value to all sessions that contributed to the purchase. For more information about the logic of calculations in the funnel-based attribution model, please read our blog post.
Thanks to using the funnel-based attribution model, the marketing specialists were able to identify inefficient campaigns and optimize the allocation of advertising budget resources.
Step 7. Send calculation results from the attribution models to adjust bids in the bid management platform
As a result of collaboration with OWOX BI, the results calculated by the attribution model are automatically sent from Google BigQuery to the bid management system. As a result, the OWOX BI team developed a custom solution: the results of calculations from the attribution model are first sent to the access point using the Apps Script, and then imported to the bid management system on a daily basis. The analysts use Apps Script to enhance the data from the attribution model with the values from the AdContent dimension obtained from the OWOX BI Pipeline hit data tables in Google BigQuery. The AdContent dimension provides the first line of the ad campaign text.
The data imported from Google BigQuery into bid management system has the following structure:
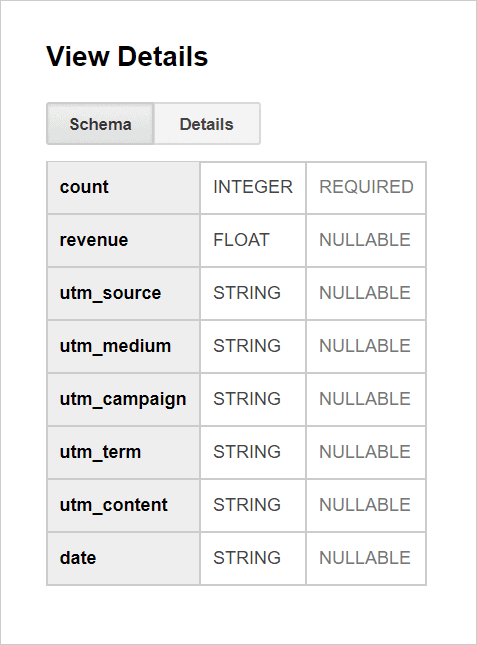
Next, the analysts determine rules to calculate bids in the bid management system. The formula is used to identify inefficient campaigns that, over the past 30 days, resulted in:
- More than or equal to X Google Analytics sessions.
- The ROAS of less than or equal to Y%.
- Less than or equal to Z phone calls in the call tracking system statistics.
The information about inefficient keywords is then passed on to the company’s contractors responsible for contextual advertising.
Results
- Thanks to OWOX BI Pipeline, the process of consolidating the data needed for analysis was automated. The data about website user actions, orders placed over the phone, advertising costs, margins, and order completion rates is now collected in Google BigQuery.
- With the help of OWOX BI Attribution, the company was able to accurately evaluate advertising channels and optimize budget allocation.
- The results calculated by the attribution model were automatically applied to managing bids in the bid management platform.
- As a result, the company managed to increase paid advertising traffic to the website and improved the advertising-to-sales ratio by more than 10%, as shown in the chart below:
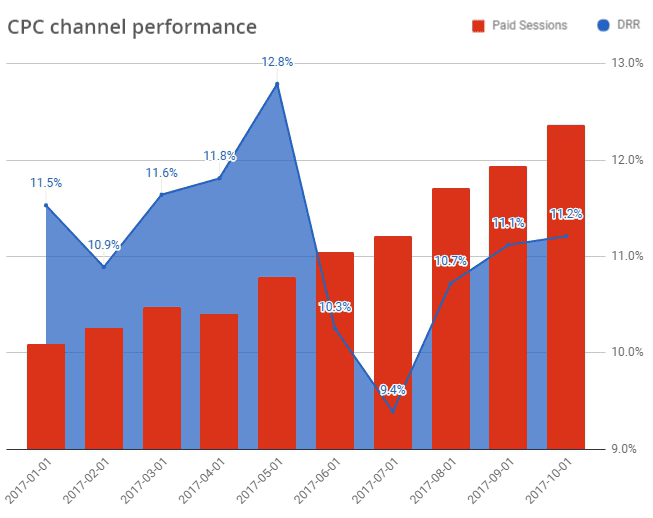
The chart demonstrates that the average advertising-to-sales ratio for the period January — May 2017 is 11.72%. After the redistribution of the company’s advertising budget resources, the average advertising-to-sales ratio for June — October 2017 decreased by 10% as compared to the previous period and accounted for 10.54%. At the same time, the amount of traffic from paid advertising sources for the time period increased more than threefold.
![]() Get in-depth insights
Get in-depth insights
![]() Get in-depth insights
Get in-depth insights
Top 30 Handpicked Google Looker Studio Dashboards for Marketers