Fabelio Case Study: How to Align Online and Offline Customer Actions
![]() Get in-depth insights
Get in-depth insights
![]() Get in-depth insights
Get in-depth insights
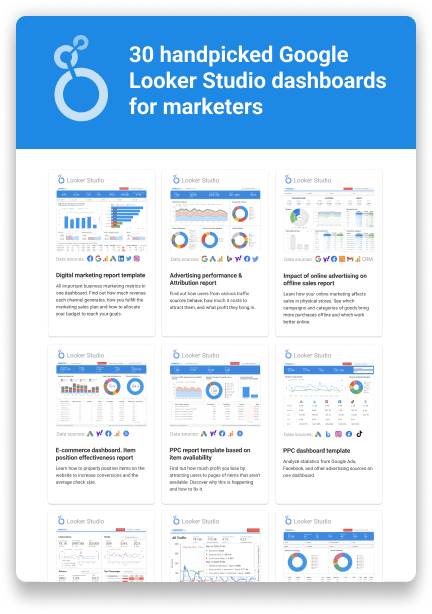
Top 30 Handpicked Google Looker Studio Dashboards for Marketers
The furniture multi-channel store from Indonesia named Fabelio.com decided to find out who’s the biggest fish in the pond and bring the most of profit — offline or online. With OWOX BI they got detailed ROPO report and improved their analytics.
About Fabelio.com
Fabelio.com is an online store for furniture and home decor. The company was established in Jakarta, Indonesia, in 2015, and is planning to expand to the Southeast Asian market. The Fabelio.com website has more than one million unique monthly visitors.
Unlock Your Retail Potential!
Explore sharper insights today.
The challenge
Fabelio.com has ten showrooms where customers can see how products look like, touch the materials, test out furniture, and pay for their purchases. Fabelio marketers were keen to know how their online marketing efforts contribute to sales in offline stores and get answers to questions such as:
- How long does it take for a customer to make a purchase decision?
- How does this time vary by product category?
- Which online channels have the greatest influence on the sales funnel at the last stages before an offline purchase?
- Which furniture categories are most popular for online customers who make an offline purchase later?
- How many website touchpoints do customers typically encounter before making a purchase?
- How do all of these parameters differ for new vs returning customers?
Fabelio.com salespeople write down the name, email, and phone number for each visitor to their showrooms. That’s why the company knows for sure when customers visit an offline store, even if they don’t buy anything. This is an additional data source. It also poses a new challenge: how to reflect this data in the sales funnel and determine which online source should be credited for these offline visits.
The decision
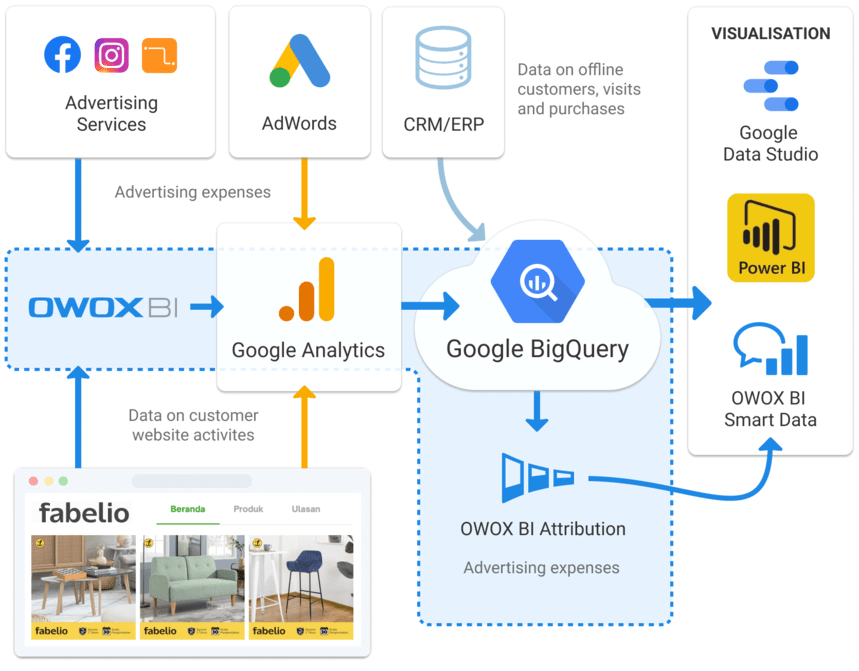
To build smart analytics measuring the influence of online promotion on offline sales, the Fabelio.com team had to associate data on the activity of website visitors with data on customer activity in the showrooms. To build smart analytics, you need to choose a reliable cloud storage where all the data you collect will be aligned. For cloud data storage, Fabelio.com chose Google BigQuery. BigQuery is the perfect choice for a company with limited resources:
- It has flexible pricing and is relatively inexpensive compared to similar systems.
- There’s no need to install any software on your servers or train your employees; basic SQL skills are enough.
- It has plenty of ready-to-use libraries for working and integrating with other services.
Fabelio marketing specialists established the following scheme for gathering data in Google BigQuery:
Research Online Purchase Offline: How to Evaluate the Impact of Online Advertising on Offline Sales
We’ll tell you how to combine data from disparate sources and build reports for ROPO analysis, to enhance the efficiency of your campaigns. Moreover, you’ll learn how to appositely use the results of the ROPO analysis for your business.
Watch the replay
Senior Digital Analyst
at OWOX BI

Business Development Executive in OWOX BI
Step 1. Gather data on customers’ website activities
To track events on the website, Fabelio uses Google Analytics (GA) — one of the most popular digital analytics systems worldwide as well on the Indonesian market. The company has an Enhanced Ecommerce funnel in GA:
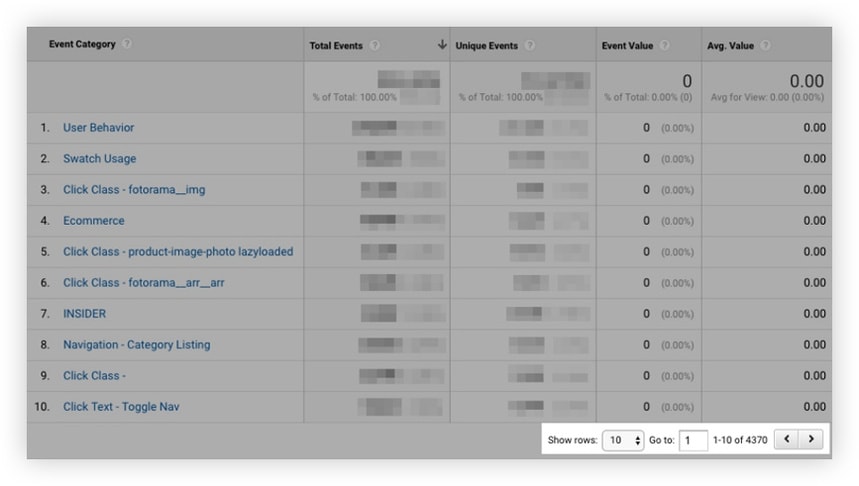
Aside from key interactions with the website, the Fabelio team tracks a variety of micro-conversions:
This data helps them segment customers, explore the transaction funnel deeply, and estimate traffic sources accurately.
Step 2. Gather data on expenses
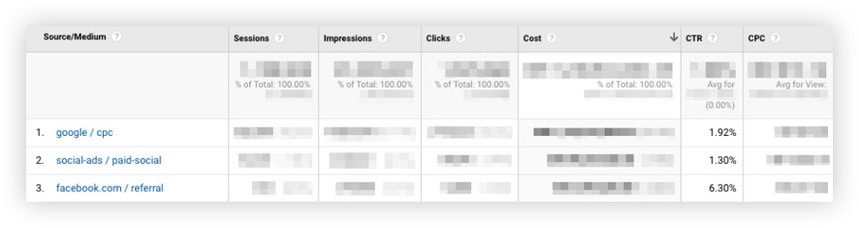
To estimate the impact of ad channels on sales, we need to compare the revenue and expenses for each channel. To gather data for this estimate, the Fabelio team established automated importing of expenses into Google Analytics with the help of OWOX BI Pipeline. With this expense data, Fabelio marketers can analyze KPIs for campaigns in Google Ads (which has a GA integration) and other services:
Step 3. Import data from Google Analytics to Google BigQuery
To import data on customers’ website actions and ad expenses into Google BigQuery, the Fabelio team used OWOX BI Pipeline. This service delivers the same hits to Google Analytics and Google BigQuery simultaneously. As a result, data is not sampled and is available for analysis in Google BigQuery just 2 to 5 minutes after it’s sent.
Step 4. Import data from the CRM to Google BigQuery
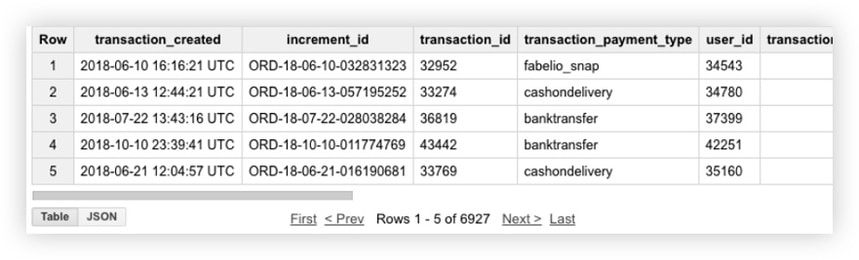
Fabelio stores data on customers, orders, and visits to showrooms in the Magento CRM. To associate offline and online data, Fabelio specialists established daily uploading of CRM data to Google BigQuery with the help of the Fluent Plugin.
There are a variety of publicly available out-of-the-box solutions for integrating Google BigQuery with other systems. For example, OWOX BI has a few free scripts to integrate your CRM with cloud storage.
Step 5. Data processing
After all data is gathered in Google BigQuery, it’s necessary to align it in one table. OWOX BI analysts helped Fabelio marketers to prepare a data set for online and offline orders with the correct structure.
Step 6. Establish attribution
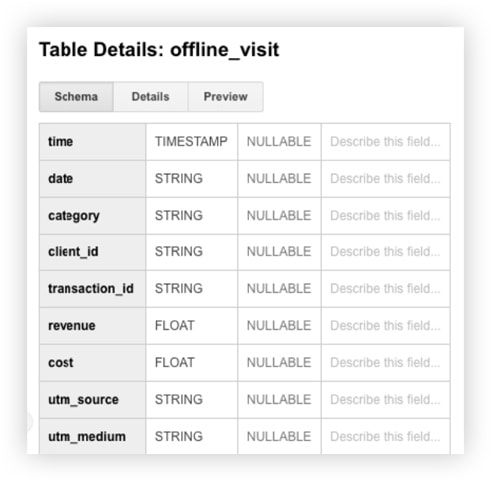
At the final stage, the Fabelio team implemented a ML funnel-based attribution model including offline orders. To work correctly, this special model needs data on offline store visits. To provide this data, Fabelio analysts prepared an additional data source for attribution of custom events.
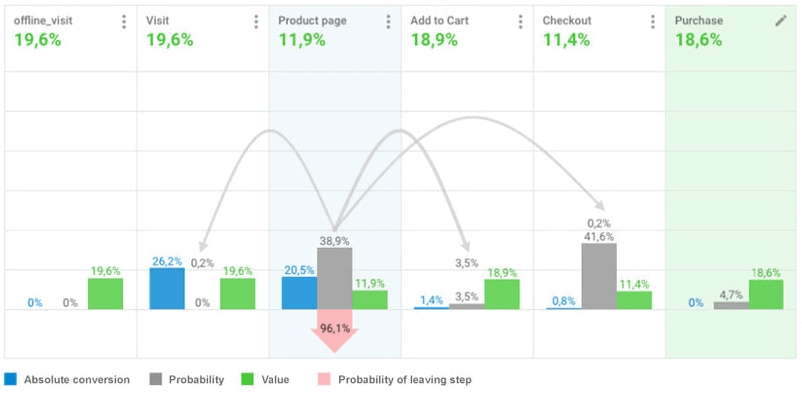
To finish, the Fabelio team just had to launch the calculations. As a result, the company got a funnel that accounts for offline orders and visits:
The results
Fabelio.com got automated reports that allow marketers to find insights and make the right decisions.
Fabelio marketers now have access to the following insights in OWOX BI Smart Data:
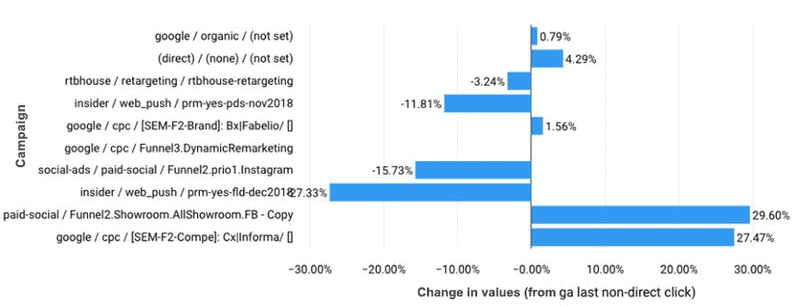
- Comparison of ad campaign value by different attribution models: GA Last Non-Direct Click and ML Funnel-Based Attribution by OWOX BI
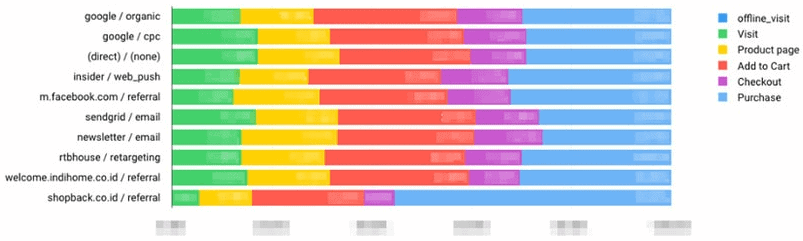
- Value distribution across sources and channels at different funnel stages
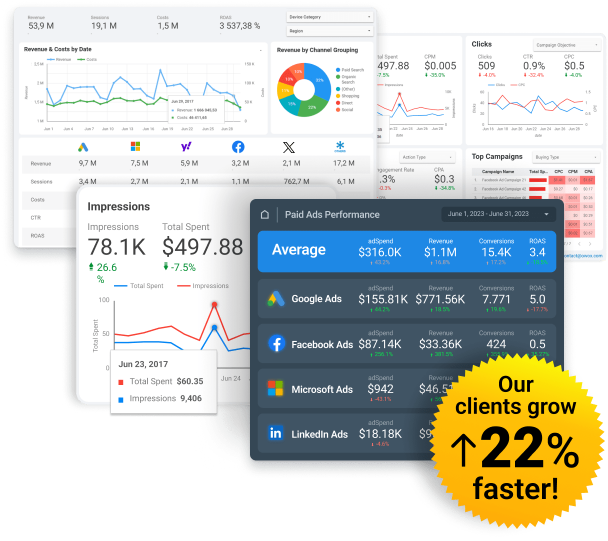
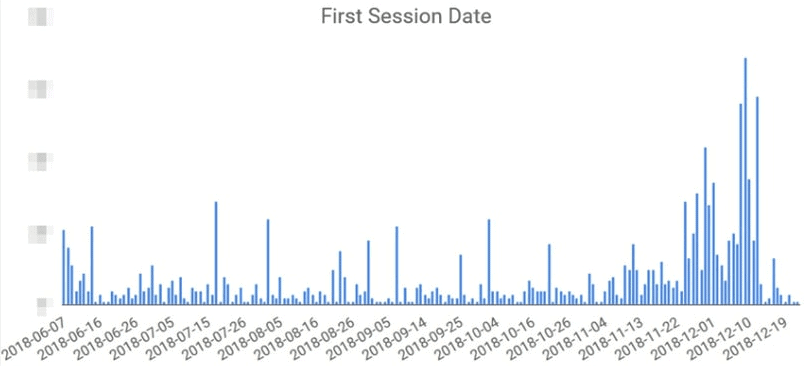
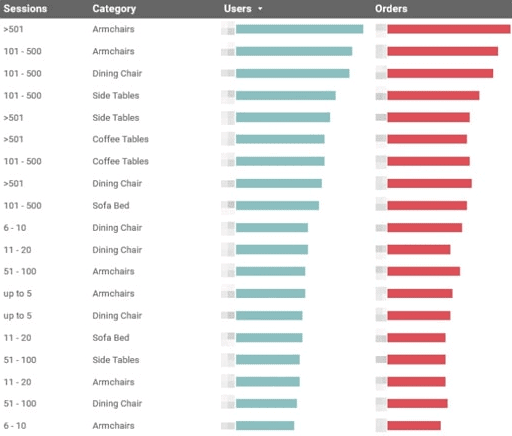
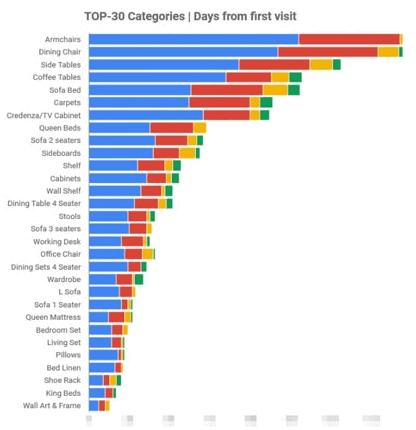
In addition, OWOX BI analysts prepared an automatically updated dashboard in Data Studio for Fabelio. In this dashboard, Fabelio marketers can filter data based on source, product category, type of customer, place of purchase, payment method, showroom name, number of days from the first visit and first session, etc.
The dashboard helps Fabelio marketers find answers to these questions:
- How many website touchpoints does a customer typically encounter before making a purchase, and how profitable are those touchpoints?
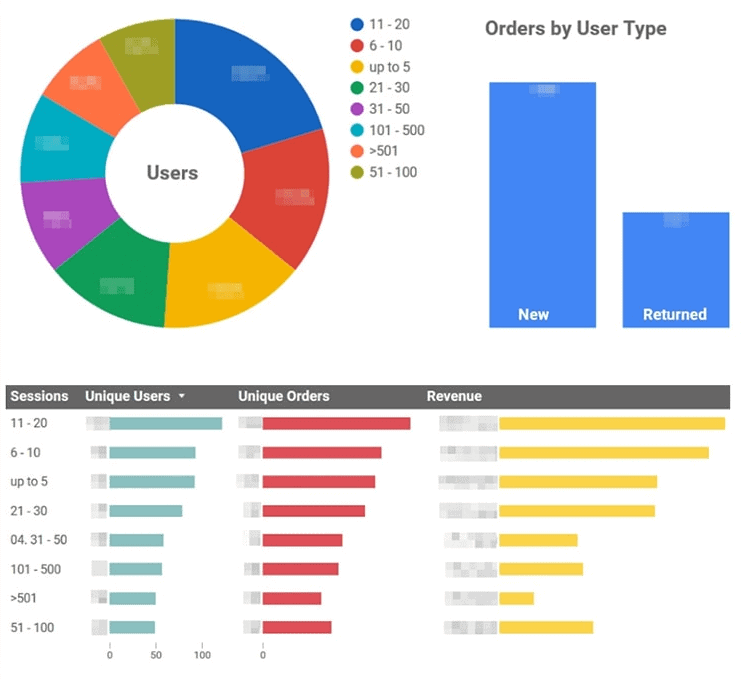
- When was the first session of a client who has made a purchase?
- How many website touchpoints do customers encounter, on average, for specific categories of purchased goods?
- How long does it take from the first website visit to the purchase within a given product category?
P.S. Our colleagues at Fabelio.com were encouraged to implement this solution after reading our article Omnichannel Retailing: Why and How to Integrate Online and Offline Customer Touchpoints. If this case study has encouraged you to look into integrating online and offline touchpoints, you should try building ROPO reports with the help of OWOX BI. You can experience all the possibilities of OWOX BI during a free trial.
Gain clarity for better decisions without chaos
No switching between platforms. Get the reports you need to focus on campaign optimization
![]() Get in-depth insights
Get in-depth insights
![]() Get in-depth insights
Get in-depth insights
Top 30 Handpicked Google Looker Studio Dashboards for Marketers