BigQuery to Looker Studio: A New Approach to Dynamic Visualization and Report Automation
Oleg Kharchenko, Senior Digital Analyst at OWOX BI
Ievgen Krasovytskyi, Head of Marketing @ OWOX
Get in-depth insights
Get in-depth insights
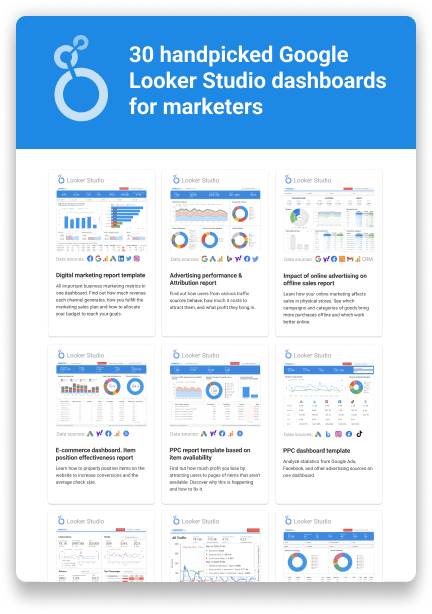
Top 30 Handpicked Google Looker Studio Dashboards for Marketers
In this article, we explain how to set up automatic updates to reports in Google BigQuery and visualize them using Google Data Studio.
With OWOX BI, you can automate data collection and any marketing reports. Book a free demo and we'll show you how it works.
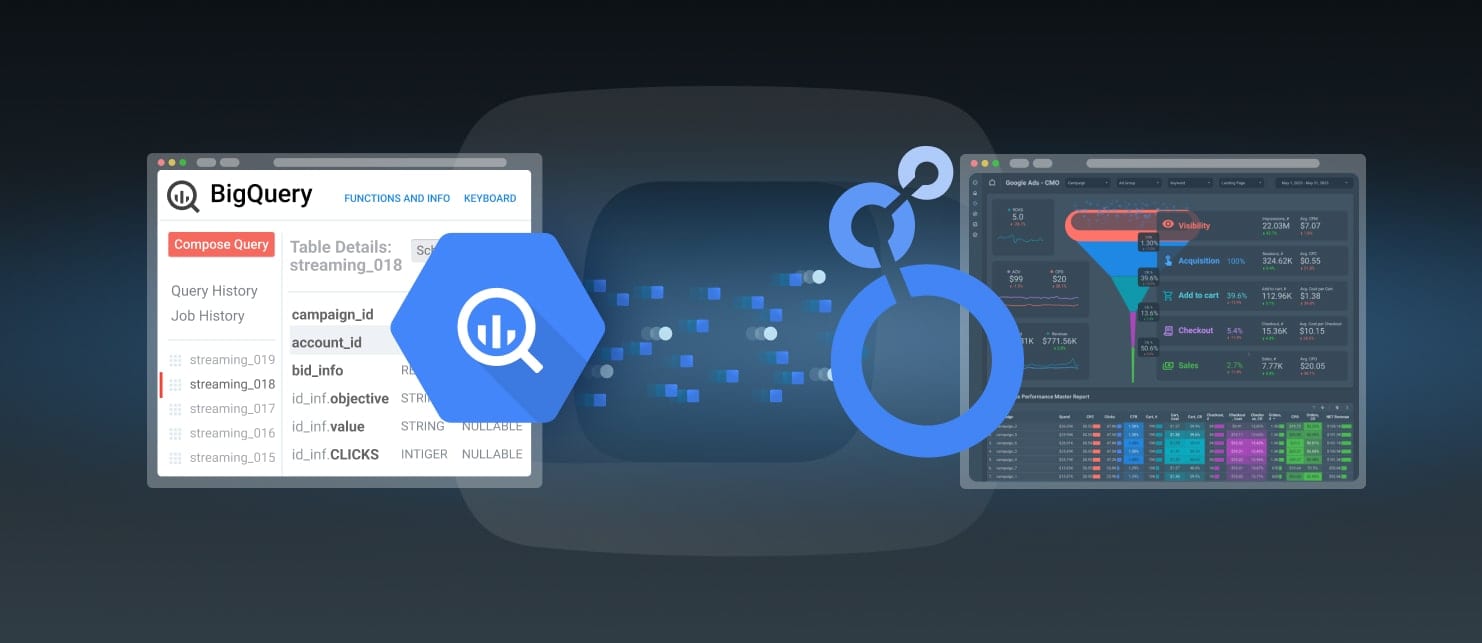
Note: This post was written in 2019 and has been completely updated based on the recent updates in 2024.
Fundamentals of Looker Studio and BigQuery
Diving into the core principles, Looker Studio and Google BigQuery serve as foundational tools in the realm of data analytics and visualization. Here's a brief introduction to these powerful platforms:
Looker Studio
Looker Studio, formerly known as Google Data Studio, transforms the way businesses visualize and share their data.
This free & probably the most intuitive visualization platform supports a wide range of data sources, enabling users to create compelling reports and dashboards that are both informative and easy to understand.
Here's why Looker Studio is a valuable tool for any data-driven team:
- Customizable Dashboards and Reports: Looker Studio provides a variety of templates and design tools, allowing users to create custom visualizations that meet their specific needs. Whether it's simple pie charts or complex data tables, Looker Studio makes it easy to convey your data story.
- Seamless Data Integration: With support for nearly any type of data source, including BigQuery, Google Sheets, Google Analytics, and hundreds of other pre-built connectors, Looker Studio ensures that your data is always at your fingertips.
- Collaboration and Sharing: Looker Studio promotes teamwork by allowing users to easily share reports and collaborate in real-time. With access controls (mostly in paid versions), it ensures that insights are accessible to everyone who needs them.
- No Cost: One of the most compelling aspects of Looker Studio compared to Power BI or Tableau is that it's available for free. This opens up advanced data visualization capabilities to businesses and individuals who might otherwise not have access to such tools.
- Accessibility: Designed with user-friendliness in mind, Looker Studio does not require a steep learning curve, making it accessible to users of all skill levels. This democratization of data visualization helps foster a culture of data-driven decision-making within organizations.
Google BigQuery Data Warehouse
Google BigQuery stands as a fully managed, serverless data warehouse designed to simplify and democratize the use of big data analytics.
With the capability to handle petabytes of data, switching business reporting from native tools into BigQuery allows users to perform SQL queries with blazing-fast execution times, making it an ideal solution for businesses of all sizes seeking insights from their vast datasets.
Here are some key highlights:
- Scalability: BigQuery's architecture is built to automatically scale to meet the demands of your data, from gigabytes to petabytes, without the need for manual intervention.
- Serverless: Unlike on-premise databases, BigQuery is a fully managed service. You don’t need to buy and manage software and hardware. Users can focus on analyzing data rather than managing underlying infrastructure.
- Integration and Security: BigQuery integrates seamlessly with other Google Cloud services and third-party tools, providing a flexible and secure environment for data analysis. With fine-grained access controls and data encryption, BigQuery ensures that your data is both accessible and protected.
- Cost-Effective: With its pay-as-you-go pricing model, BigQuery offers cost efficiency by allowing you to pay only for the storage and computing resources you use.
- Real-Time Analytics: BigQuery's real-time analytics capabilities allow businesses to make informed decisions quickly. Streaming data into BigQuery and analyzing it in near real-time can provide insights into customer behavior, operational efficiency, and more.
Dive deeper with this read
Google BigQuery: The Best Marketing Data Warehouse

By harnessing the strengths of both Google BigQuery and Looker Studio, businesses can achieve a comprehensive understanding of their data, driving insights and actions that lead to informed decision-making and strategic advantage.
Collect all of your marketing data in BigQuery automatically
OWOX BI is the easiest way to collect and blend all marketing data in a single storage. No SQL and developers required
4.9
Steps to Connect BigQuery to Looker Studio
We’ve created a complete guide with all of the details on how to use BigQuery as a data source for Looker Studio reports.
However, let’s just briefly go over a few simple steps in this article. This process is streamlined through a dedicated connector designed to fetch and periodically refresh your data.
While BigQuery is a popular choice for this integration and provides a single source of truth for businesses, it's worth noting that Looker Studio supports a wide array of data sources through Google's and Partner connectors, exceeding 800 options at the last count.
Using the BigQuery Connector
Step 1: Start by visiting Looker Studio. Click on 'Create' on the left side of the screen and select 'Data source' from the dropdown menu.
Step 2: In the list of Google Connectors, the BigQuery connector will be readily visible. It's a frequently used connector due to the common practice of incorporating BigQuery data into Looker Studio projects.
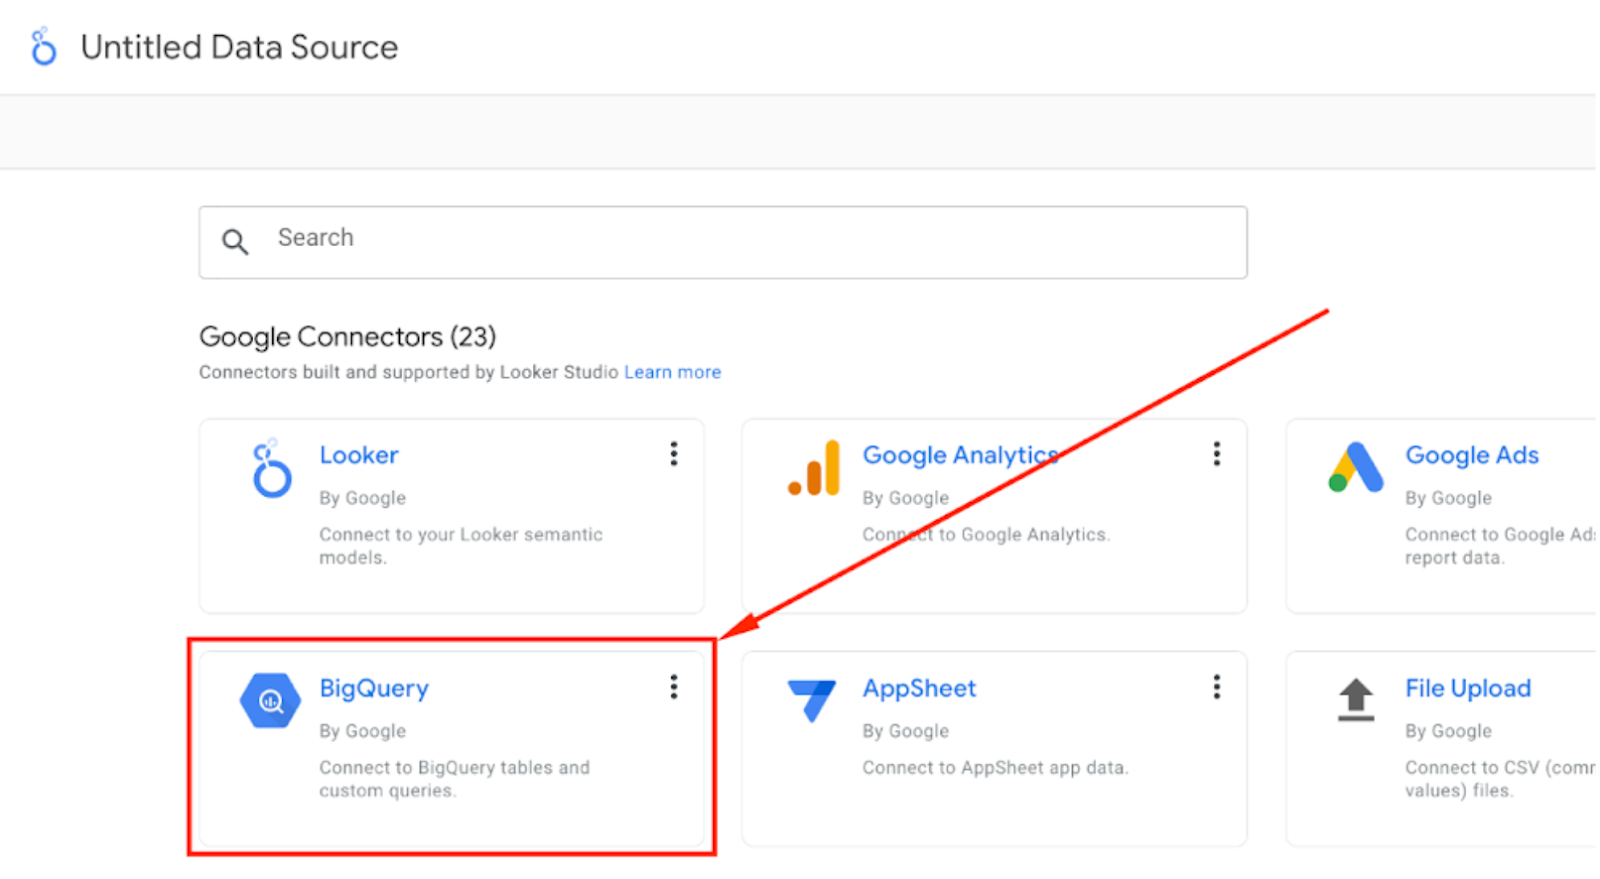
Step 3: If it's your first time using the BigQuery connector in Looker Studio, you'll need to authorize its usage. Subsequently, you'll be prompted to select the project, dataset, and table you wish to work with.
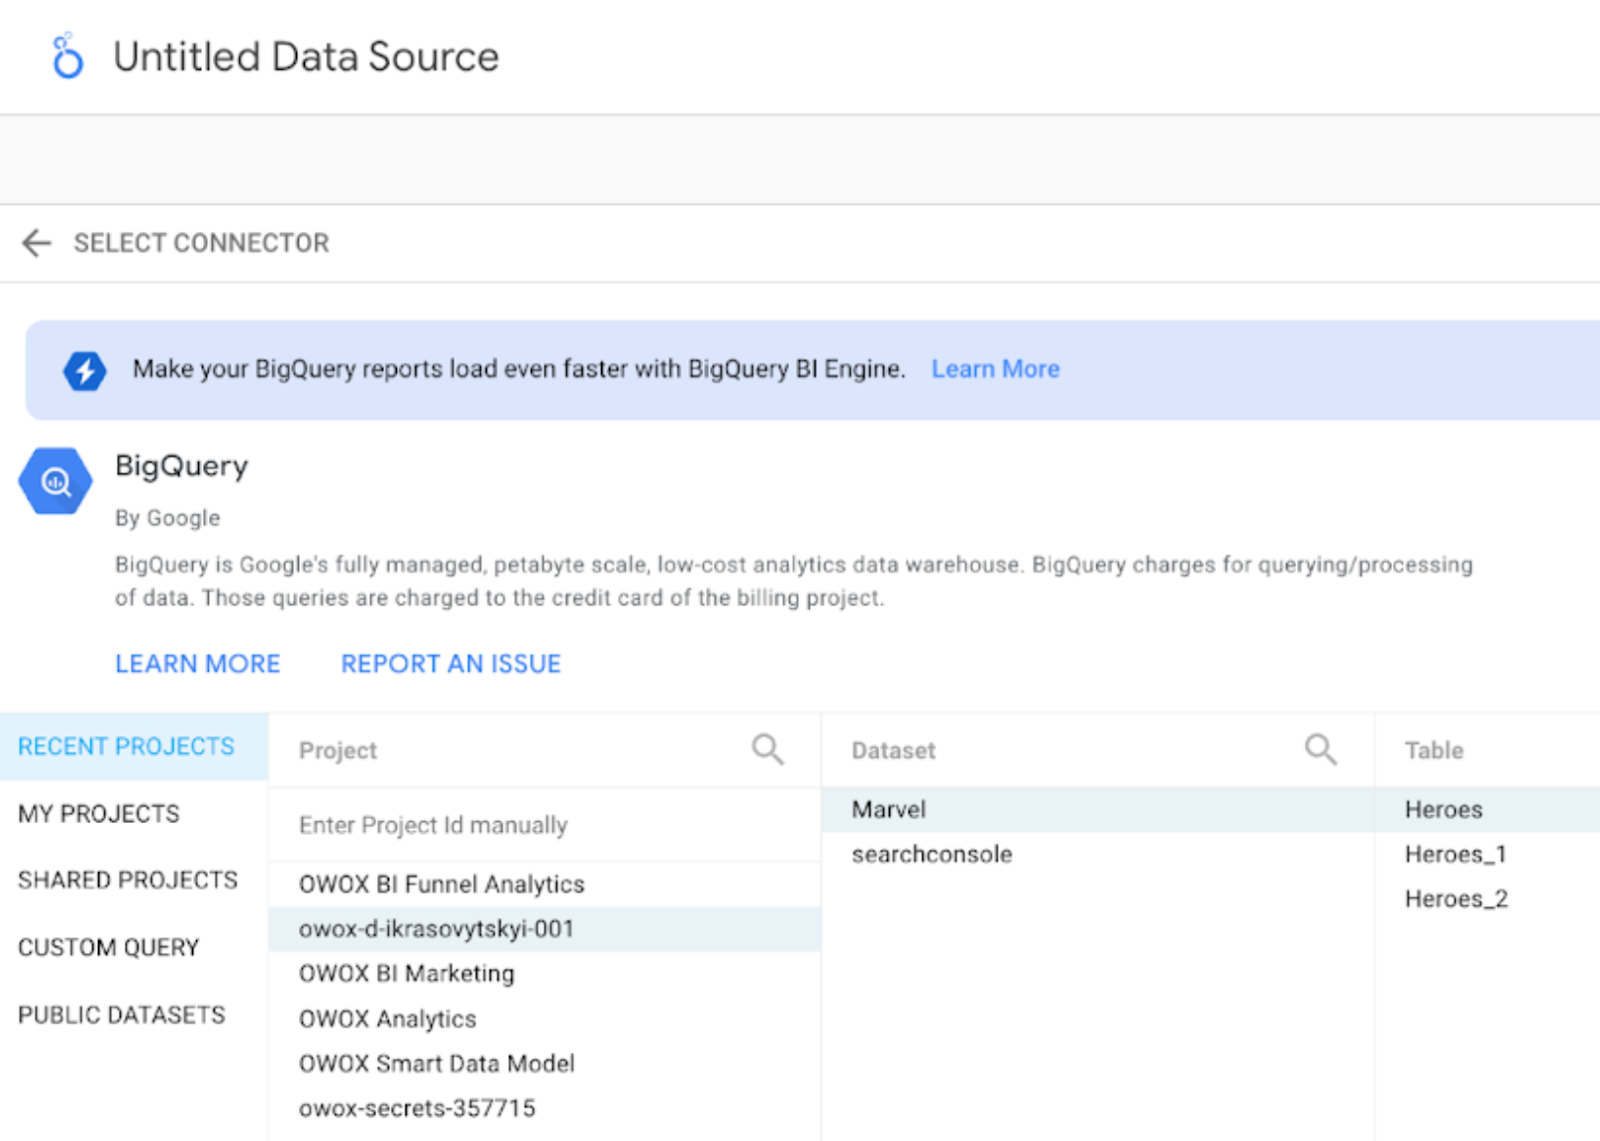
Note: You can always create a custom query that would retrieve data from multiple tables, however, the most cost-effective way to use Looker Studio is to prepare a table or a view for your data in BigQuery and not process raw data every time you change the filter in your report in Looker Studio. You can find the details of how to do that using SQL in one of our videos:
Configuring the Data Source
Step 1: After selecting your source, click the 'Connect' button in the upper right corner. Looker Studio will display the dataset fields, categorizing them into dimensions (green) and metrics (blue). Remember:
- Metrics are numerical values for measurement.
- Dimensions detail the aspects you're measuring with metrics.
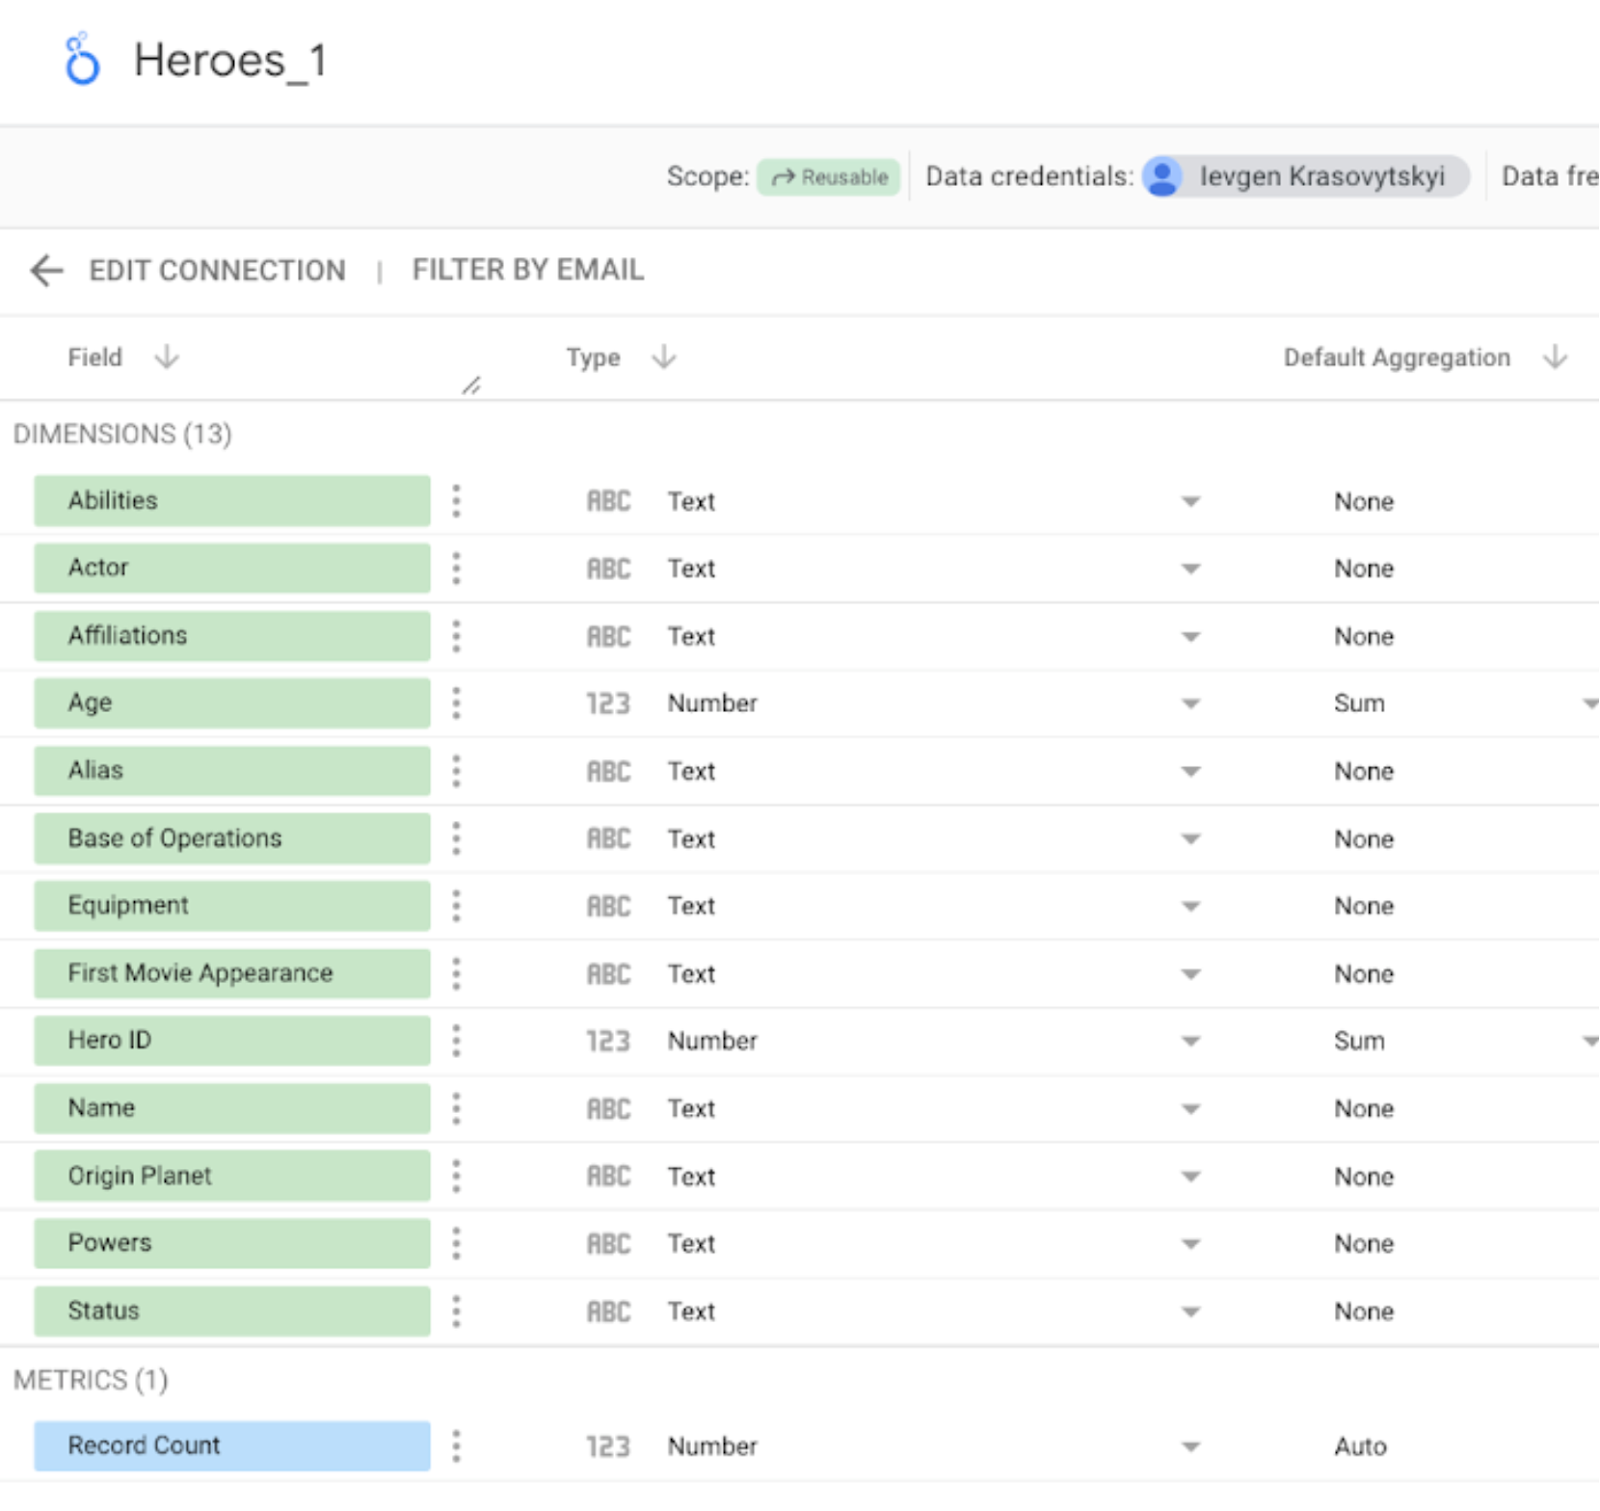
Step 2: Looker Studio automatically assigns default aggregations to each field, with text fields marked as 'None' and numerical fields typically set as 'Sum'. You can customize these settings, including specifying the currency for financial values.
Step 3: Click 'Create Report' in the top right, then accept the prompt in the new tab to start your report. The initial automatic table generated by Looker Studio might not be immediately useful and can be deleted if necessary.

Finalizing Your Report
After the preliminary setup, you may encounter a generic table populated with some of your data.
Although it's often not very informative, it's a starting point. Looker Studio's predictive capabilities haven't yet reached the point of intuitively understanding your data visualization needs, so feel free to remove this table and begin customizing your report.
Alternatively, if you find a template that suits your needs, you can easily apply your data source to it, replacing any placeholder data. Here is one of the most popular template that marketers use worldwide to analyze their performance data.
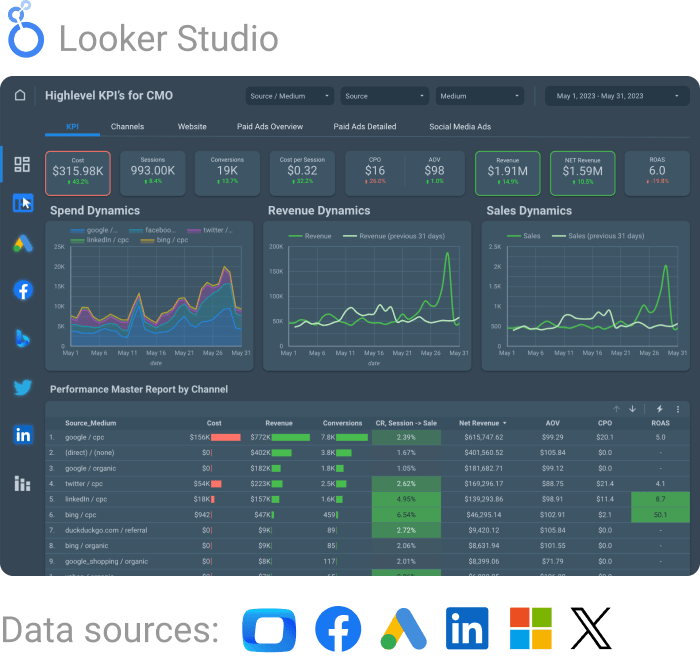
All-in-one Digital marketing Dashboard
Download templateWhy Automate Reports in Looker Studio?
The ability to create custom reports means that businesses can focus on the metrics and data that matter most to them. Whether it's sales performance, marketing campaign effectiveness, or customer engagement metrics, Looker Studio allows for the visualization of this data in a way that is both accessible and actionable.
By setting up automated reporting processes, users can ensure their reports are always up-to-date with the latest data. This not only saves time but also ensures that decision-makers have access to the most current insights, enabling them to act on trends and changes in real-time.
Here's why automated reporting in Looker Studio is indispensable:
Streamlined Processes
Automated reporting eliminates the repetitive manual tasks involved in generating reports. With Looker Studio, you can set up reports to auto-refresh and update automatically at predefined intervals.
This ensures stakeholders have access to the most current data without the need for manual intervention, streamlining the process from data collection to insight generation.
Consistent Data Access
In real-time business intelligence, the importance of having up-to-date information cannot be overstated. Automated reporting in Looker Studio ensures that all reports are consistently updated, providing businesses with the ability to react quickly to emerging trends, patterns, and potential issues.
This real-time access to data empowers teams to make swift, evidence-based decisions.
Error Reduction
Manual report generation is susceptible to errors, which can compromise the quality of insights derived from the data. Automation significantly reduces these risks by standardizing the reporting process.
Building reports in Looker Studio ensures data consistency and accuracy, providing a reliable foundation for analysis.
Enhanced Collaboration
Automated reporting fosters a culture of transparency and collaboration within organizations. Looker Studio allows for easy sharing of automated reports among team members, stakeholders, and clients, ensuring everyone is on the same page.
This collaborative environment enhances strategic alignment and facilitates more cohesive decision-making processes.
Customization and Flexibility
Looker Studio's automated reporting is not a one-size-fits-all solution; it offers extensive customization options to meet the unique needs of each business. Users can tailor reports to highlight the most relevant metrics and KPIs, adjust the visual presentation of data, and even set custom alerts for significant changes or milestones.
This level of customization ensures that automated reports are as relevant and actionable as possible.
Focus on Strategic Tasks
By automating the reporting process, businesses can redirect their focus from the operational aspects of report generation to more strategic tasks.
Both data analysts and decision-makers can spend more time on data interpretation, strategy development, and exploring new opportunities for growth and improvement.
OWOX BI complements Looker Studio's capabilities by simplifying the data preparation stage.
It automates the data collection from various sources into BigQuery, making it ready for analysis and reporting.
This includes complex data from marketing campaigns, sales records, customer interactions, and more. With OWOX BI, users can set up ad-hoc reports on the fly for immediate analysis or schedule regular report updates, ensuring that the data remains fresh and relevant.
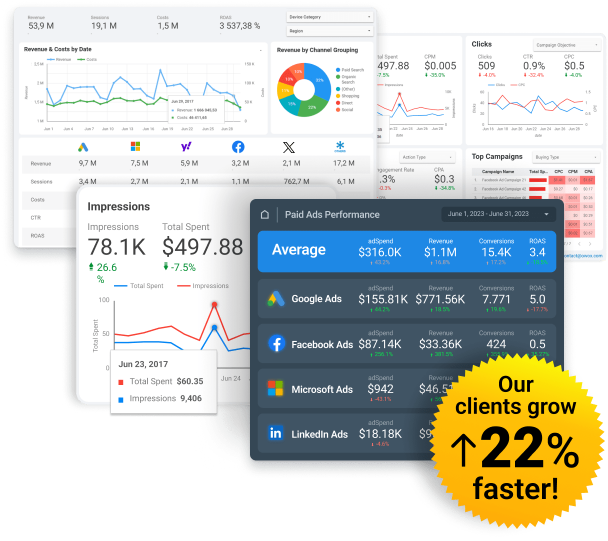
Gain clarity for better decisions without chaos
No switching between platforms. Get the reports you need to focus on campaign optimization
How to Automate Reports In Looker Studio With OWOX BI
Automating reports in Looker Studio with BigQuery data enhances the efficiency and accuracy of your data analysis and reporting processes.
Leveraging the powerful analytics capabilities of using Google BigQuery as a Data Warehouse alongside the dynamic visualization features of Looker Studio can transform the way you handle your reporting in the business.
When you add OWOX BI to this bundle of Google tools, you amplify your data quality and simplify data preparation, enabling a single source of truth and real end-to-end analytics.
OWOX BI acts as a bridge between the corporate data and stakeholders, simplifying the process of data collection from various sources, continious preparation of those data to up-to-date reports, and subsequent loading into BigQuery.
This ensures that your data is not only up-to-date but also structured in a way that's optimized for analysis in Looker Studio.
They can easily connect to almost any of your data sources: from Google Ads and Facebook, Twitter, Instagram, etc.
And after that, it’s easy to visualize data. Multiple sources can be connected to a single report within the same dashboard.
It's easy to share reports in Looker Studio with colleagues, providing them access to viewing or editing. No need for a colleague to have authorization, all they have to do is open the dashboard by clicking the link.
Here's a sample report in Looker Studio with the main KPIs and traffic sources of an online store:
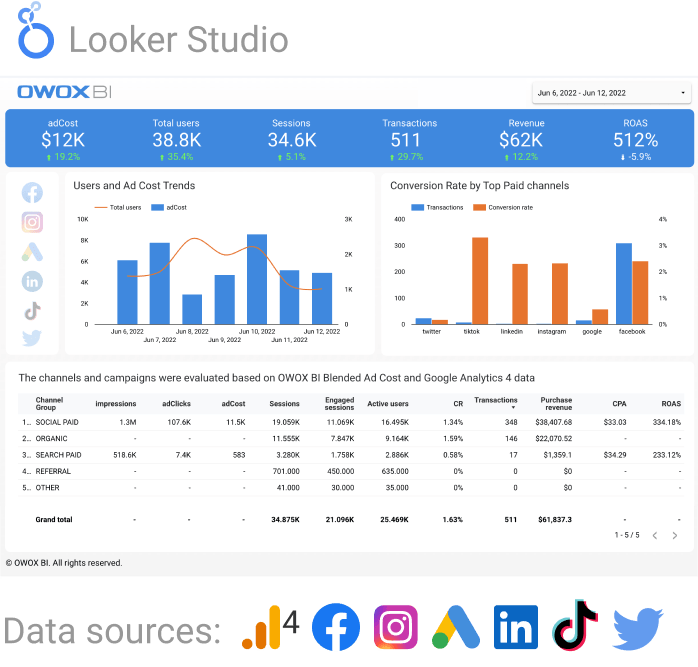
Google Analytics 4 & paid channels report template
Download templateThis is an interactive dashboard where you can see how metrics change across days, channels, device categories, etc. There are multiple pages within a single report.
Why it’s so convenient? Once you set up a dashboard and share a link with colleagues, then no more changes need to be made (unless you add new parameters). Just choose the right dates and get up-to-date information.Now let's explain how we can create such beauty. We collect all of the data into BigQuery for you to have a single source of truth, update automatically according to the specified schedule, and then - build your report based on data in your data warehouse.
- OWOX BI will help you automatically collect all data in GBQ:
- Actions of users on the site (unsampled, raw real-time data);
- Cost data from advertising services;
- Offline conversion data from your sales CRM;
- Other sales & marketing data;
- Email stats from email marketing tools.
- Once you have collected your data from different sources into BigQuery, you’ll have an SQL or no-SQL interface with ready-to-use templates to prepare those data into meaningful tables for reporting.
- Finally, you’ll copy one of our ready-to-use templates in Looker Studio, connect the table with your data in GBQ, and share that report with your team or stakeholders.
OWOX BI has a free trial option with no limitations — collect & merge all your data and build any marketing report in Looker Studio for free.
Hassle-free data analysis and reporting
Easily collect, prepare, and analyze marketing data. Stay on top of your marketing performance
4.9
Key Takeaways
Automating reports in Looker Studio with BigQuery data, and adding OWOX BI for data collection and preparation, offers a powerful and efficient solution.
The combination of Google BigQuery's analytics, Looker Studio's visualization capabilities, and OWOX BI's integration and automation facilitates a streamlined workflow for bridging the gap between the data and decision-making.
FAQ
-
What is BigQuery, and how does it integrate with Looker Studio for report automation?
BigQuery is a serverless data warehouse that integrates with Looker Studio for scalable data analysis and visualization, enabling efficient report automation by querying and displaying data directly. -
Can I automate data refreshes in Looker Studio reports using BigQuery?
Yes, Looker Studio allows for automated data refreshes from BigQuery by setting up data sources to regularly update reports, ensuring real-time data analysis. -
How do I connect BigQuery to Looker Studio to create automated reports?
Connect BigQuery by selecting it as a data source in Looker Studio, choose your project and dataset, and then design your report using the connected data. -
Are there any costs associated with using BigQuery for report automation in Looker Studio?
BigQuery operates on a pay-as-you-go model, with charges based on data queries and storage, though a free tier is available for smaller datasets and queries. -
What types of data can I analyze in Looker Studio reports using BigQuery?
BigQuery supports analyzing a wide range of data types, including structured and semi-structured data, suitable for diverse analytical use cases in Looker Studio. -
How can I ensure my Looker Studio reports remain up-to-date with the latest data from BigQuery?
Ensure reports stay current by configuring Looker Studio to automatically refresh the data source from BigQuery at regular intervals, facilitating up-to-date data analysis.
Get in-depth insights

Get in-depth insights
Top 30 Handpicked Google Looker Studio Dashboards for Marketers

