Content
- What is marketing analytics?
- Key Components of Marketing Analytics
- Why your brand needs marketing analytics
- How to correctly evaluate the effectiveness of marketing investment
- Growing Your ROI with 3 Main Marketing Analytics Drivers
- How businesses use marketing analytics
- Implement Marketing Analytics with OWOX BI
The Art of Marketing Analytics: A Deep Dive
Ievgen Krasovytskyi, Head of Marketing @ OWOX
Welcome to the world of marketing analytics - the simple way to revolutionize your marketing strategies. In this comprehensive guide, we introduce the world of data, providing you with the knowledge and tools to use its full potential for optimizing marketing performance. Let’s dive right in so you win the marketing game.

What is marketing analytics?
Marketing analytics is the process of collecting, measuring, analyzing, and interpreting data related to marketing efforts. It involves using data and statistical analysis to evaluate the performance of marketing campaigns, strategies, and channels to make informed decisions and optimize future marketing efforts.
Marketing data analytics usually includes 3 core components: analyzing the present, reporting on the past, and predicting the future.
- Track present in real-time: Marketers need to correctly evaluate the effectiveness of the current campaigns and activities to get a clear picture of where their current marketing efforts are and to compare them to data from past campaigns. In this case, they’ll be focused on ads performance, website traffic, source/medium breakdown, social media engagement, user behavior, and click-through rate, as well as the current state of the orders or revenue metrics.
- Consider the past: Marketing leaders and their teams also rely on marketing analytics reporting about completed campaigns, or just the history of the campaign performance, focusing on the conversion and retention metrics, such as customer lifetime value (LTV), average revenue per user (ARPU) or sales funnel churn rate.
- Predict the future: Last but not least, marketers should be able to use past experience, and results to predict the performance of future campaigns or projects. This is typically about conversion modeling, lead scoring, content distribution, and upselling opportunities and relies on the data that is already collected, as well as modeling, machine learning (ML), or artificial intelligence (AI).
Let’s summarize this: Marketing analytics plays a crucial role in helping businesses understand their customers, grow ROI, and reach their marketing goals.
Important to note: Marketing analytics doesn't directly influence ROI, but that's the most efficient way to save your time and make informed decisions to reduce ad waste, optimize the most profitable campaigns, and as a result - boost ROI.
Key Components of Marketing Analytics
Data Collection
Marketing analytics starts with collecting relevant data. You can collect all sorts of data from multiple sources such as advertising platforms, on-site analytics tools, social media, email marketing tools, and CRM systems. It’s very important because analytics is always about data, as the main unit of information.

Real-Time User Behavior Tracking
Tracking user behavior in real time is essential for comprehensive marketing analytics. It provides insights into how users interact with your digital assets: visiting the web pages, clicking the CTA buttons, filling out the forms, or making a payment. Analytics is about tracking and it’s crucial for an effective marketing strategy.
Data Processing
Once data is collected, it needs to be processed and organized into a format that is suitable for analysis. This often involves transforming data into a business-ready format, ensuring uniformity and compatibility among different data sources. Analytics is about the system and it should be holistic, built upon the harmonization of various data elements.
Reporting and Visualization
Once data is unified, consistent, and matchable - it’s time for data visualization. Visual, aesthetically pleasing reports facilitate the communication of insights and findings to stakeholders within your team or organization, expediting decision-making processes.
Key Performance Indicators (KPIs)
But what are the metrics that should be calculated and visualized?
Сommon marketing metrics include conversion rates between funnel stages, cost per click, cost per lead, cost per order, and more. By the end of the day, there are just 3 main KPIs for most of the businesses:
- Customer Acquisition Cost (CAC)
- Customer Lifetime Value (LTV)
- Return on Investment (ROI).
These metrics serve as critical benchmarks because analytics is about measuring marketing efforts and effectiveness.
If you're eager to explore these KPIs further and gain a deeper understanding of how they can steer your marketing strategies, we invite you to watch this webinar recording:
Insights
Marketing analytics empowers businesses with a deeper understanding of their target audience. It provides insights into customer behavior, preferences, demographics, and geographical data.
Armed with this knowledge, businesses can transform data into actionable insights and tailor their marketing strategies to align with customer needs, ensuring that the right message reaches the right person in the right place at the right time.
Marketing data analytics is about decisions - and ideally, if those decisions are backed with trusted data.
Optimization
Relying on insights and campaign metrics, businesses can optimize their marketing strategies, e.g., optimize cross-channel budget allocation. By identifying what works and what doesn't, resources can be allocated more effectively, and overall marketing performance can be enhanced. Marketing decisions will be ideally data-backed.
Marketing Attribution
Marketing attribution plays a vital role when multiple touchpoints drive the conversion. For instance, if a customer interacted with a Google ad, a Facebook ad, a few emails, a LinkedIn ad, and a personal phone call before converting, each of these touchpoints should be rewarded with a portion of the sale amount. A proper attribution model ensures the most accurate assessment of marketing channels' effectiveness (for your specific business needs).
Uncover in-depth insights
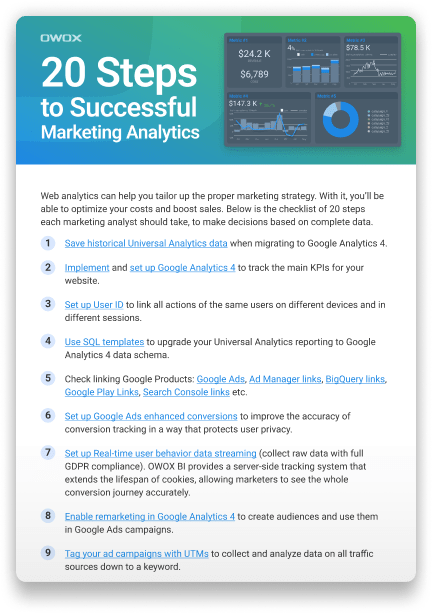
20 Steps to Successful Marketing Analytics
Download nowBonus for readers

If you’d like to learn more about how you can get the marketing attribution model your business needs, and how to evaluate an incremental value of each paid click check out THIS webinar so you are equipped with the knowledge to drive campaign performance and maximize ROI.
Predictive Analytics
Predictive analytics leverages historical data to forecast future trends and outcomes. It aids in making informed decisions, optimizing campaigns, anticipating customer behavior, demand forecasting, risk assessment, and marketing trends prediction. Incorporating predictive analytics into your strategy allows you to enlarge your marketing effectiveness and success in an ever-evolving business landscape.
For an in-depth dive into this topic, we recently hosted a webinar on “How conversion modeling helps to measure marketing efficiency in a post-cookie world”. If you missed it, don't worry! You can catch the recording here:
Marketing analytics is an iterative and never-ending process. Businesses constantly gather and analyze data to refine their marketing strategies and adapt to changing market conditions.
The ultimate goal is to increase sales and revenue, making analytics a part of every business operation.
Why your brand needs marketing analytics
In today's competitive landscape, marketing analytics is no longer optional; it's essential. It empowers brands to make correct business decisions, save time on data preparation, increase ROI and revenue, create targeted strategies, and detect and address potential issues before they escalate.
Marketing analytics enables data-driven marketing, ultimately leading to improved results.
Make correct business decisions
Marketing analytics empowers you to make informed decisions that are both quantitative and qualitative. For instance, it helps you decide on crucial aspects like cross-channel or cross-campaign budget allocation, ensuring your resources are optimally distributed for maximum impact.
Save time on data preparation
With marketing analytics, you can bid farewell to the tedious task of data preparation, freeing up valuable time that can be better spent on creative endeavors and strategic decision-making. It's time to focus on aspects that can't be outsourced, like crafting compelling campaigns and strategies.
Grow ROI & revenue
The quality of your data directly impacts your decisions. Bad data leads to poor decisions, wasting your time and resources. In contrast, marketing analytics enables you to harness quality data, resulting in better decisions, increased revenue, higher profits, and ultimately, improved return on investment (ROI).
Create targeted strategies
With marketing analytics, you gain the ability to craft targeted strategies. By delivering the right message to the right audience at the right time and place, you can significantly enhance your conversion rates. Don't miss the opportunity to leverage the power of mass personalization.
Detect small problems before they become big
Marketing analytics acts as your early warning system, allowing you to spot and address small issues before they escalate into major problems. This means you can identify inefficient ad spend that may appear profitable on the surface but is wasting valuable resources.
How to correctly evaluate the effectiveness of marketing investment
Evaluating the effectiveness of marketing investments involves multiple strategies. The goal is to assess ROI accurately and make data-driven decisions. To estimate the effectiveness of your marketing investment, it's crucial to analyze various aspects of your campaigns. Here are key methods and considerations:
Campaign Performance Analysis
You need to understand what worked, and what didn't, and how to improve future campaigns for fine-tuning marketing strategy and maximizing ROI. During this analysis, key performance indicators (KPIs) are closely scrutinized to assess the impact of each campaign. You should closely watch such metrics as conversion rates, click-through rates, return on ad spend (ROAS), and cost per acquisition (CPA).
This aims to identify which campaigns delivered the best results and which may need adjustments or reallocation of resources.
Cross-Channel Report
Cross-channel reporting is your window into the collective performance of various marketing channels. This holistic perspective empowers data-driven decision-making and optimization of your marketing efforts. Look comprehensively at your marketing efforts across all channels, providing insights into how each channel contributes to your overall strategy.
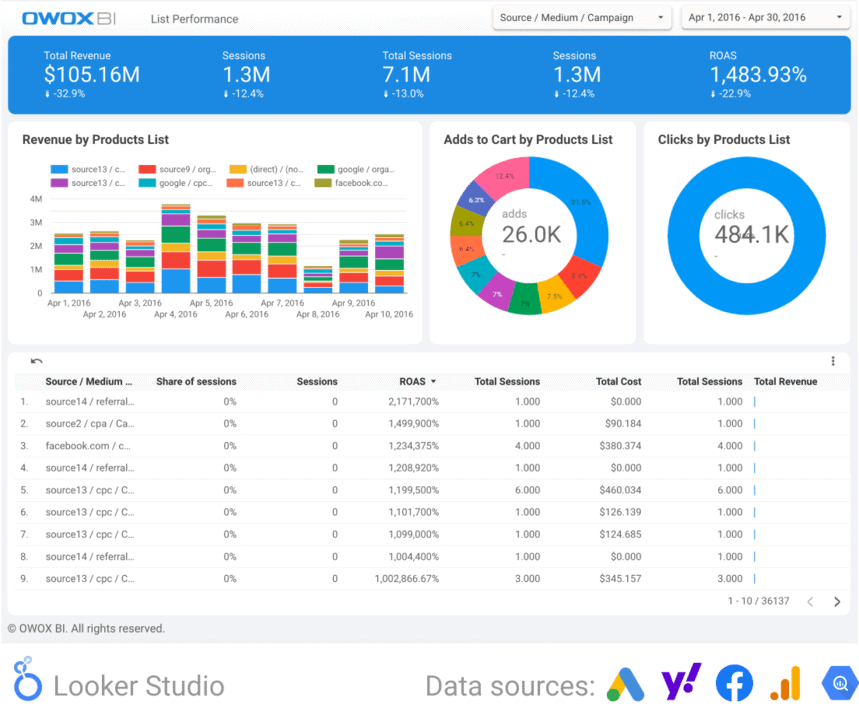
Create a unified report that consolidates data from all marketing sources and platforms. The power of a cross-channel report lies in its visual representation. Charts, graphs, and visualizations make it easy to spot trends, anomalies, and areas for improvement across your entire marketing ecosystem.
Marketing Attribution
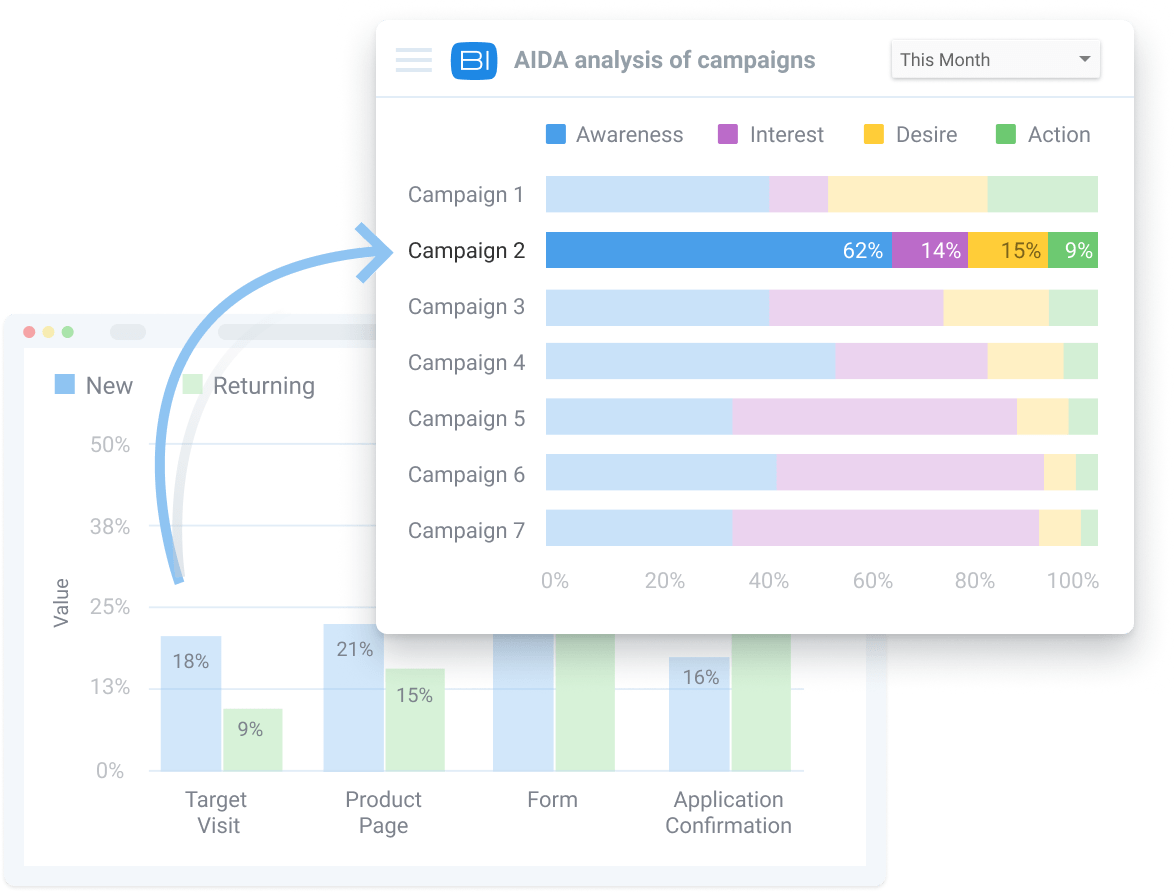
Apply different attribution models to your data and evaluate the attribution models to help you understand the impact of different marketing channels on conversions. Different models distribute credit to various touchpoints differently.
Standard attribution models include:
- First Click: Attributes all credit to the first interaction.
- Last Non-Direct Click: Attributes credit to the last interaction that was not direct.
- Linear: Distributes credit equally across all touchpoints.
- Time Decay: Gives more credit to recent touchpoints.
- U-shaped (Position Based): Attributes more credit to the first and last interactions, with less for intermediate ones.
Experiment with different attribution models to find the one that best aligns with your business goals and use marketing dashboards to make the decision-making process easier.
When creating marketing dashboards, keep these principles in mind:
- Visualization: Focus on visualizing key performance indicators (KPIs) and metrics that directly impact your marketing goals.
- Automation: Ensure that your dashboards are automated. Your analytics solution should collect, process, and store data, then prepare it for reporting and visualization automatically. This ensures that your dashboards provide real-time insights without manual intervention.
Report by product category
For businesses with a diverse product range, analyzing performance by product category is crucial. This approach provides granular insights into which product lines are thriving and which may need extra attention. Metrics like sales volume, conversion rates, and revenue generated can help you understand which categories are performing best.

Allocate resources to categories that are performing well, identify opportunities for cross-selling or upselling, and address underperforming categories with targeted marketing efforts.
RFM Analysis
RFM analysis stands for Recency, Frequency, and Monetary analysis, a technique that helps businesses understand their customers' behavior in-depth. You may consider analyzing customer segments based on how recently they made a purchase, how often they buy, and how much they spend.
This helps in targeting high-value customers and tailoring marketing efforts to different segments. Try out a template for RFM analysis.
Cohort Analysis
Cohort analysis is a powerful tool for understanding how different groups of customers behave over time. Instead of looking at all customers as a single entity, cohort analysis divides them into smaller groups based on common characteristics or events. It helps you understand the unique life cycles of different customer groups, enabling you to make data-driven decisions.
By applying cohort analysis, you can refine your marketing strategies, boost customer retention, measure ad performance, and ultimately enhance your business's long-term success.
Growing Your ROI with 3 Main Marketing Analytics Drivers
To enhance your return on investment (ROI) using marketing analytics, it's essential to focus on key drivers that can drive better results. Below we’ve collected three primary drivers. By implementing these drivers effectively, you can not only improve your marketing ROI but also make data-driven decisions that lead to more successful and efficient marketing campaigns.
Driver #1: Reduce AdWaste
Cross-Channel Budget Allocation
Efficiently allocate your budget across different marketing channels and campaigns based on your performance.
Identify which campaigns generate the highest ROI and reallocate resources from underperforming ones. This should be based on user behavior and sales data from your CRM rather than just ad platform data (e.g., Facebook ads, and LinkedIn ads).

Effort Optimization
Optimize your efforts across non-paid channels like social media marketing, email marketing, and content marketing. You don’t have to pay to share your message, but there is a hidden cost of content creation.
Identify the most effective channels and allocate your team’s efforts and resources accordingly.
Driver #2: Behavior Insights
When you collect on-site analytics, with tools like Google Analytics 4 or OWOX BI Streaming, you get the data about how your visitors are acting on your site.
Audience Segmentation and Targeting
Segment your audience into distinct groups based on their behavior and preferences. Target these segments with tailored marketing messages and campaigns that align with their specific needs.
Personalization
Customize marketing content and messages for individual customers based on their preferences and behaviors. Personalization often leads to higher engagement and conversion rates.
Conversion Rate Optimization
Analyze user behavior data to understand how users move through the sales funnel and identify where they drop off. Make data-driven changes to landing pages, forms, and calls to action to increase conversion rates.
Driver #3: Artificial Intelligence and Machine Learning
The third driver is all about using modern technologies in marketing: Artificial Intelligence (AI) and Machine Learning (ML).
ML Funnel-based Attribution
Utilize machine learning to create funnel-based attribution models. This model distributes credits to various touchpoints in the customer journey, ensuring a fair assessment of each component's contribution to conversions.
Conversion Modeling
Use machine learning to estimate the impact of marketing efforts when certain conversions cannot be directly observed. This helps in quantifying the value of campaigns with less tangible outcomes.
Predictive Analytics
Leverage historical data to forecast future trends and potential marketing outcomes. Predictive analytics enables proactive adjustments to marketing strategies, capitalizing on opportunities, and mitigating risks.
How businesses use marketing analytics
Marketing analytics offers a wide range of use cases to improve marketing strategies and drive better results.
Let’s dive deeper into some of the use cases:
Create a recommendation system for the items that suit the best
Develop a recommendation system that suggests the most suitable items to specific users. This personalization enhances the user experience and can boost sales.
Define the best items for upsell/cross-sell and personalized offering
Identify the best opportunities for upselling and cross-selling products or services. Tailor your offerings to individual customers based on their preferences and behavior.
Create audiences
Segment your audience into distinct groups based on demographics, behavior, or other criteria. This allows for more precise targeting of marketing campaigns.
Predict LTV and Sales
Predict the lifetime value of your customers to allocate resources more effectively and understand the long-term impact of your marketing efforts. Utilize predictive analytics to forecast future sales trends, adjust strategies, plan inventory, and optimize marketing campaigns accordingly.
Build ad-hoc reports
Generate custom ad-hoc reports to assist with specific questions or unique business challenges. Unlike standard reports, which follow predefined templates, ad-hoc reports are designed to answer your unique needs or requests and address specific business challenges.
Understand the user behavior, make assumptions & test
Analyze user behavior data to gain a deep understanding of how customers interact with your products or services. Make informed decisions based on these insights, leading to improved conversion rates and revenue.
Implement Marketing Analytics with OWOX BI
OWOX BI provides a comprehensive solution for marketing analytics implementation for businesses of all sizes. By integrating data from multiple sources, automating processes, and offering advanced analytics, OWOX BI empowers brands to make data-driven decisions, optimize marketing efforts, and achieve better ROI. Choose us for a streamlined analytics journey.
Boost your marketing ROI with OWOX BI
FAQ
-
What role do data warehouses and data lakes play in marketing analytics?
Data warehouses centralize and organize data for analysis, providing a single source of truth. Data lakes store raw data for more flexible analysis. Both are vital in marketing analytics for data. -
What are the technical challenges of marketing attribution modeling?
Challenges include the complexity of multi-touch attribution, handling of cross-device and cross-channel data, and the need for advanced statistical models. -
What are the common data sources for marketing analytics, and how do I integrate them?
Common data sources include CRM systems, web analytics tools, ad platforms, and social media. Integration is achieved through APIs, data connectors, and data warehousing. -
What is the role of data transformation in marketing analytics, and what methods are commonly used?
Data transformation is essential in marketing analytics, converting raw data into structured formats for analysis. Common methods include data cleaning to detect and rectify errors, data enrichment to incorporate external data, data aggregation for summarizing detailed data, data normalization to ensure uniform scales, and data filtering for focused analysis. Automation, like ETL processes, can streamline these transformations. These methods collectively ensure data readiness for meaningful marketing analysis. -
How can I ensure data accuracy and consistency in marketing analytics?
You can ensure data accuracy through regular validation, cleaning, and reconciliation processes. Employ data governance practices and standardized data collection methods. -
How do marketing analytics tools handle data privacy and compliance with regulations like GDPR and CCPA?
Marketing analytics tools address data privacy and compliance through encryption for data security, role-based access controls for authorized data access, and anonymization to protect PII. These tools provide audit trails and data lineage to monitor access and maintain compliance records. Regular updates keep tools aligned with evolving regulations. -
Is predictive analytics suitable for businesses with limited historical data?
While it's more challenging with limited data, predictive analytics can still be valuable. Focus on smaller-scale models, utilize external data sources, and employ simpler algorithms. -
What are some common challenges in implementing marketing analytics?
Common challenges include data silos, poor data quality, talent shortages, and the need for continuous optimization. -
How can I ensure data privacy and compliance with marketing analytics?
To ensure data privacy and compliance, implement strict access controls, anonymize personally identifiable information (PII), and regularly audit data processes against GDPR, CCPA, and other regulations.


