OWOX Blog
1017 pieces, newest first
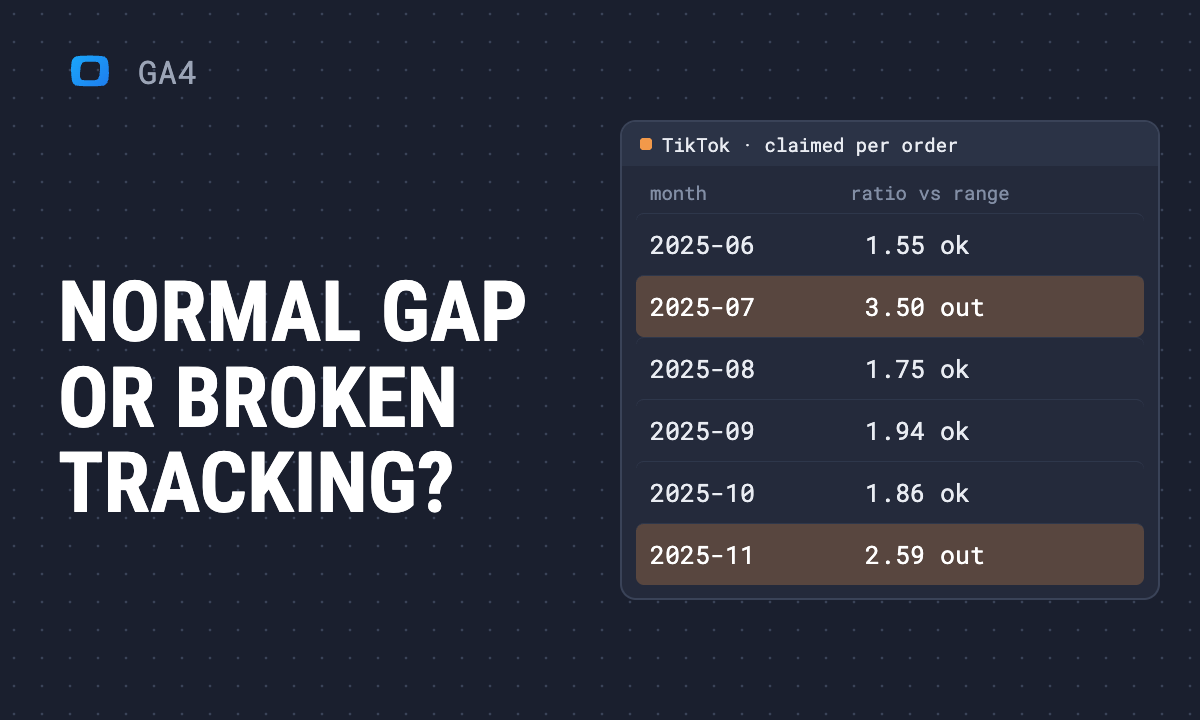 Article · GA4GA4, Google Ads and CRM Gaps: Normal or Broken Tracking?
 Article · Analytics ToolsOWOX Data Marts vs Connected Sheets: Which One Fits Your Reporting
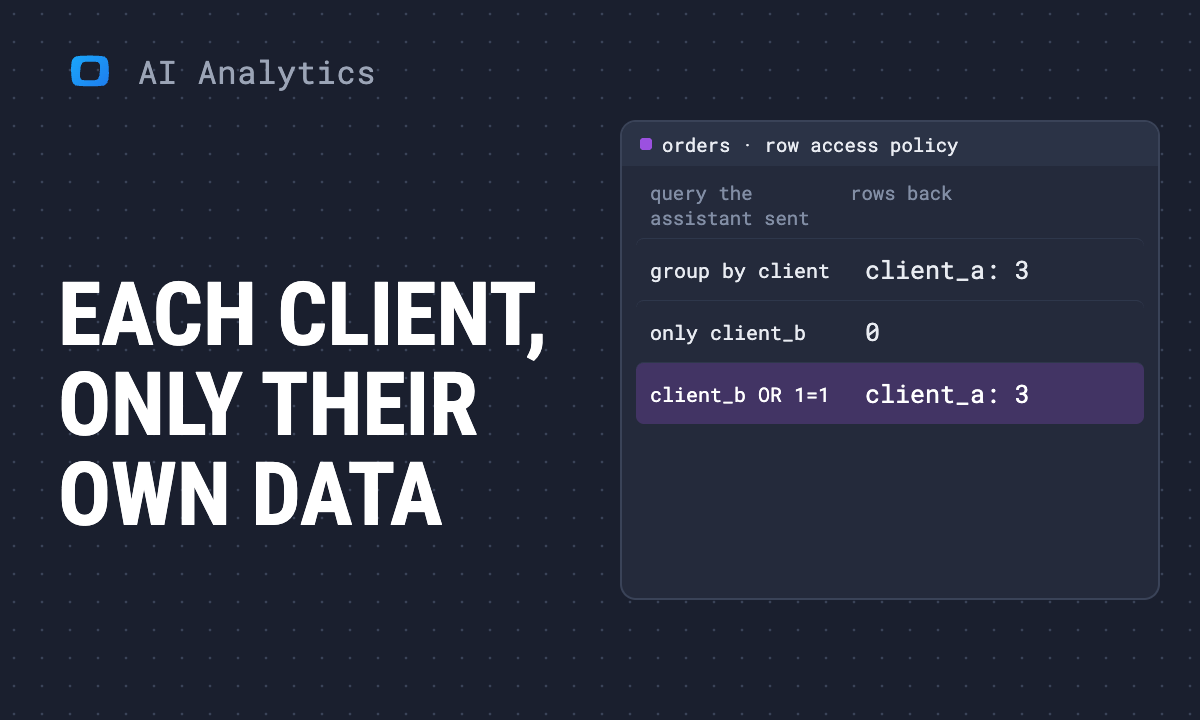 Article · AI in AnalyticsHow to Let Each Client Ask an AI Assistant About Only Their Own Data
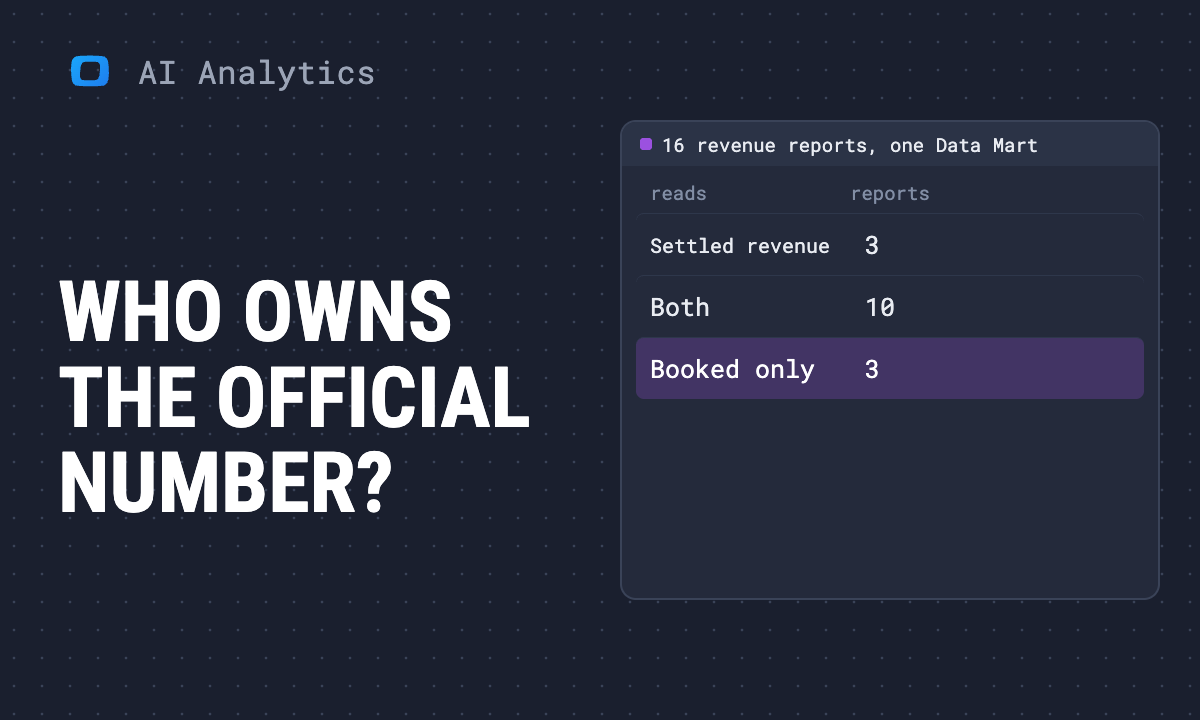 Article · AI in AnalyticsWhen Everyone Builds Their Own AI Dashboard: How the Analytics Team Stays the Source of Truth
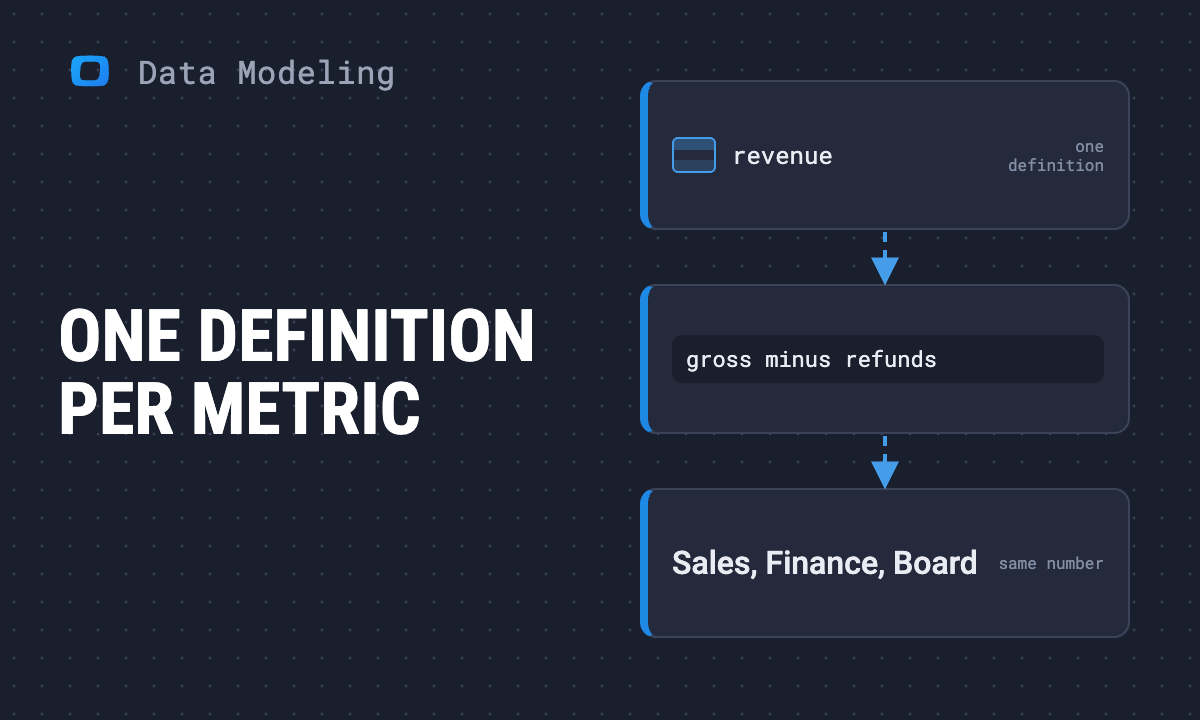 Article · Data ModelingKey benefits of data modeling for business reporting
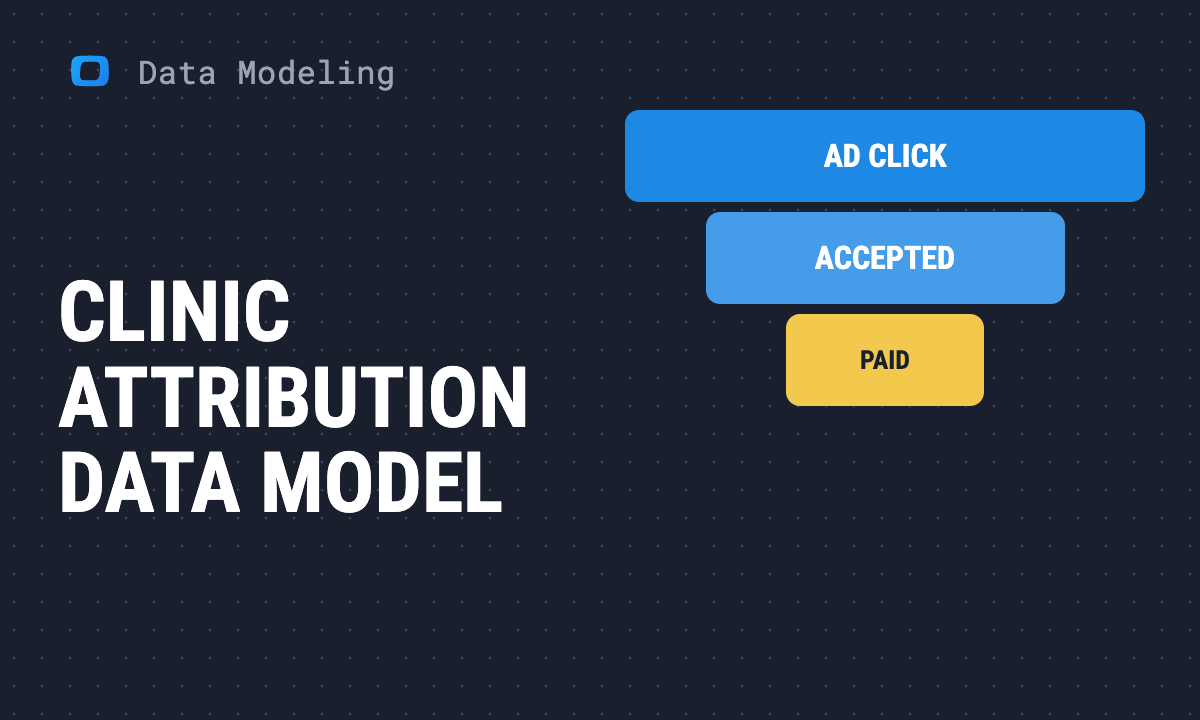 Article · Data ModelingClinic Attribution Data Model: From Ad Click to Paid Visit on One Identity
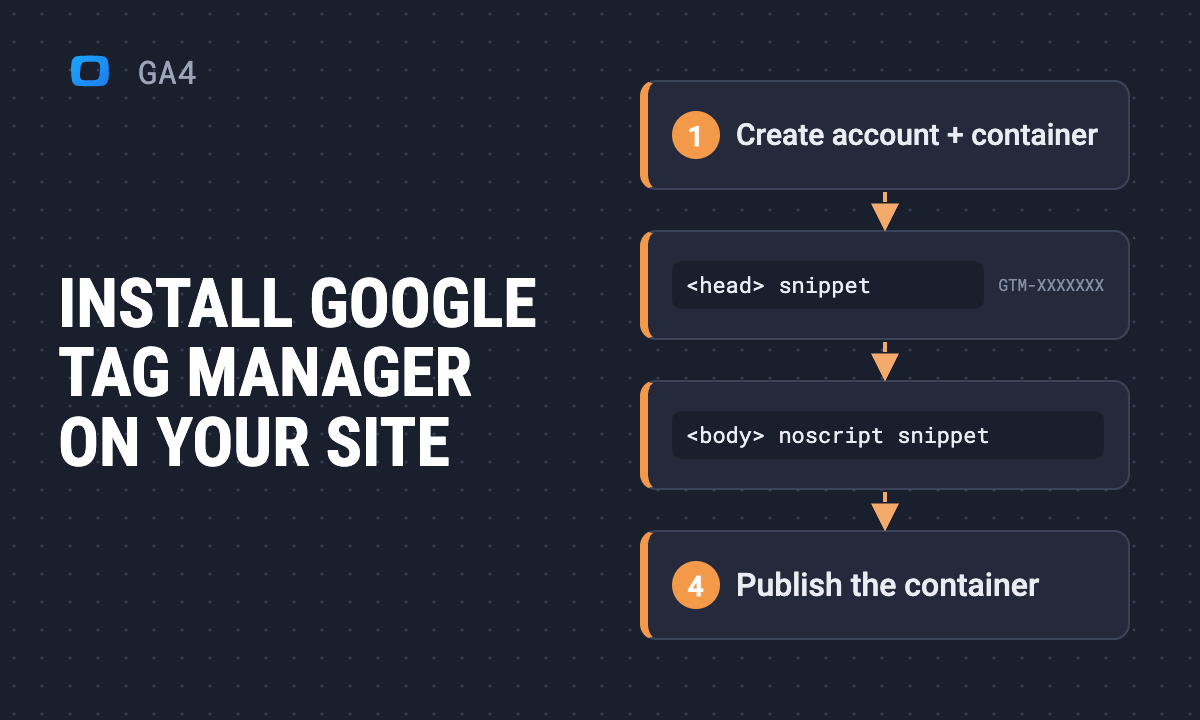 Use case · GA4How to install Google Tag Manager (GTM) on your website
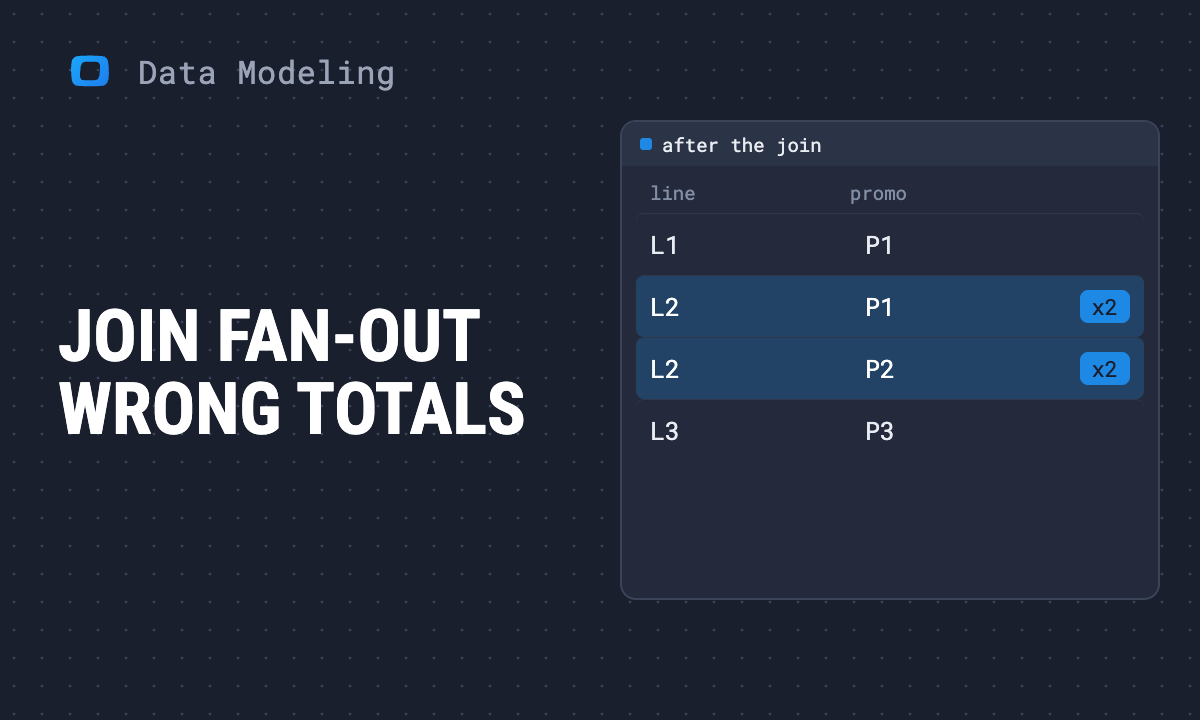 Article · Data ModelingWhy Your Totals Are Silently Wrong after a Join: Finding Fan-Out before the Number Ships
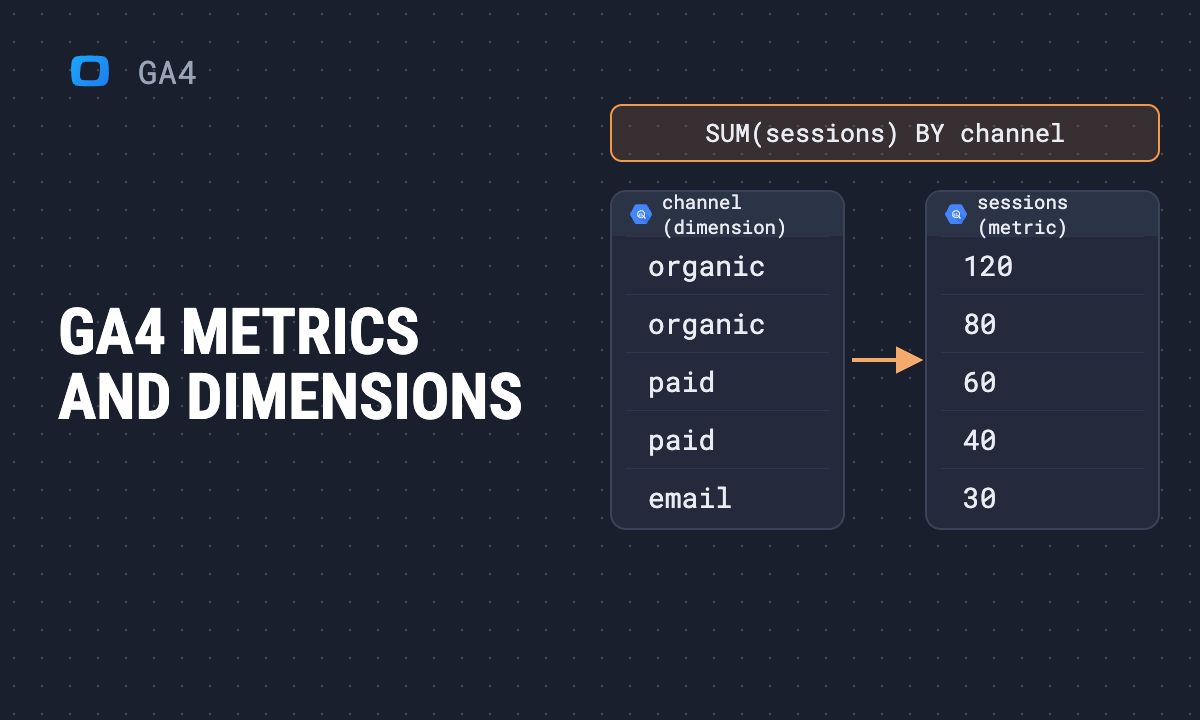 Article · GA4Google Analytics 4 metrics and dimensions: the key ones explained
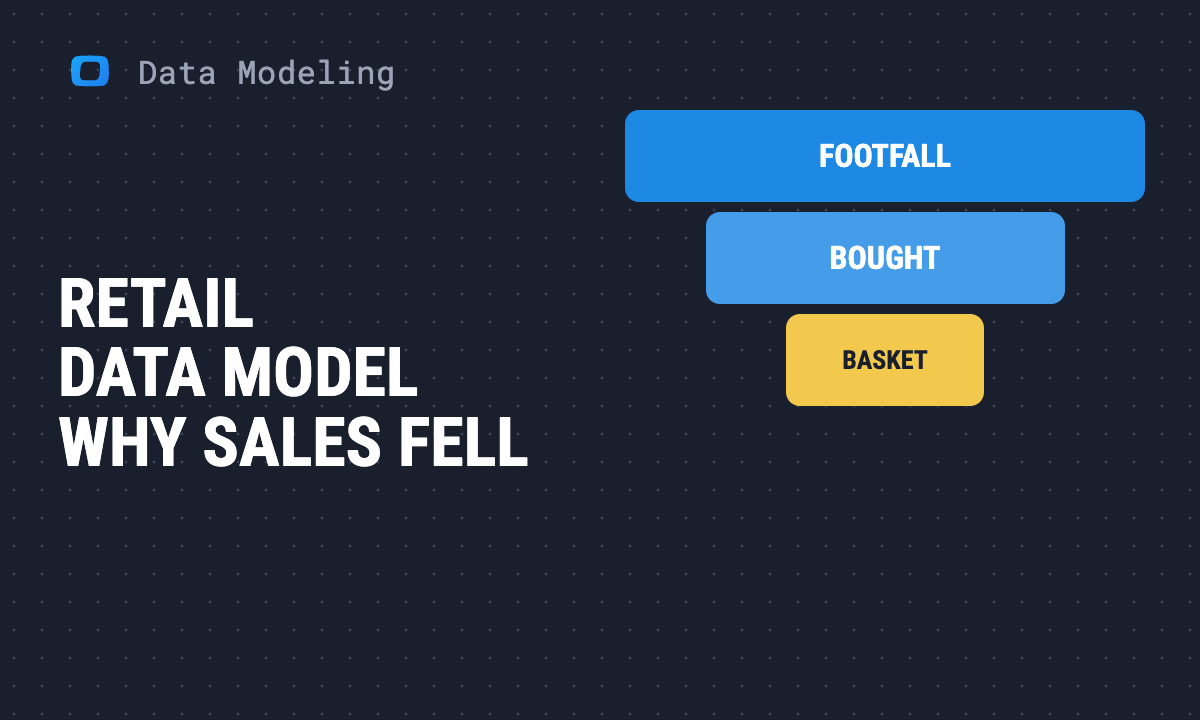 Article · Data ModelingRetail Data Model: Tables, Keys and Why a Store's Sales Fell
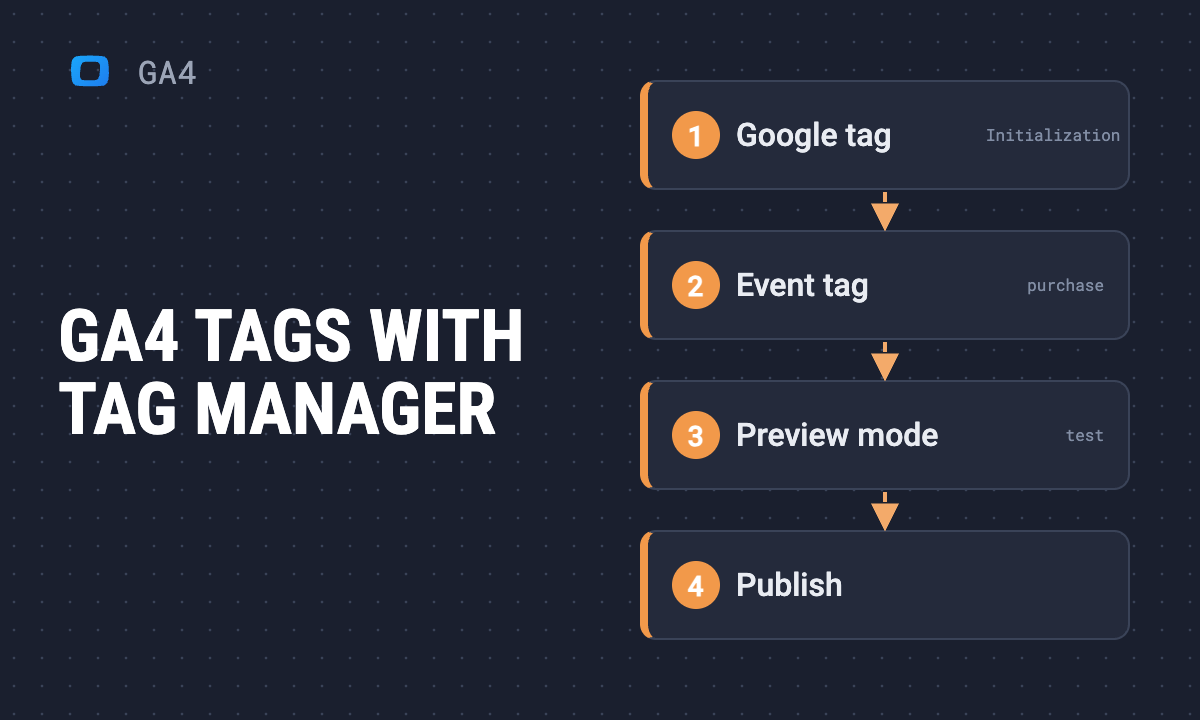 Article · GA4How to set up GA4 tags with Google Tag Manager
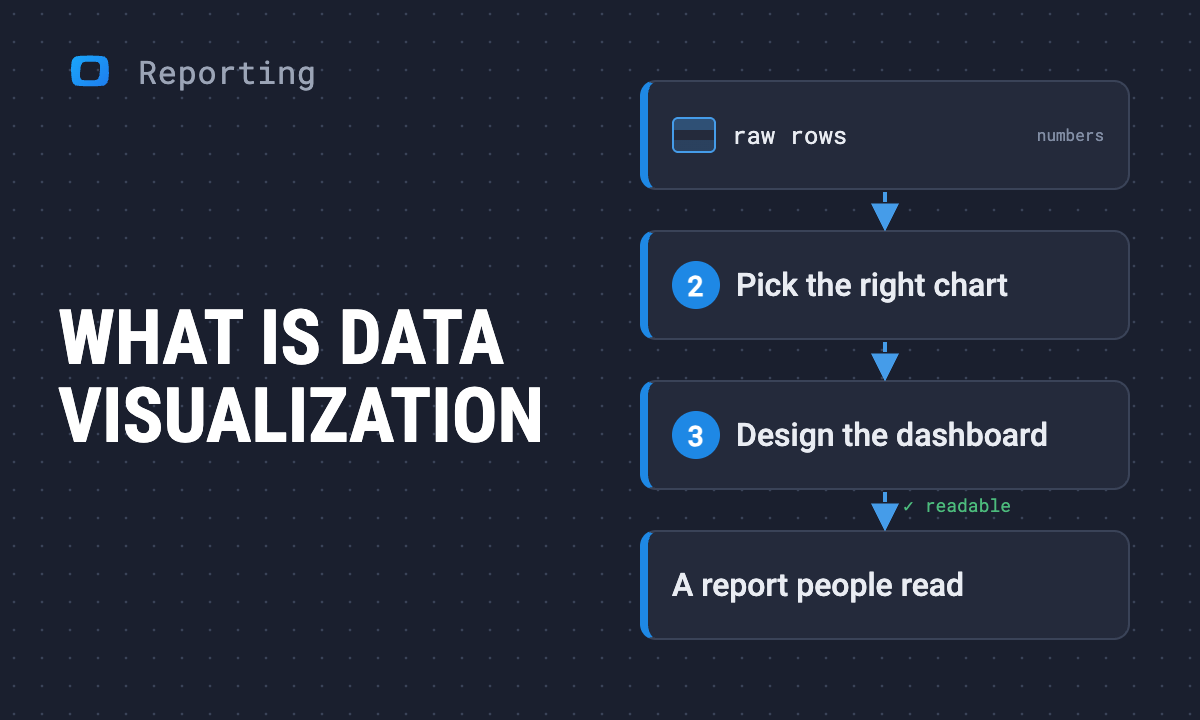 Article · ReportingWhat is data visualization: Definition, methods, principles and tools
 Article · Data ModelingDimensional data modeling: concepts, techniques and best practices
 Article · ReportingHistogram vs bar graph: Key differences, shown on one dataset
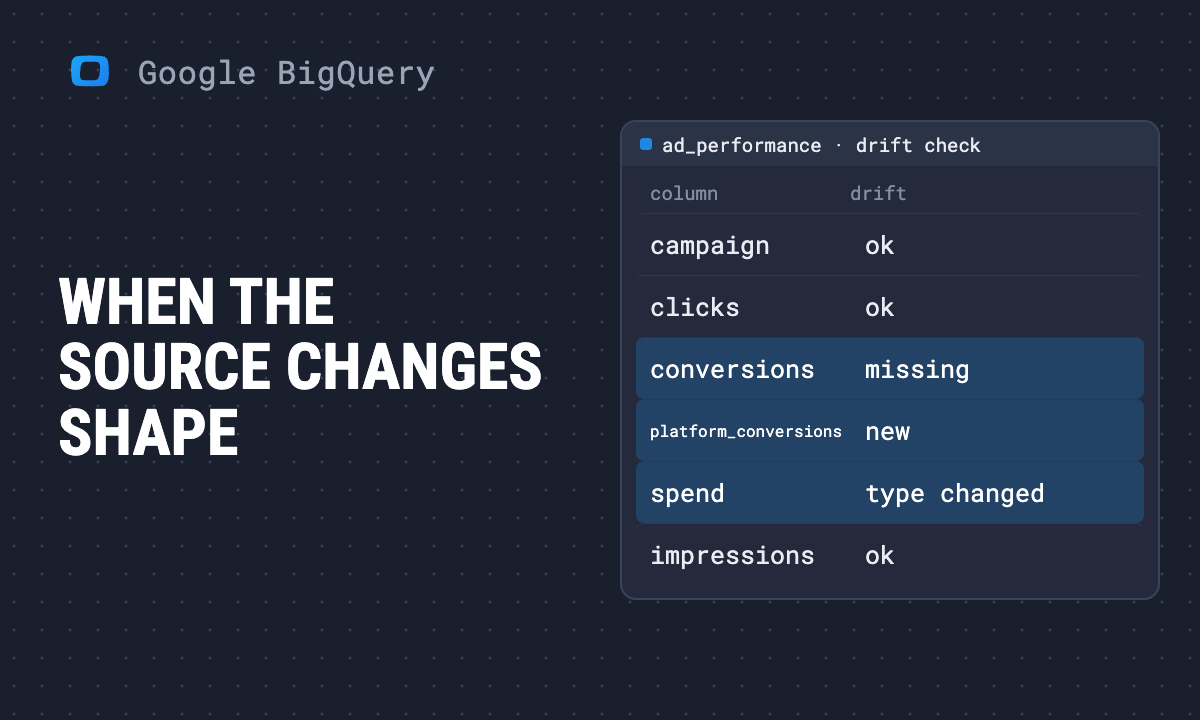 Article · Google BigQueryWhy Home-Grown Marketing Data Loaders Break on Schema Drift, and How to Make Them Survive It
 Article · Data ModelingStar schema vs snowflake schema: 10 key differences
 Article · Marketing AnalyticsThe essential guide to data analytics
 Article · ReportingTypes of charts and graphs: 21 chart types and when to use each
 Article · Data ModelingWhy every SaaS product team needs a data model
 Article · Data ModelingMarketing ROI on Booked Revenue, Not Platform Revenue
 Article · Data ModelingPayouts That Reconcile and MRR From the Source: Stripe Beside the Books
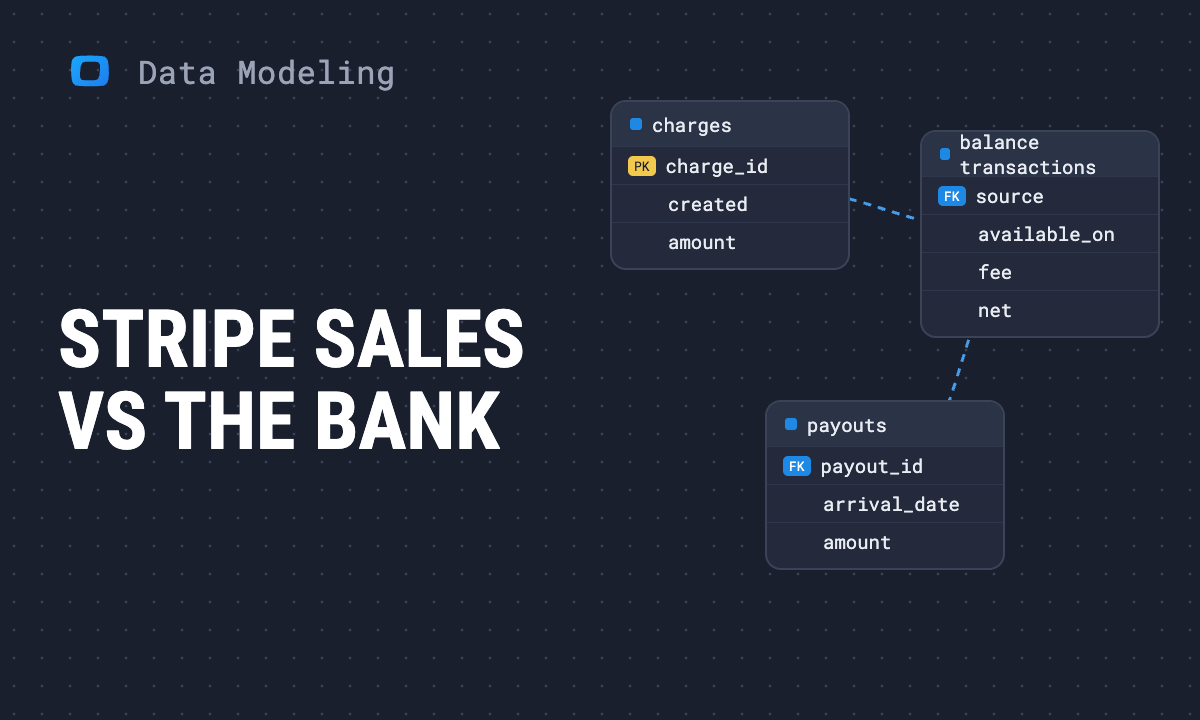 Article · Data ModelingWhy Your Stripe Sales and Your Bank Deposits Never Match
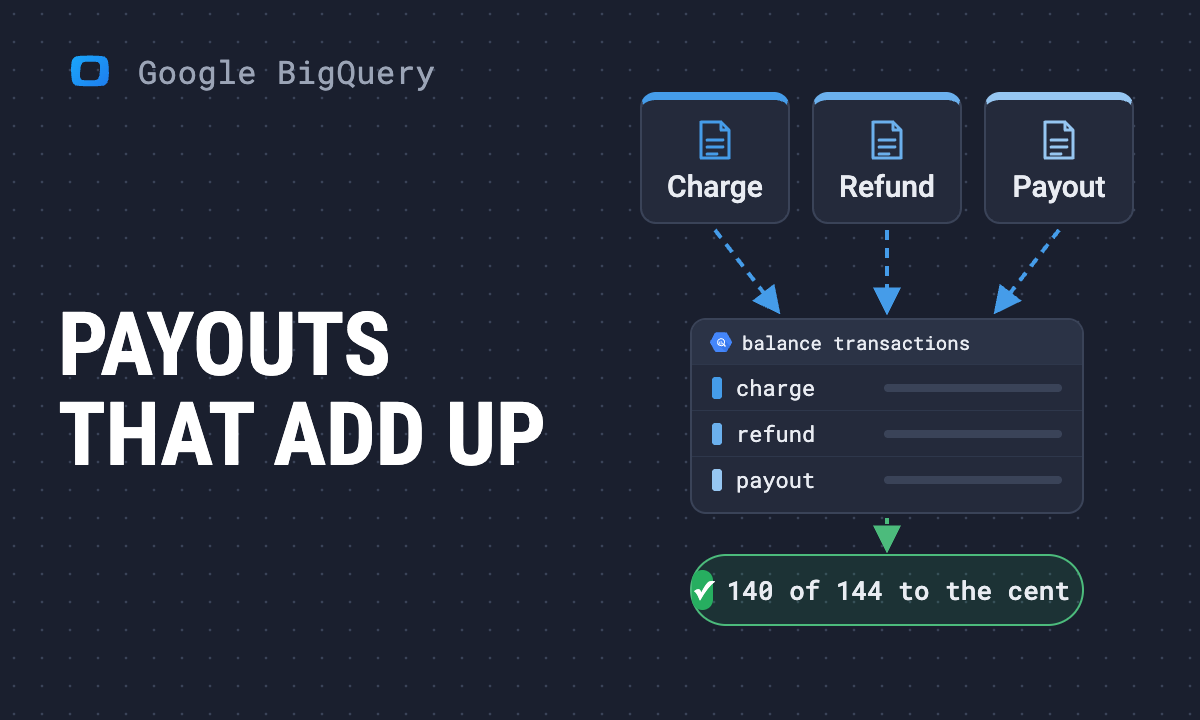 Article · Google BigQueryStripe to BigQuery: Load the Payments and Reconcile Them to the Payouts
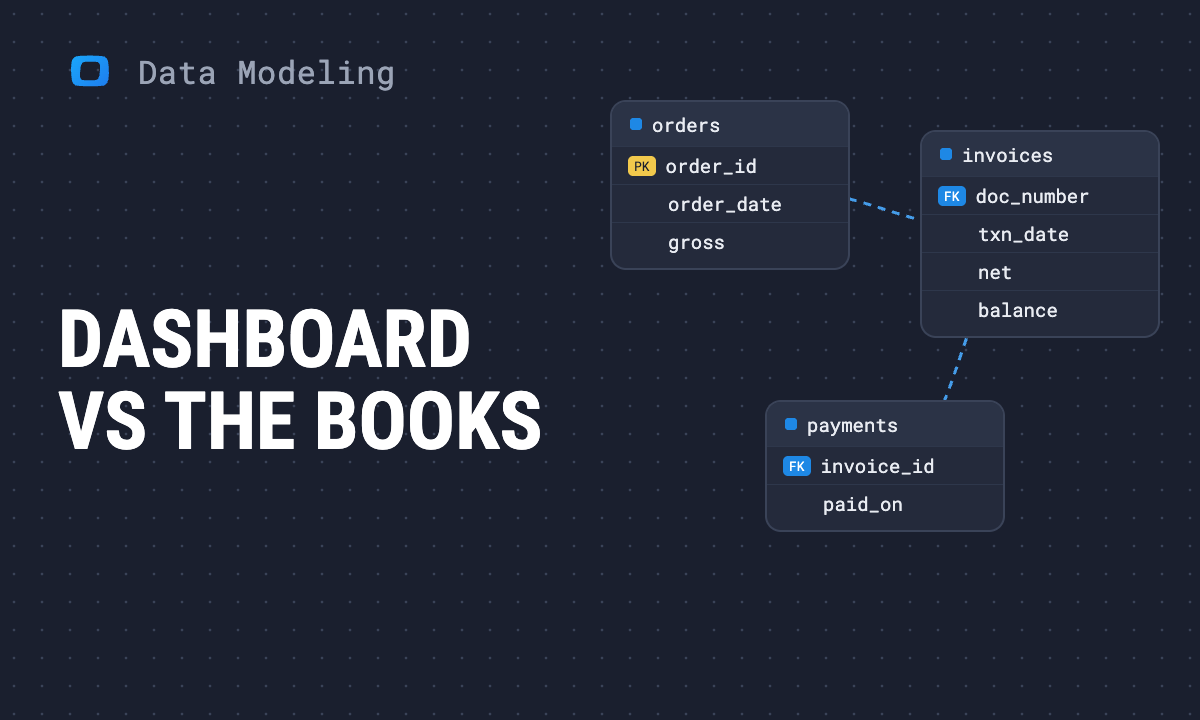 Article · Data ModelingWhy Your Dashboard and Your Accountant Disagree on Revenue
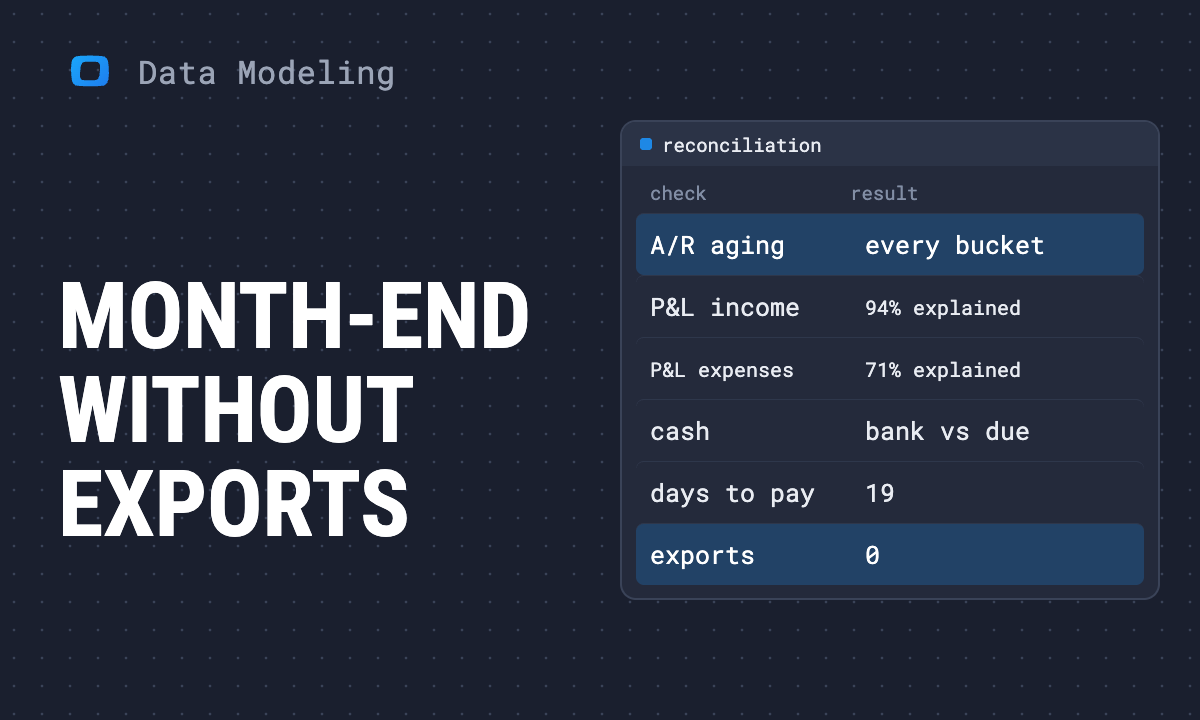 Article · Data ModelingMonth-End Without Exports: A/R Aging, Cash and the P&L Beside the Orders
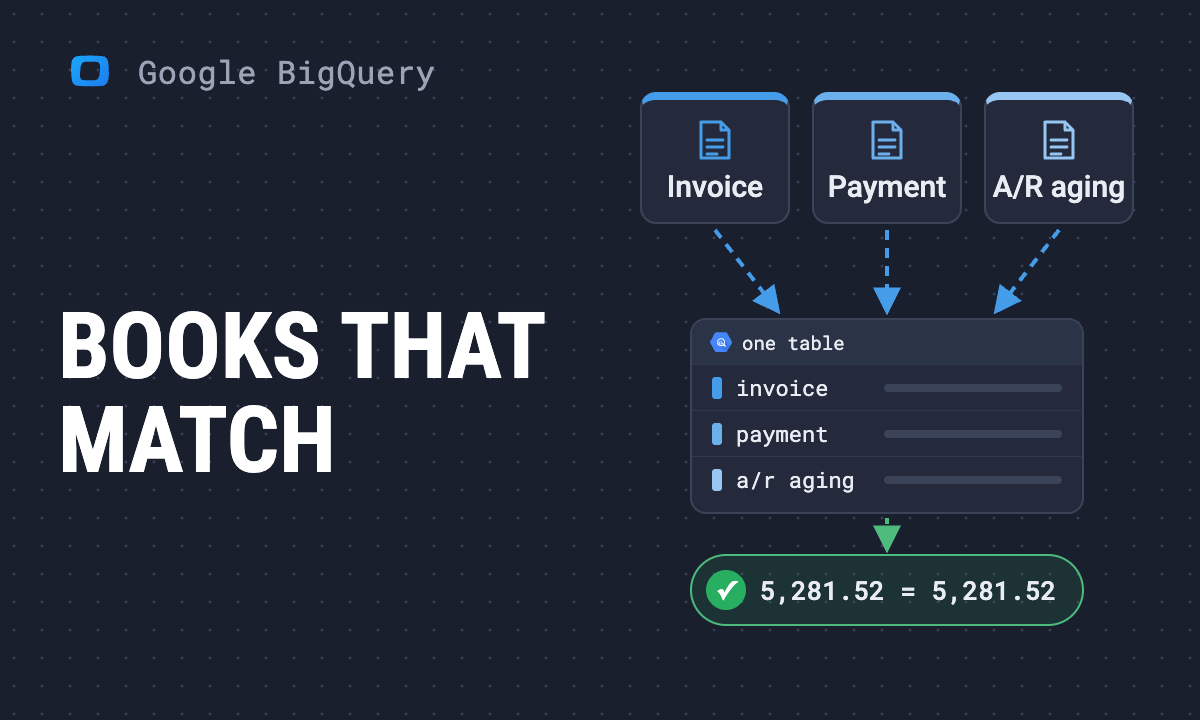 Article · Google BigQueryQuickBooks to BigQuery: Load the Books and Reconcile Them to the P&L
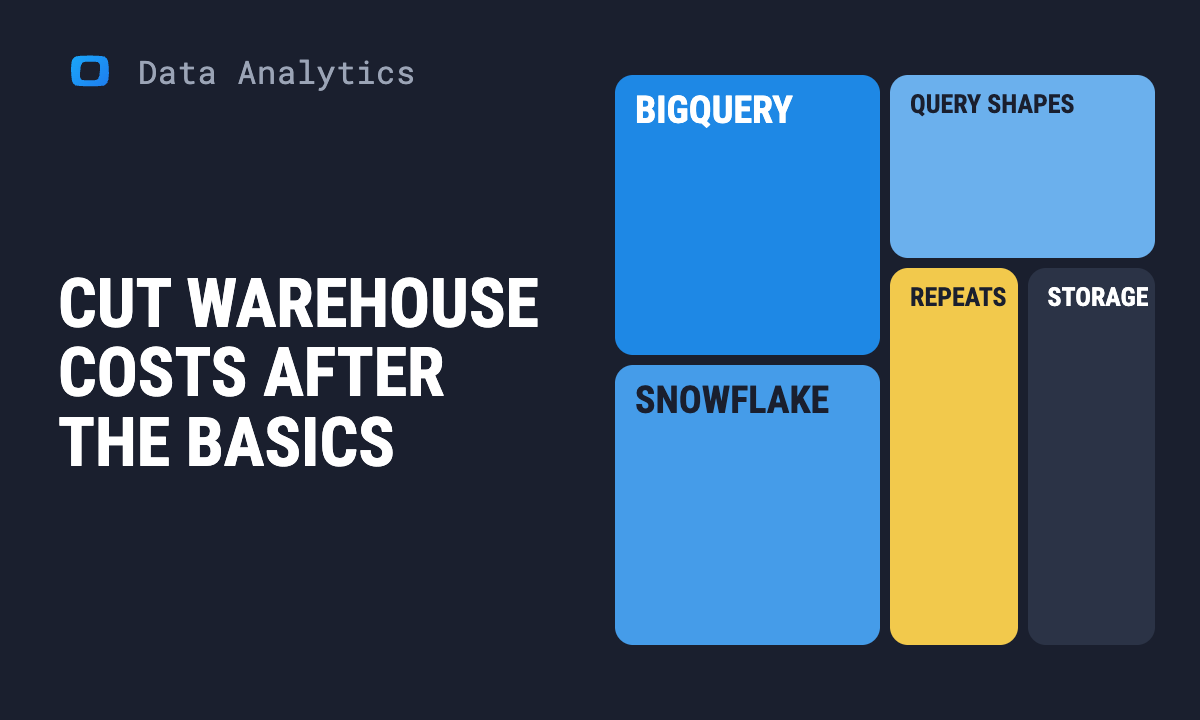 Article · Data AnalyticsHow to Cut BigQuery and Snowflake Costs After the Basics
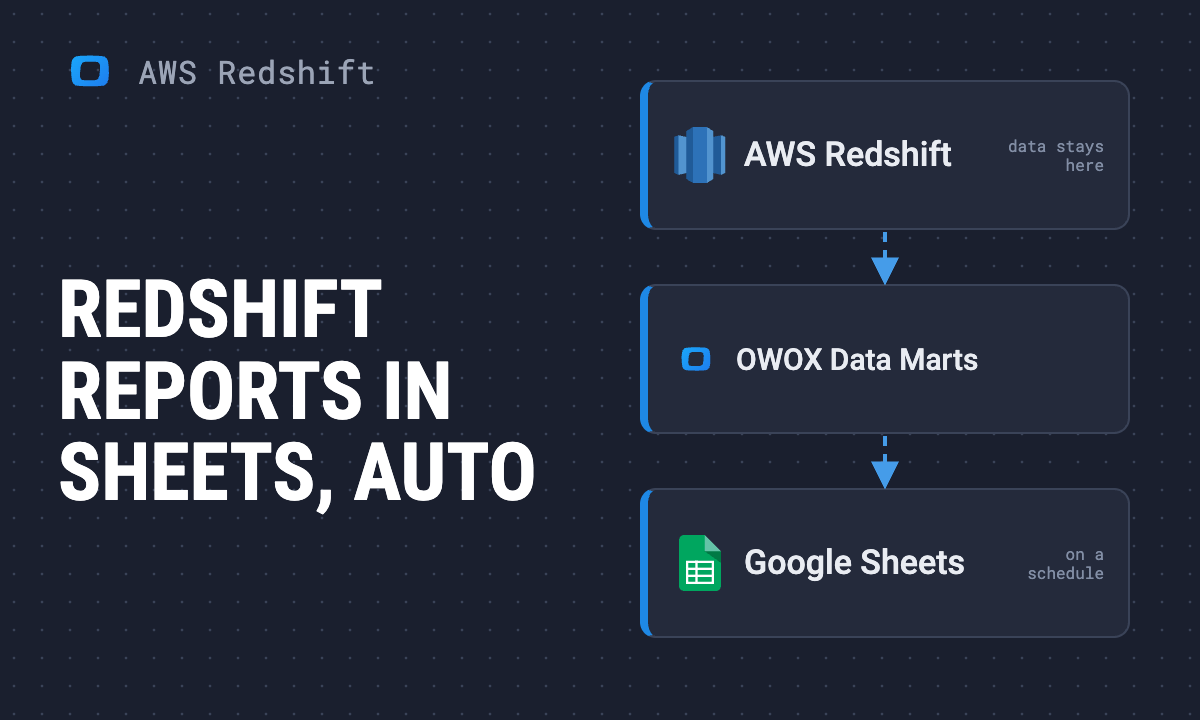 Article · Amazon RedshiftAutomating AWS Redshift Reporting to Google Sheets, Without CSVs
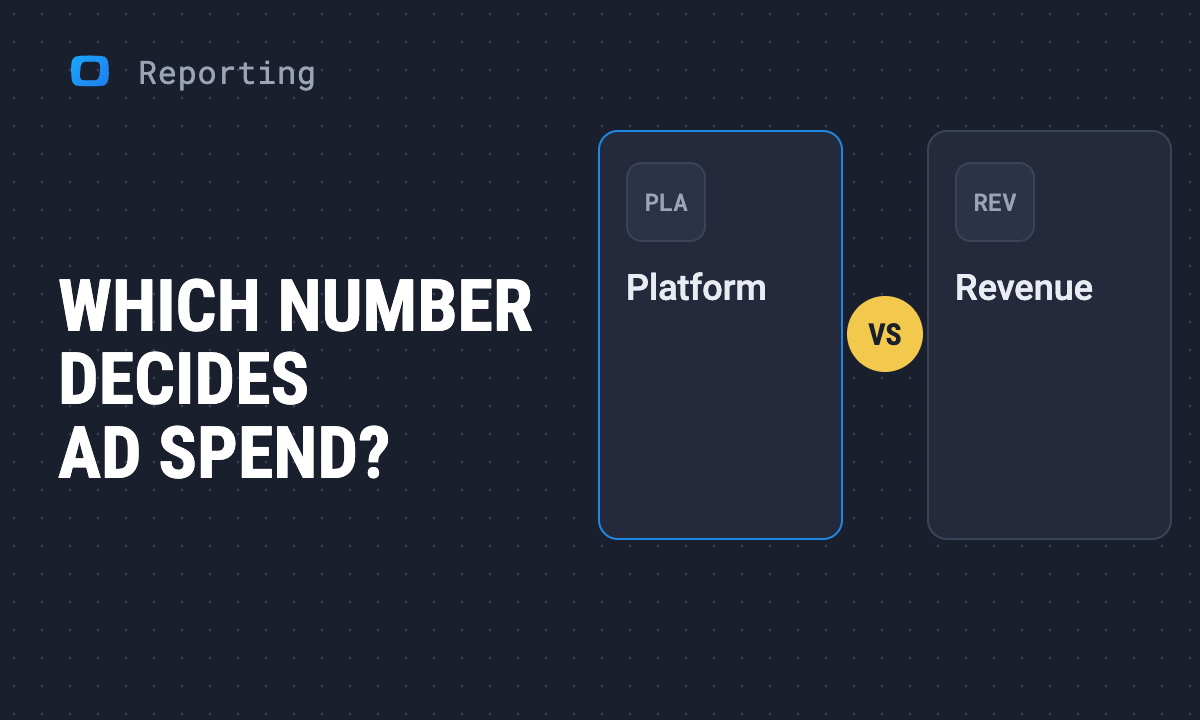 Article · ReportingWhich Number Decides Ad Spend: Platform, GA4 or Revenue?
 Article · ReportingA detailed list of marketing dashboard templates and examples
 Article · ReportingAdvertising reporting tools: which ones put spend against store orders
 Article · ReportingAutomated reporting: a schedule is not a source of truth
 Article · ReportingThe role of business data dashboards: Real-life examples for practical use
 Article · ReportingKPI dashboards: Driving growth with data-driven decisions
 Article · ReportingData Studio tutorial: build your first report, step by step
 Article · Marketing StrategyComprehensive guide to channel strategy in marketing
 Article · Marketing StrategyMastering marketing efficiency ratio (MER) for improved campaign performance
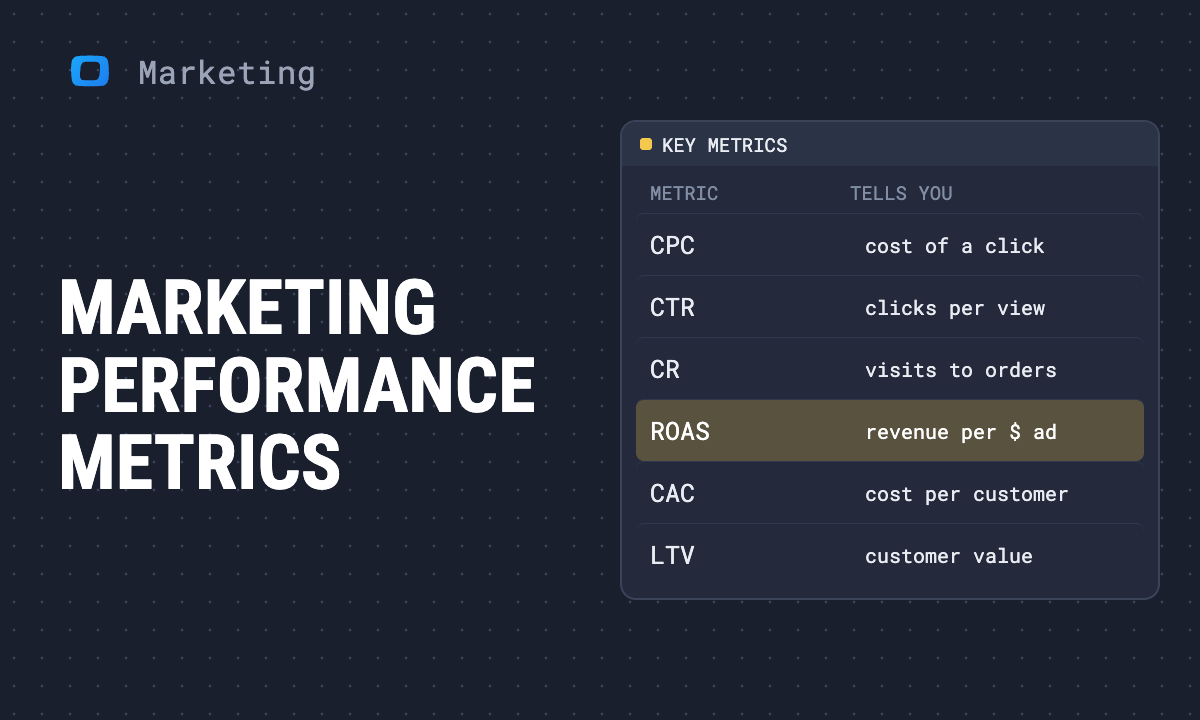 Article · Marketing StrategyMeasuring marketing performance: A guide to maximize results
 Article · ReportingBest reporting tools and software: 13 compared on where the numbers come from
 Article · AI in AnalyticsVibe Coding Dashboards: Why Teams Do It and How to Do It Right
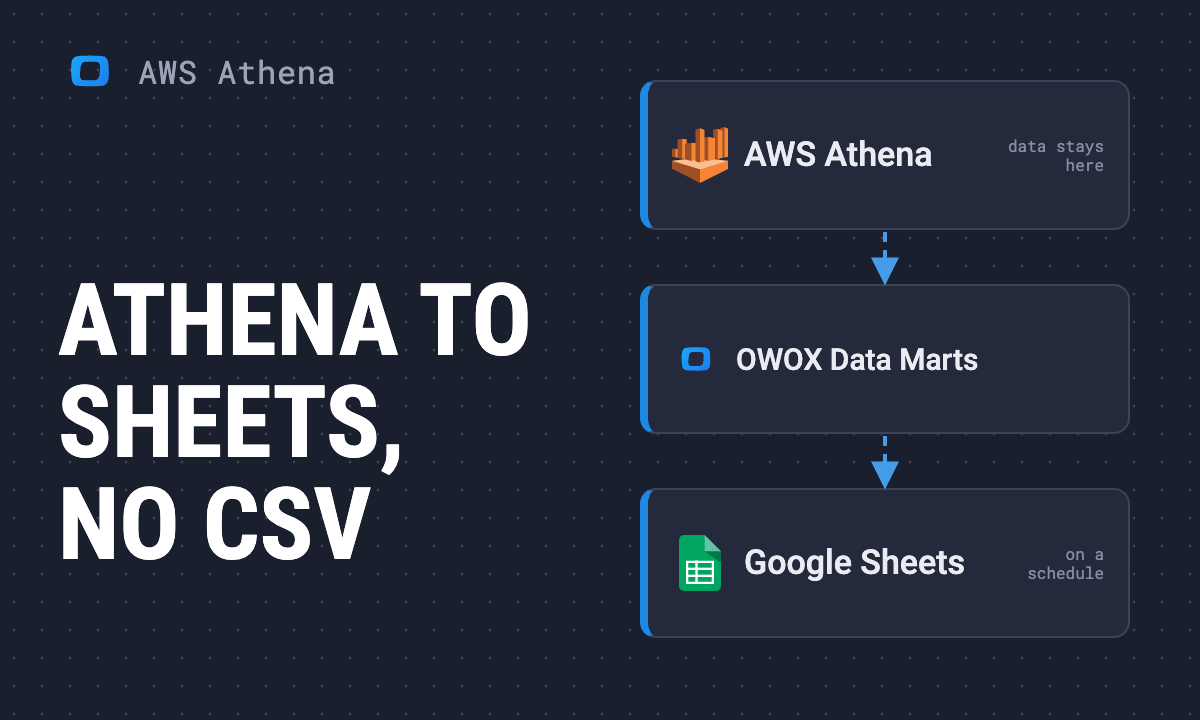 Article · Amazon AthenaHow to Connect AWS Athena to Google Sheets Without CSV Exports
 Article · ReportingWhat is ad hoc reporting, and how do you answer a one-off question?
 Article · Data IntegrationHow to connect Criteo Ads to BigQuery with OWOX Data Marts
 Article · Data IntegrationHow to connect Google Ads to BigQuery with OWOX Data Marts
 Article · Data IntegrationHow to connect LinkedIn Ads to BigQuery with OWOX Data Marts
 Article · Data IntegrationHow to connect LinkedIn Pages to BigQuery with OWOX Data Marts
 Article · Data IntegrationHow to connect Microsoft Ads to BigQuery with OWOX Data Marts
 Article · Data IntegrationHow to load Open Exchange Rates into BigQuery with OWOX Data Marts
 Article · Data IntegrationHow to connect Reddit Ads to BigQuery with OWOX Data Marts
 Article · Data IntegrationTikTok Ads to BigQuery: free connector and setup guide
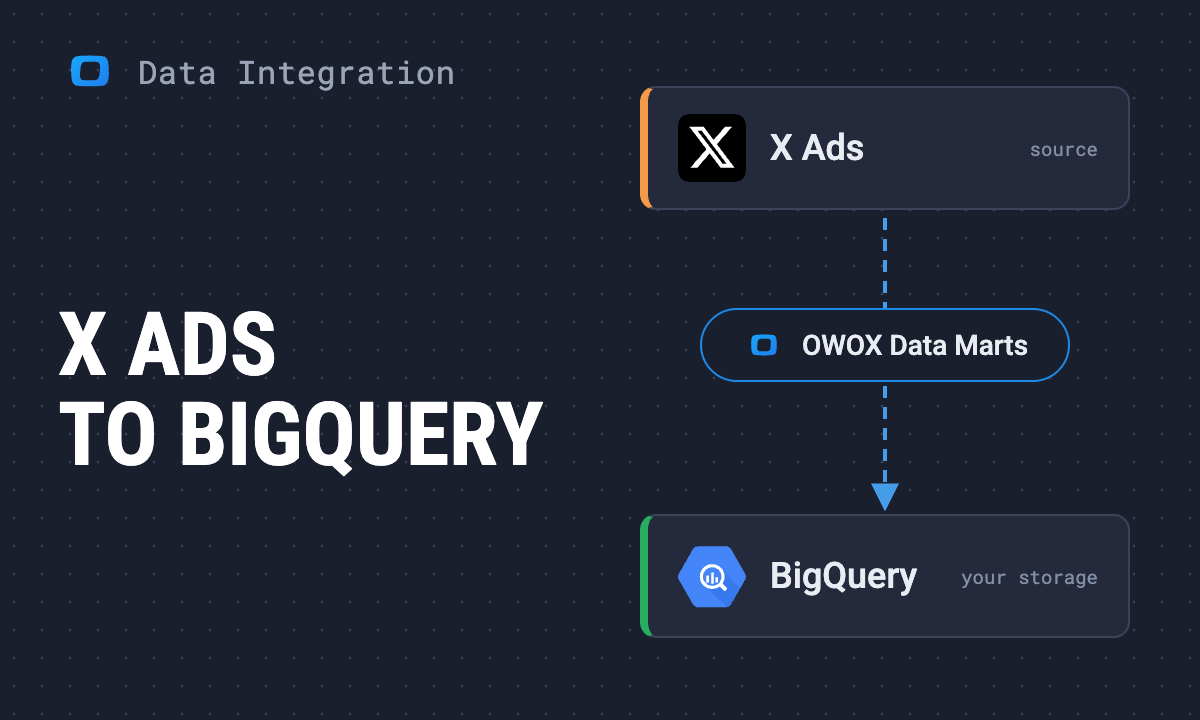 Article · Data IntegrationHow to connect X Ads (Twitter Ads) to BigQuery with OWOX Data Marts
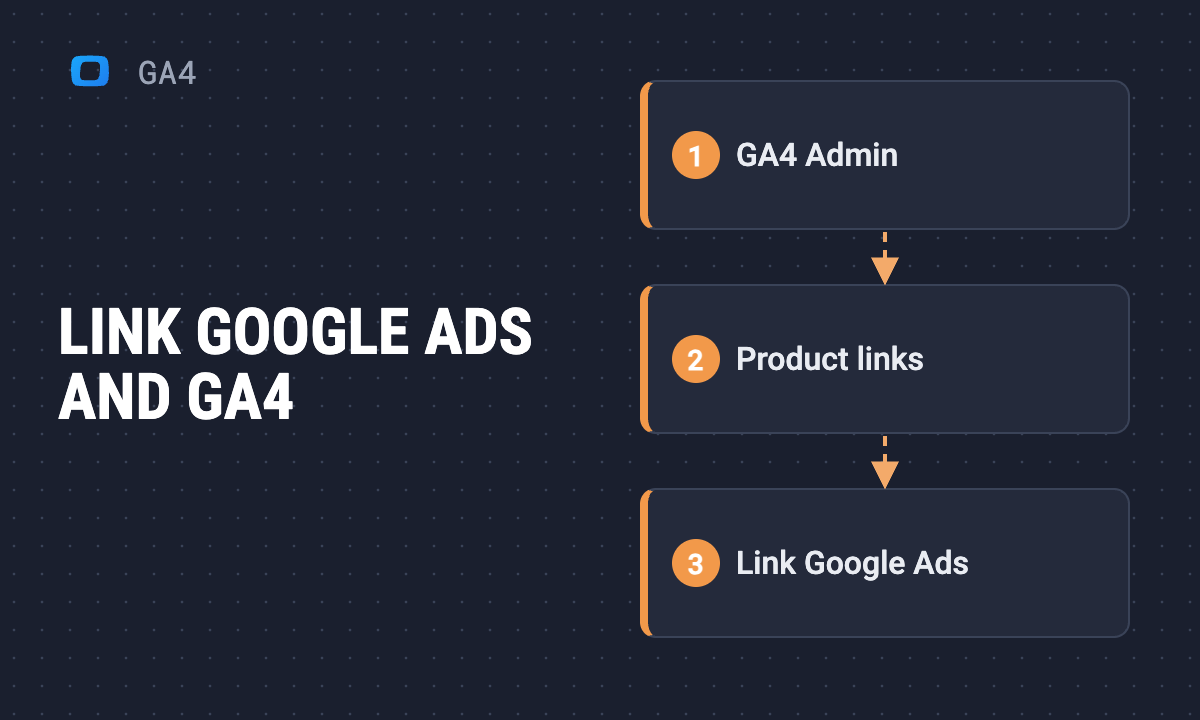 Article · GA4How to link your Google Ads and Google Analytics 4 accounts
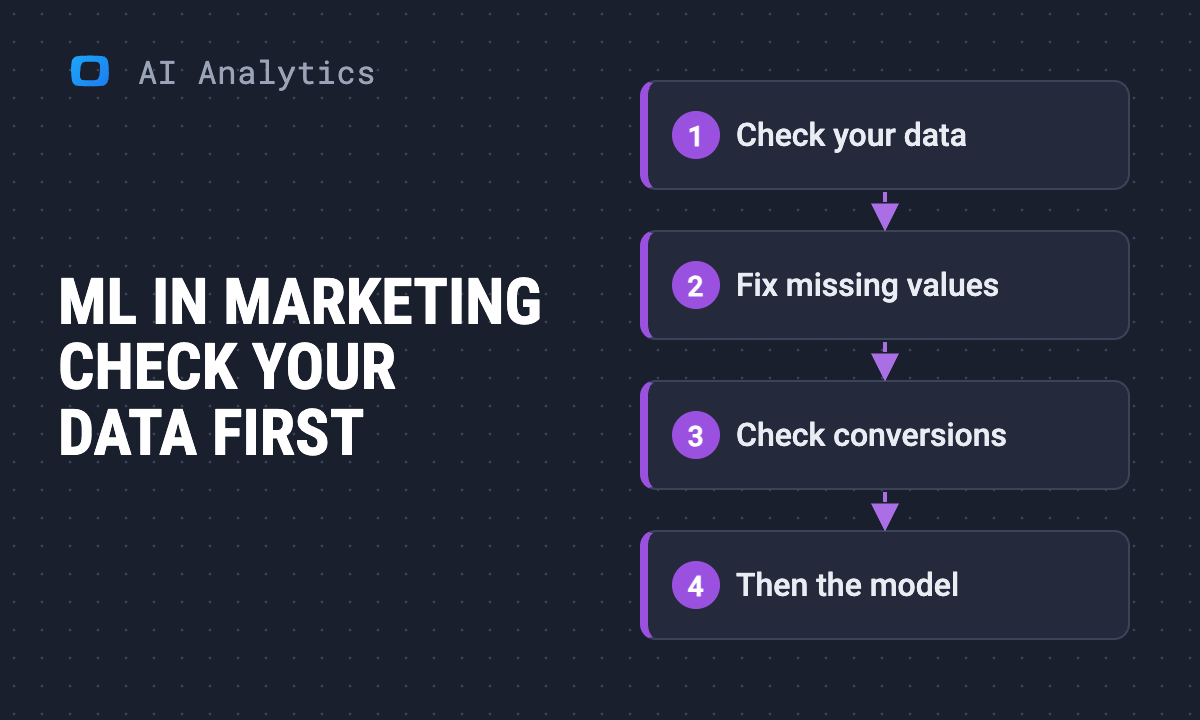 Article · AI in AnalyticsMachine learning in marketing: the uses your data can actually support
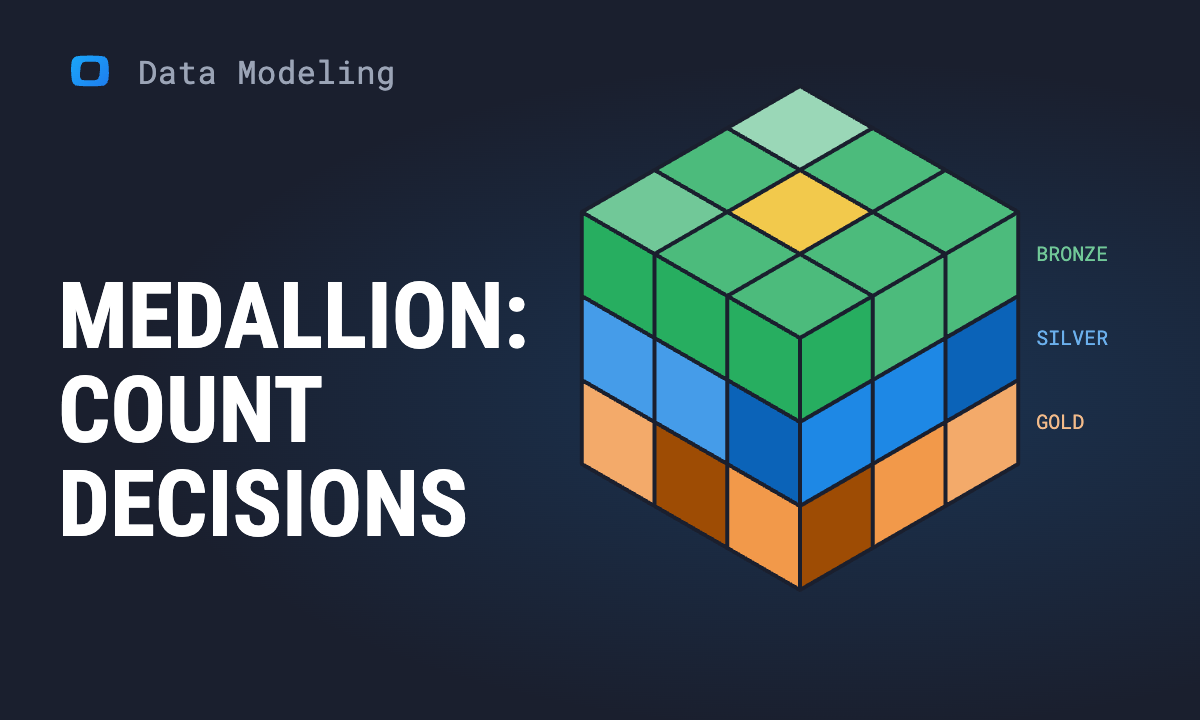 Article · Data ModelingIs the Medallion Architecture Worth Its Complexity? Count Decisions, Not Layers
 Article · Data Modeling8 mistakes in data modeling and how to avoid them
 Article · Analytics ToolsCan you retire your BI tool now the data lives in the warehouse?
 Article · Data Tracking7 free UTM builders for tracking your marketing campaigns
 Article · Data ModelingWhat is data modeling? The full guide
 Article · Amazon AthenaAWS Redshift vs Athena: Key Differences Explained
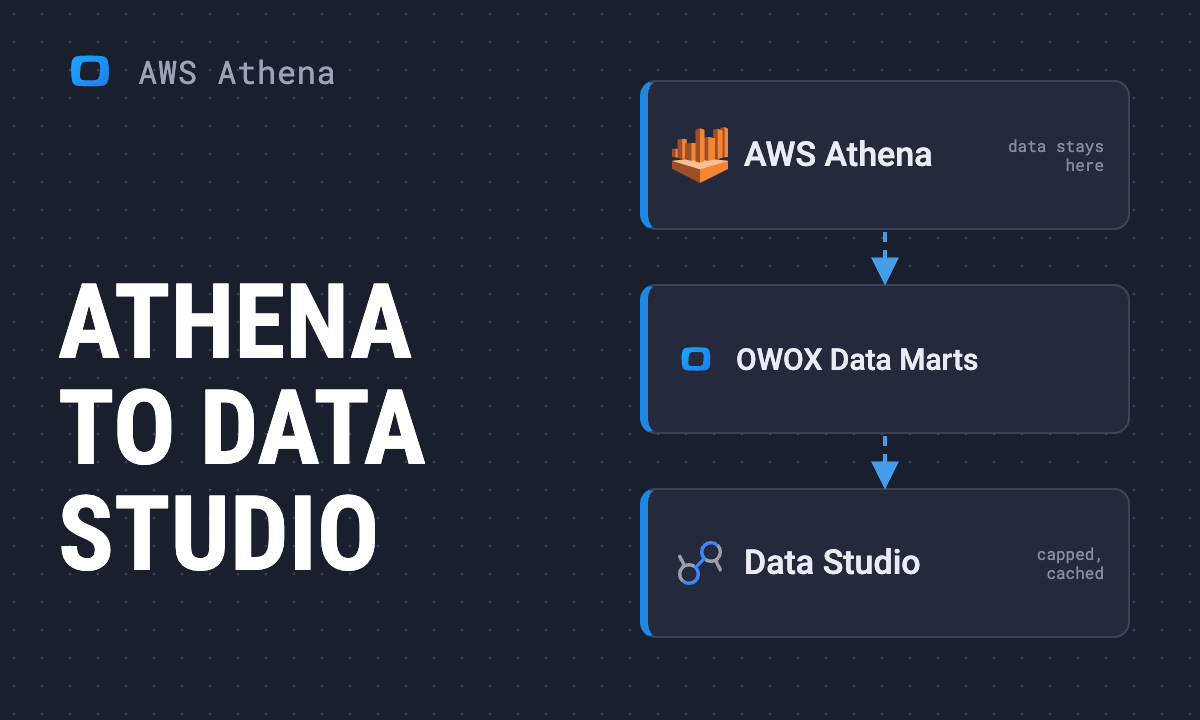 Article · Amazon AthenaHow to Connect AWS Athena to Data Studio
 Article · Data ModelingWhat is Apache Ossie? The Open Standard for Semantic Models, Explained
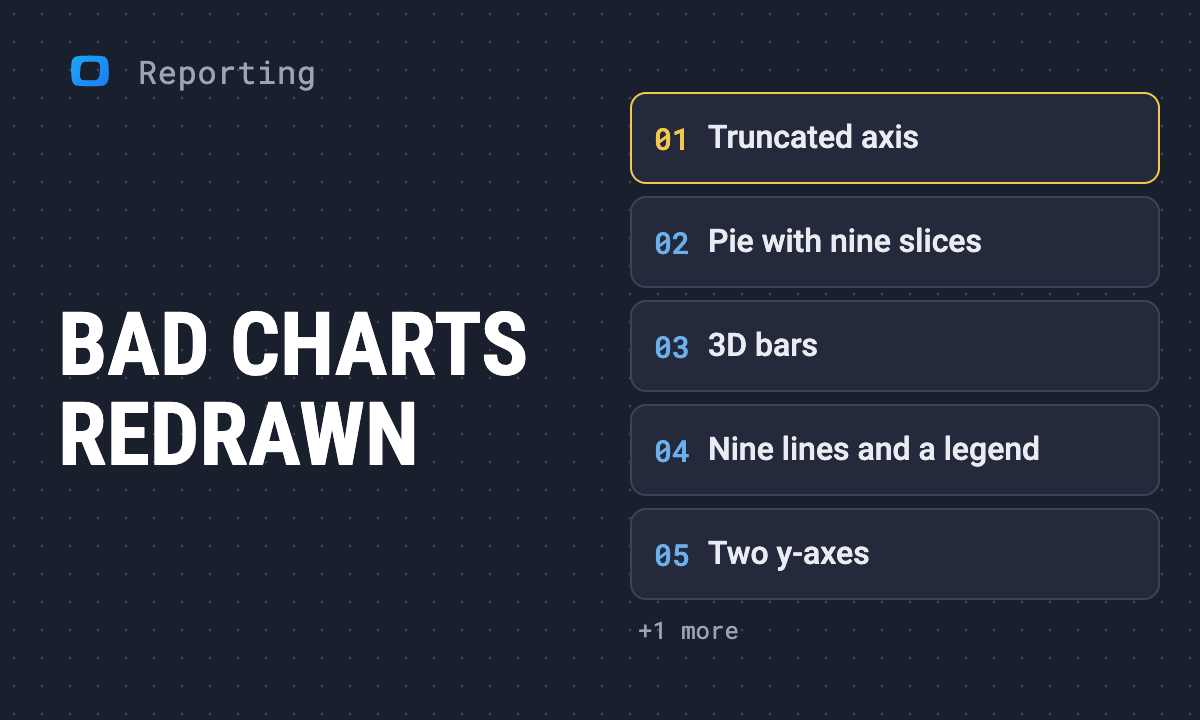 Article · ReportingBad data visualization examples, and how to redraw each one
 Article · GA4Facebook Ads vs GA4 conversions: why the numbers differ and how to read them
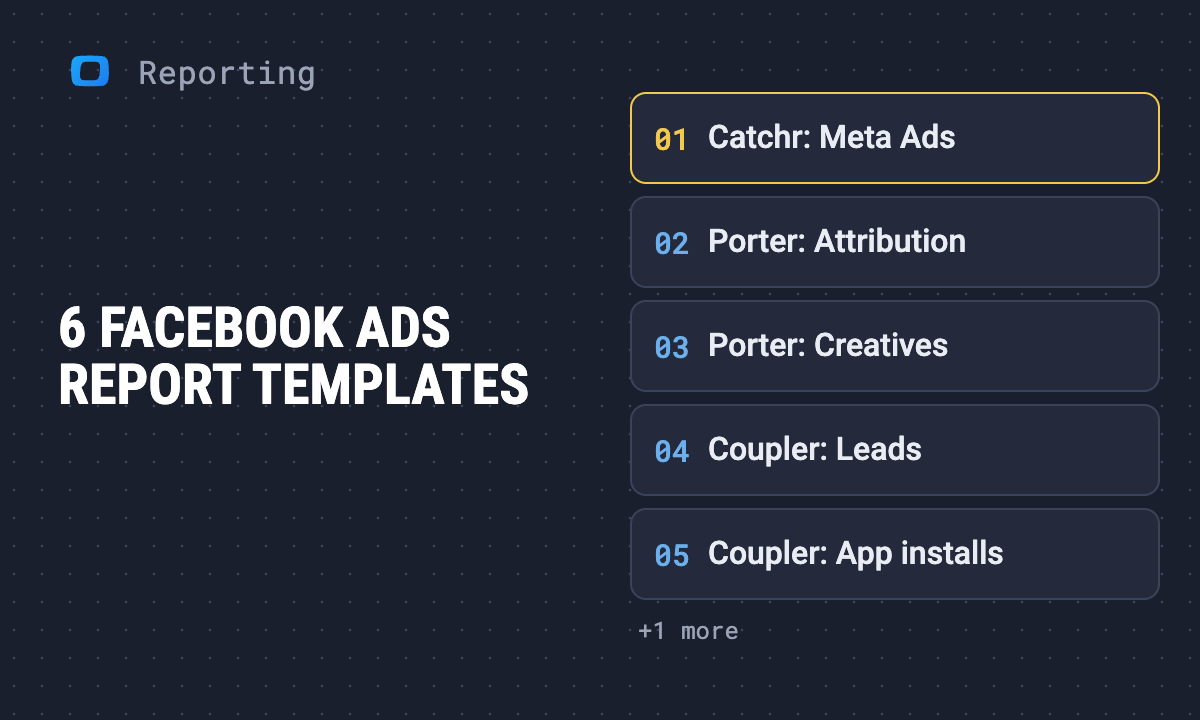 Article · ReportingFacebook Ads report templates: what each one answers
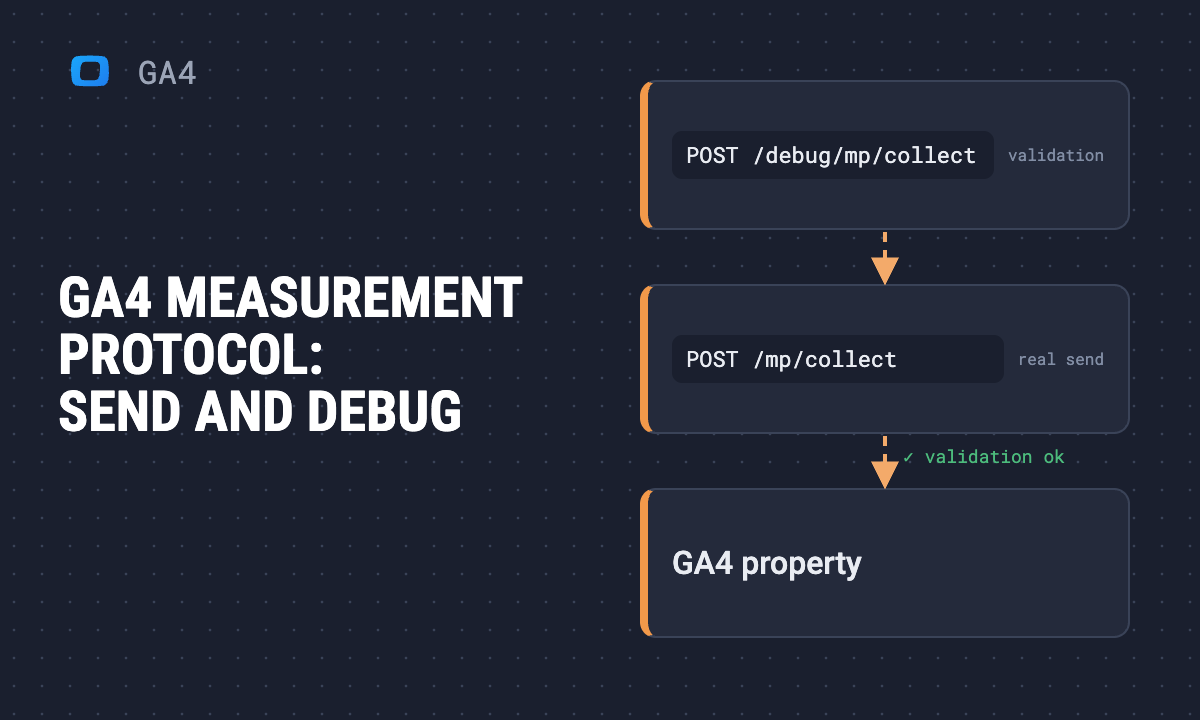 Article · GA4GA4 Measurement Protocol: send an event and debug it
 Article · ReportingMarketing reports: how to build one that changes a decision
 Article · Data ModelingOKF vs Apache Ossie: Which Format Should Describe Your Data Model?
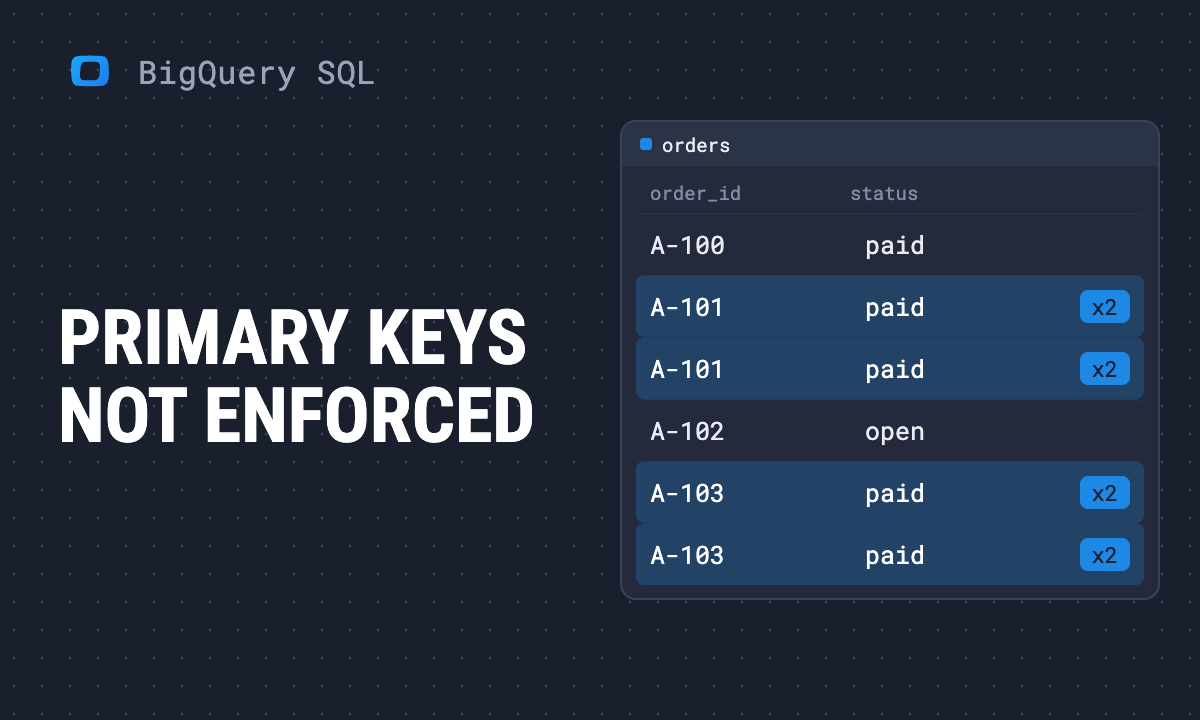 Article · SQL for AnalyticsPrimary and foreign keys in SQL: what your warehouse enforces
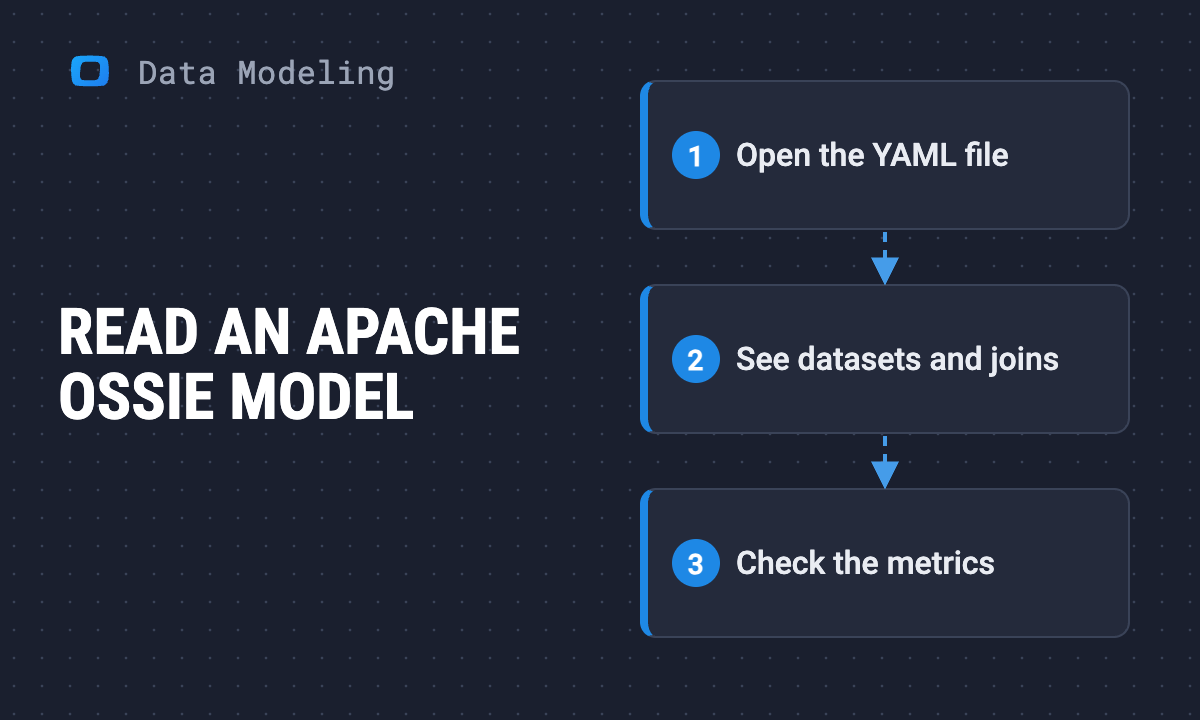 Article · Data ModelingHow to Read an Apache Ossie Model: From YAML File to Diagram
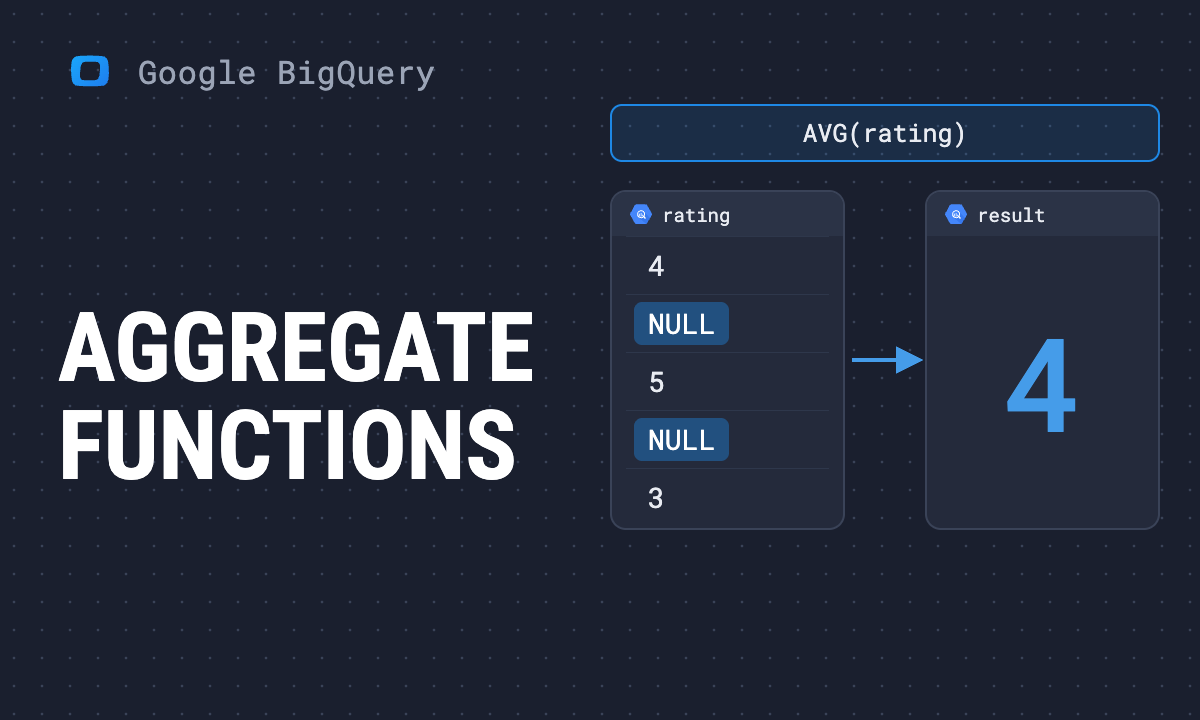 Article · Google BigQueryBigQuery aggregate functions: COUNT, SUM, STRING_AGG, ARRAY_AGG and more
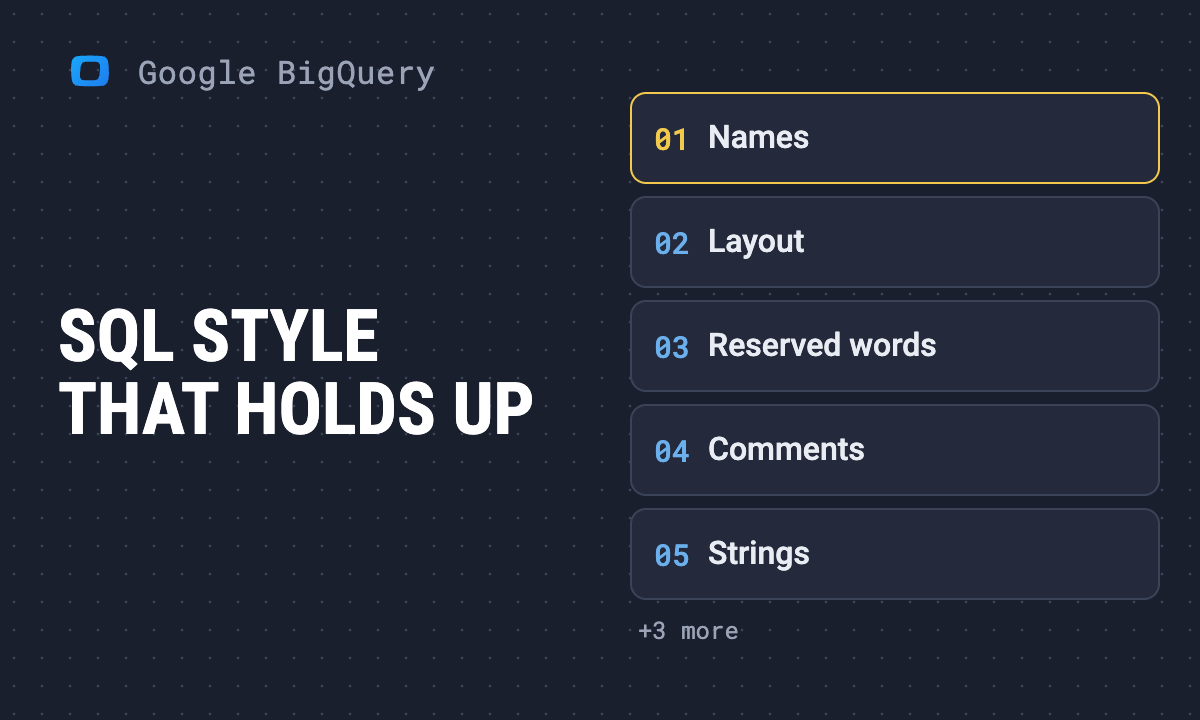 Article · Google BigQueryBigQuery SQL style and best practices: a short, tested standard
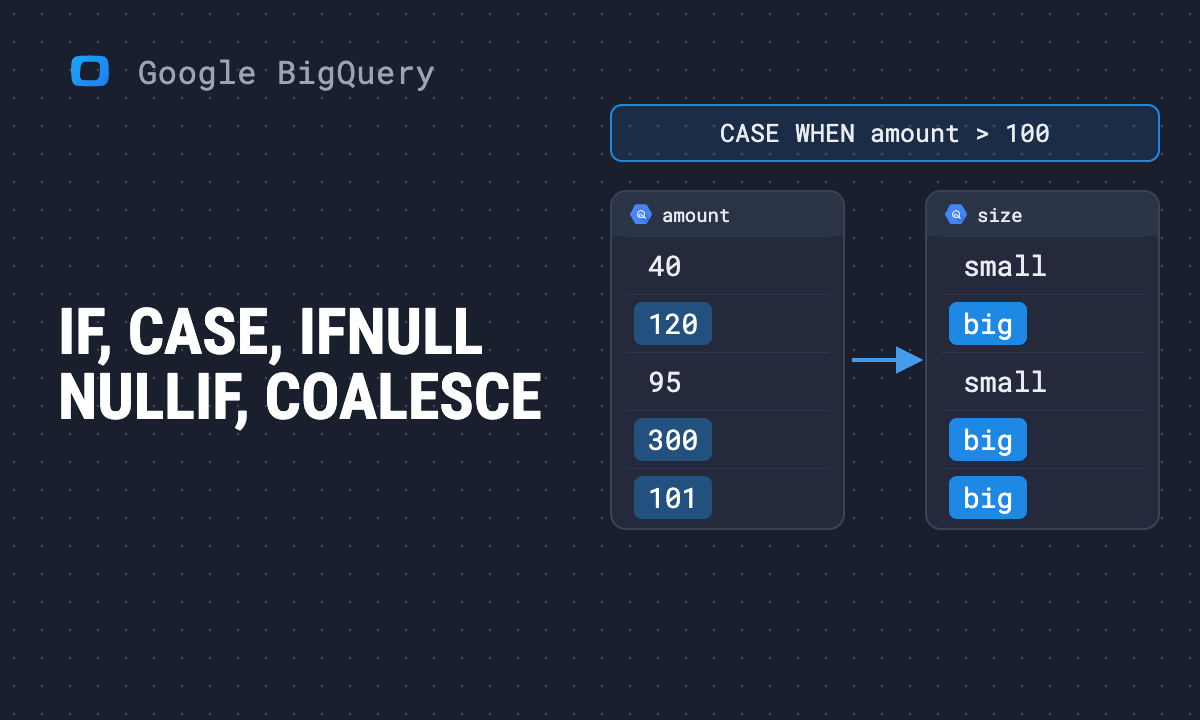 Article · Google BigQueryBigQuery IF, CASE, IFNULL, NULLIF and COALESCE, with tested examples
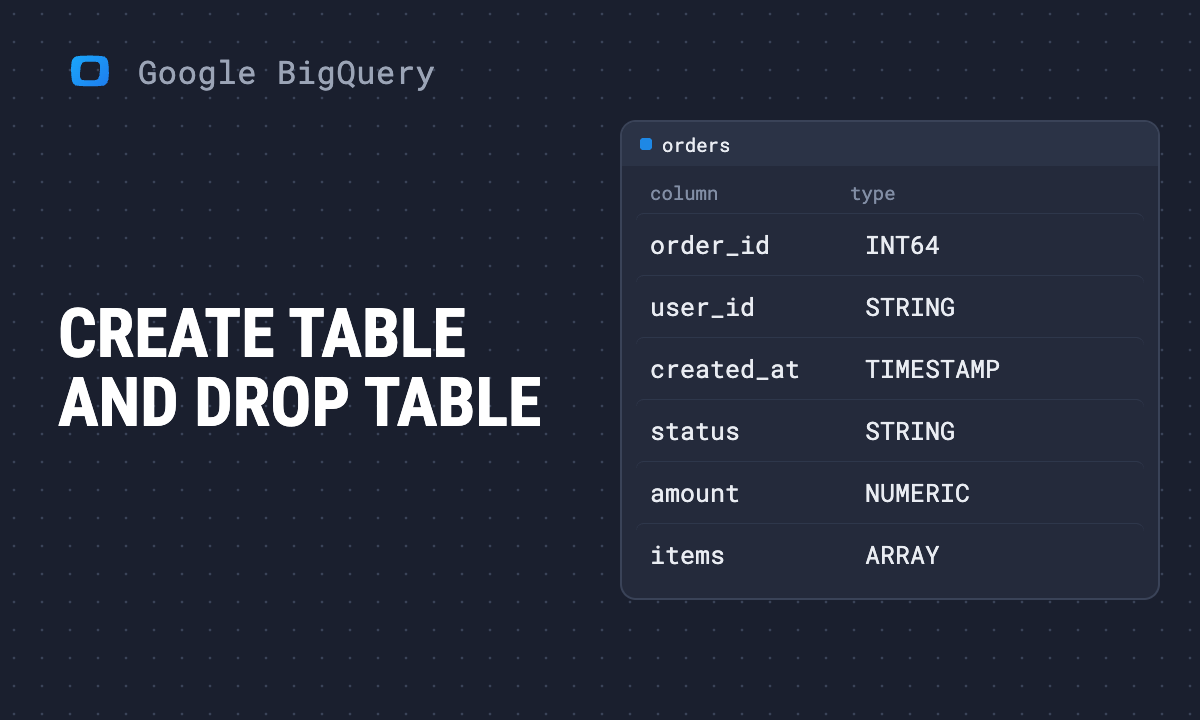 Article · Google BigQueryBigQuery CREATE TABLE and DROP TABLE: syntax and examples
 Article · Google BigQueryHow to create a view in BigQuery: CREATE VIEW, cost and limits
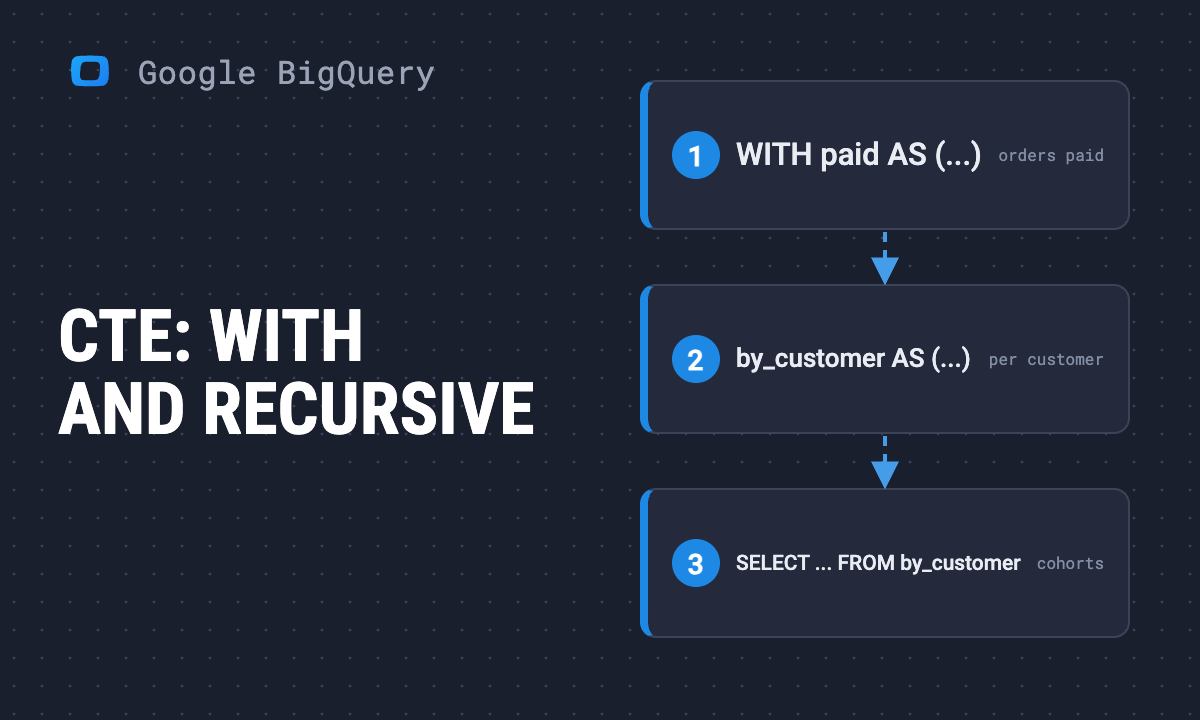 Article · Google BigQueryBigQuery CTE: WITH clauses and recursive CTEs, with tested examples
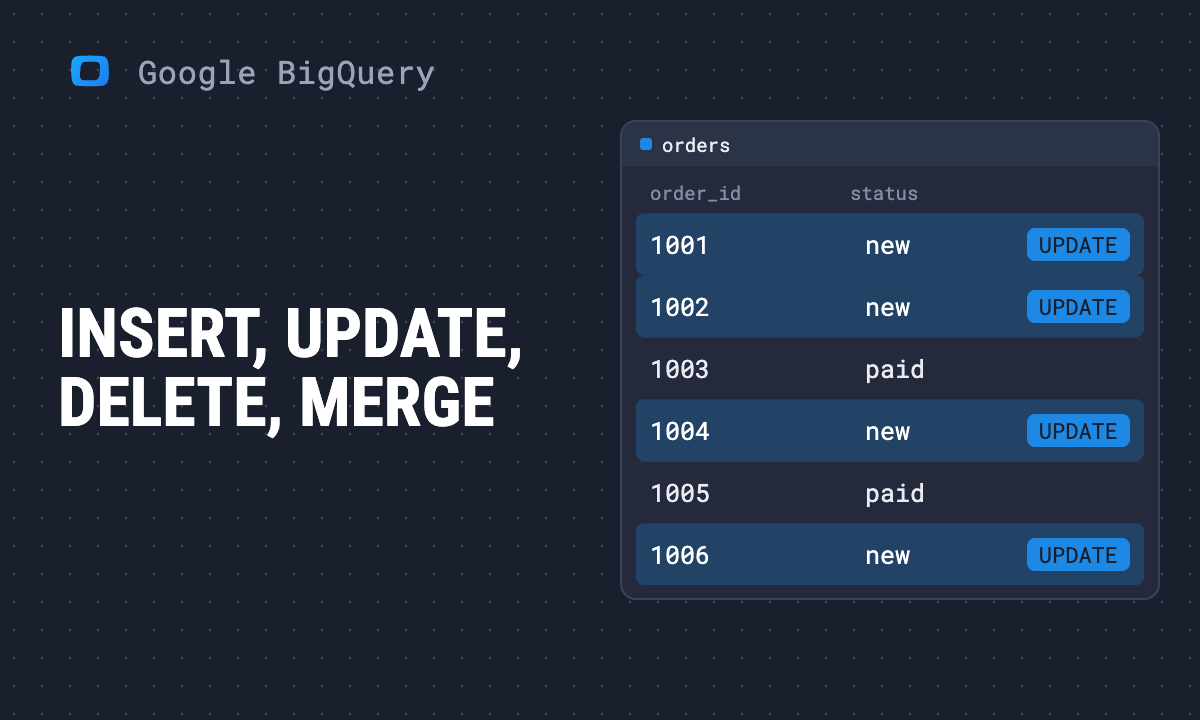 Article · Google BigQueryBigQuery DML: INSERT, UPDATE, DELETE and MERGE with tested examples
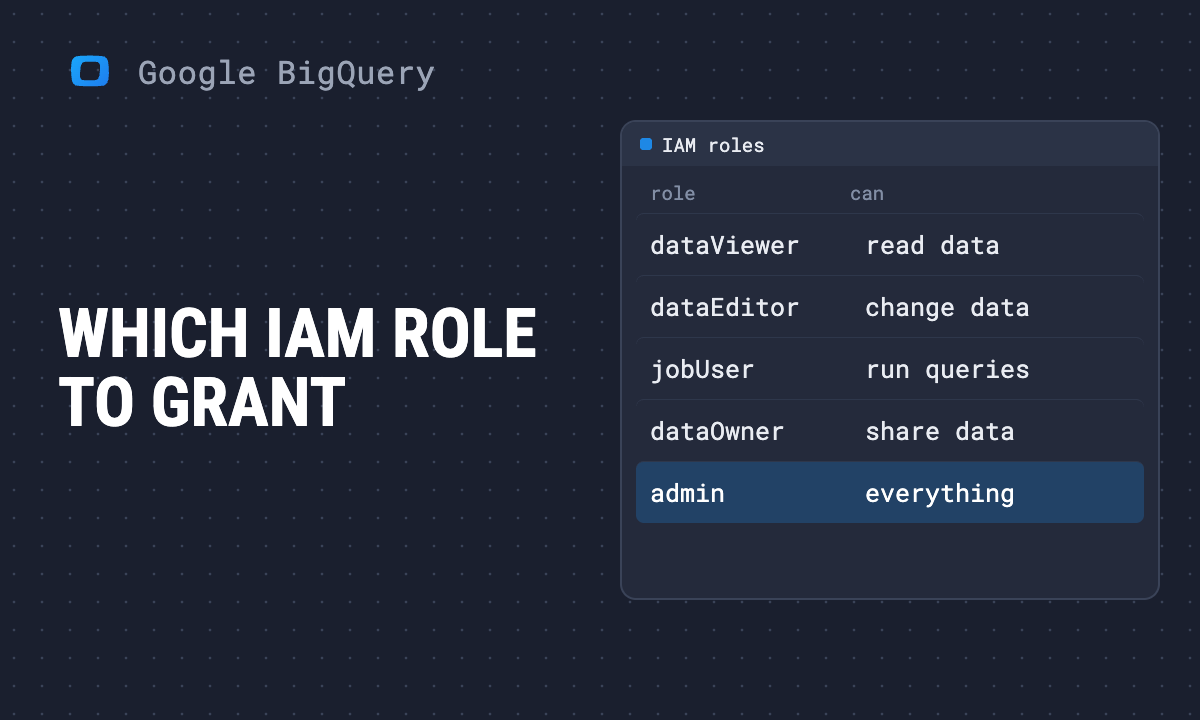 Article · Google BigQueryBigQuery IAM roles: which one to grant, and how to share a dataset
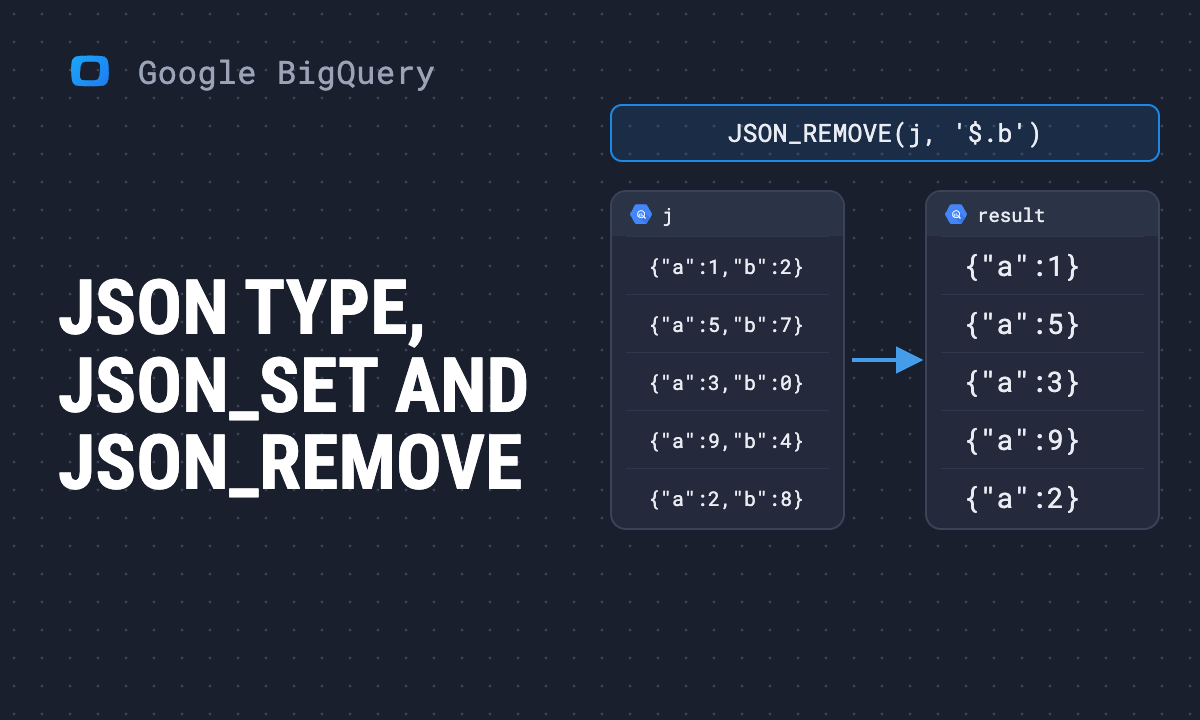 Article · Google BigQueryBigQuery JSON functions: the JSON type, JSON_SET, JSON_REMOVE and more
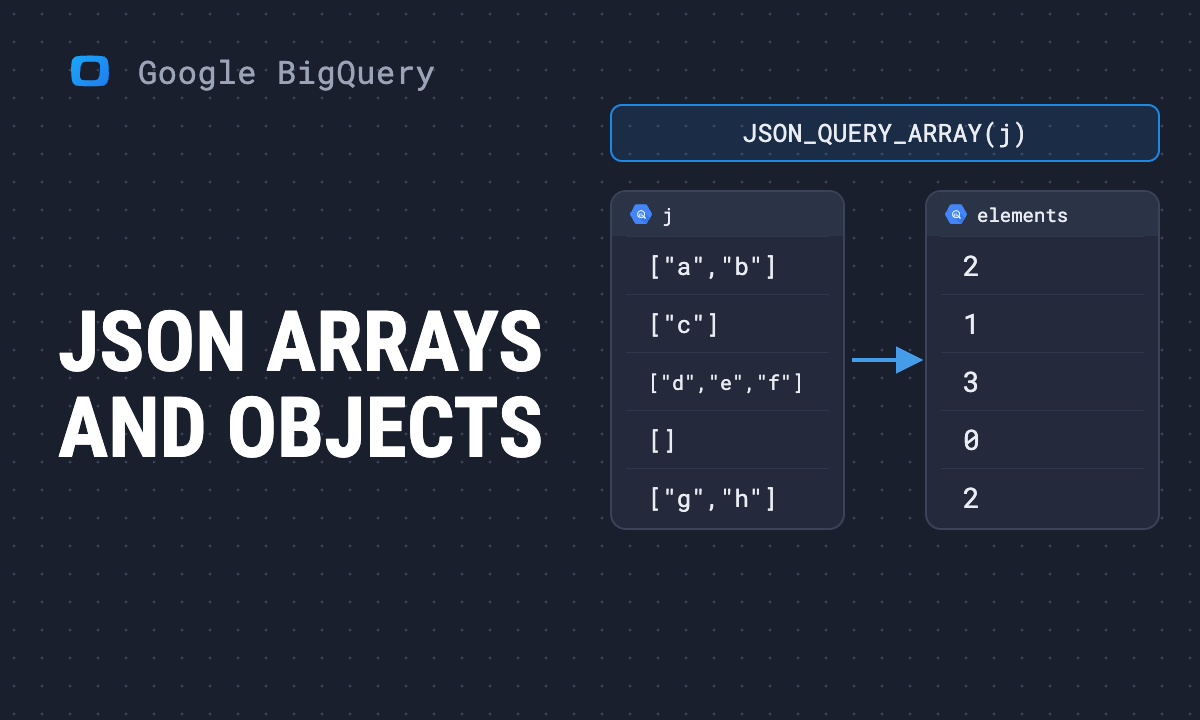 Article · Google BigQueryBigQuery JSON arrays and objects: JSON_QUERY_ARRAY, UNNEST and JSON_OBJECT
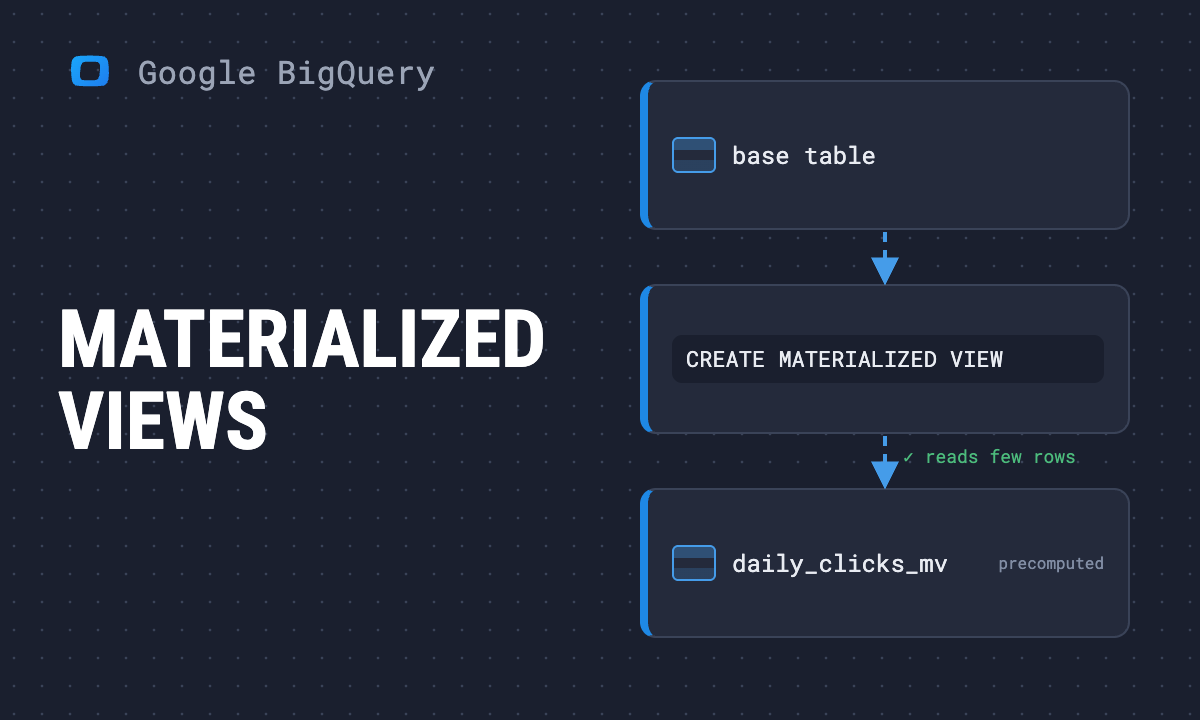 Article · Google BigQueryBigQuery materialized views: when they help, limits and refresh
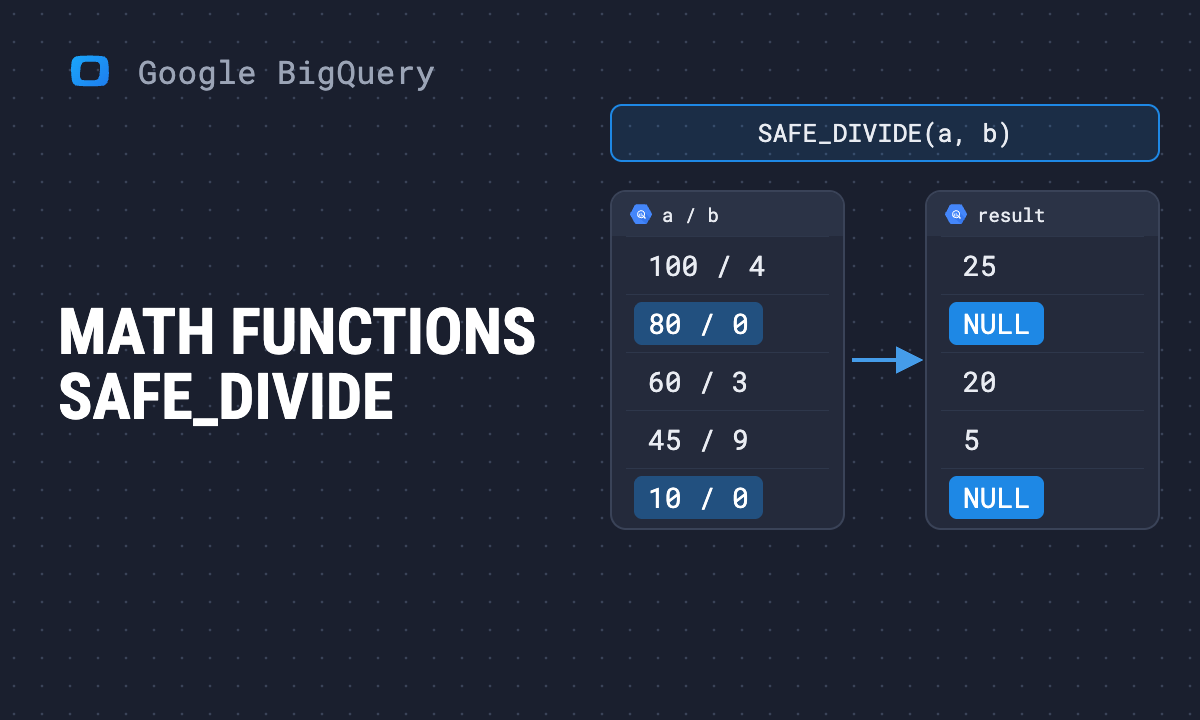 Article · Google BigQueryBigQuery math functions: ROUND, SAFE_DIVIDE, MOD, POW and more
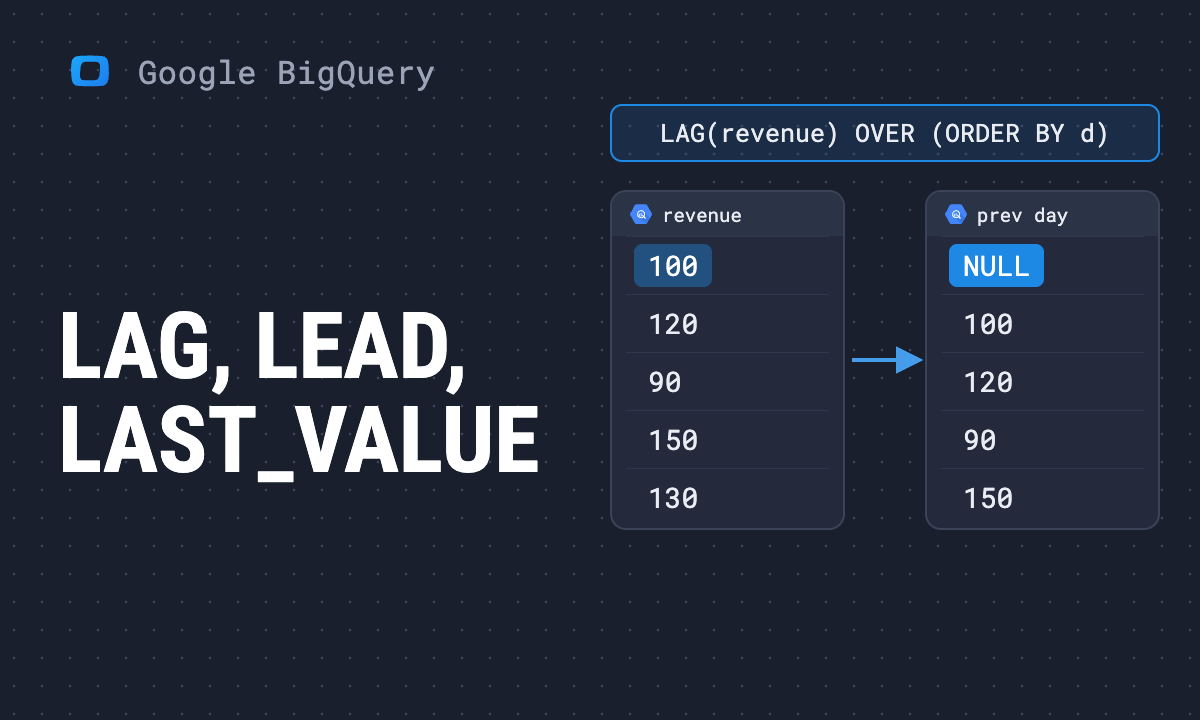 Article · Google BigQueryBigQuery navigation functions: LAG, LEAD, LAST_VALUE and PERCENTILE_CONT
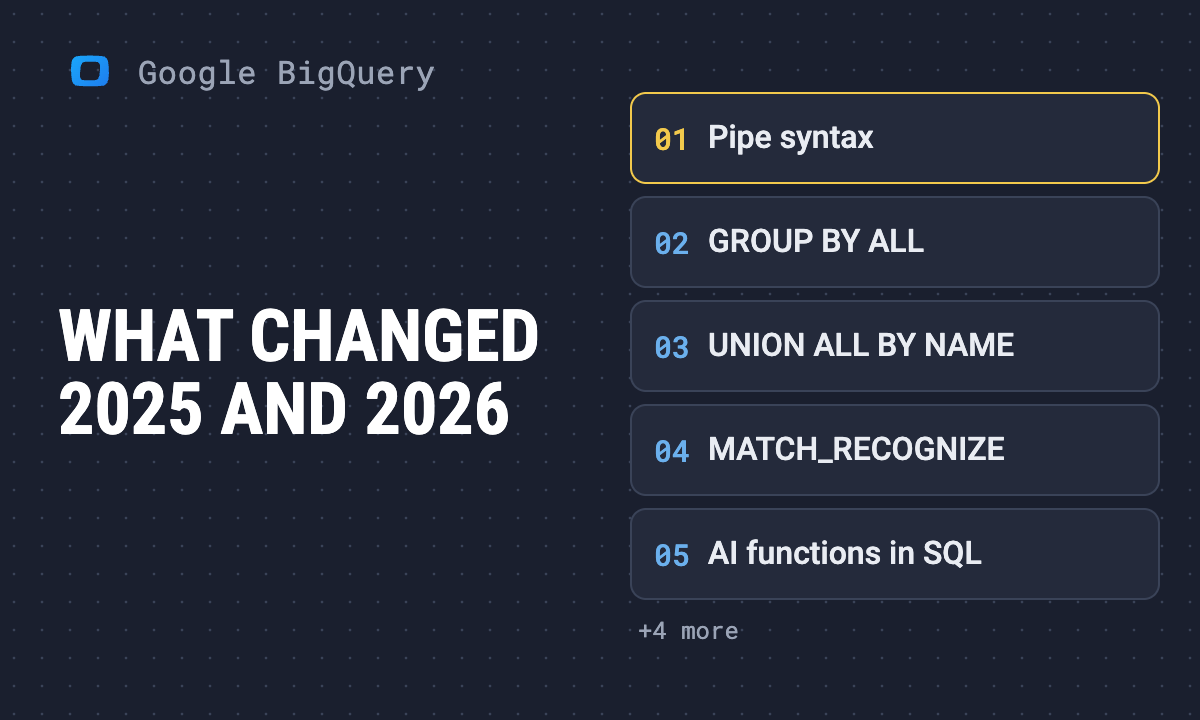 Article · Google BigQueryBigQuery updates for analysts: what changed in 2025 and 2026
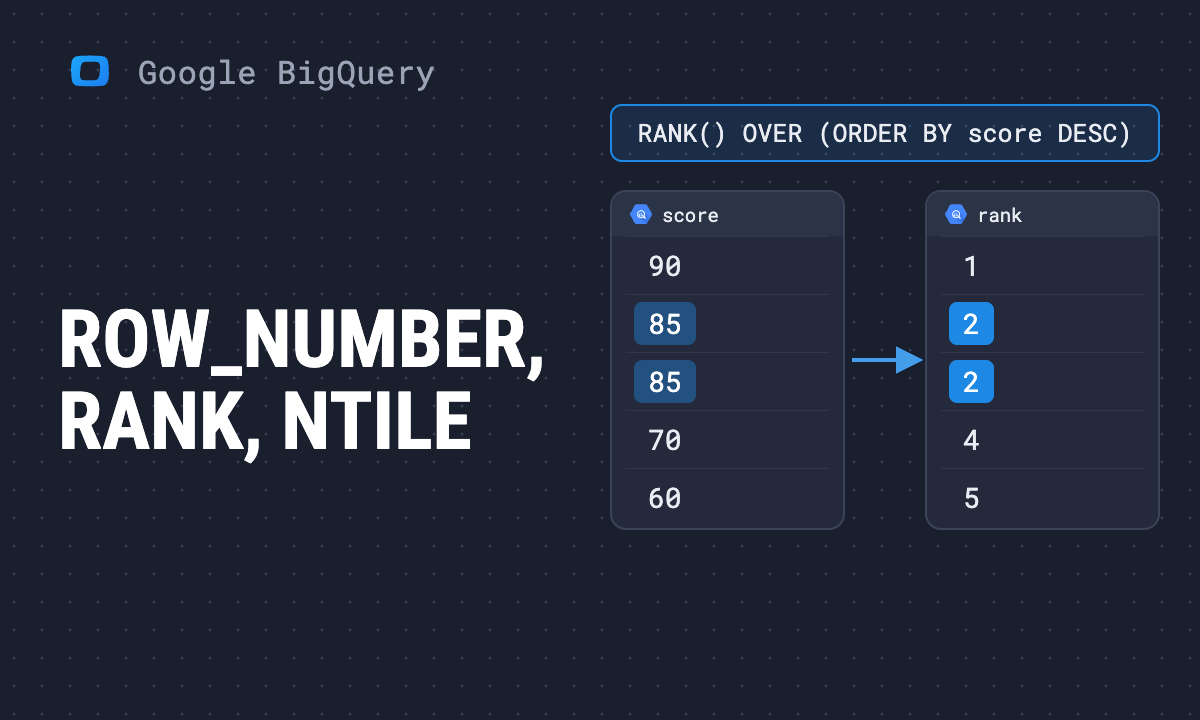 Article · Google BigQueryBigQuery ROW_NUMBER, RANK, DENSE_RANK and NTILE, with tested examples
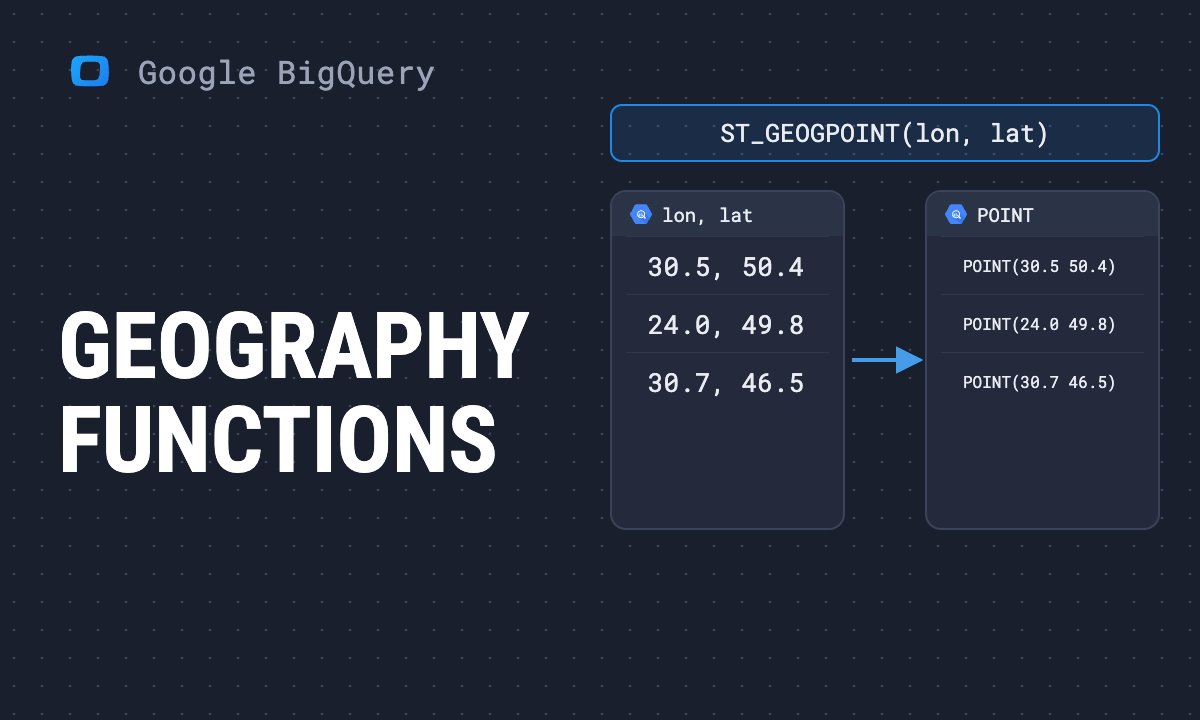 Article · Google BigQueryBigQuery geography functions: points, distances, polygons and BigQuery ML
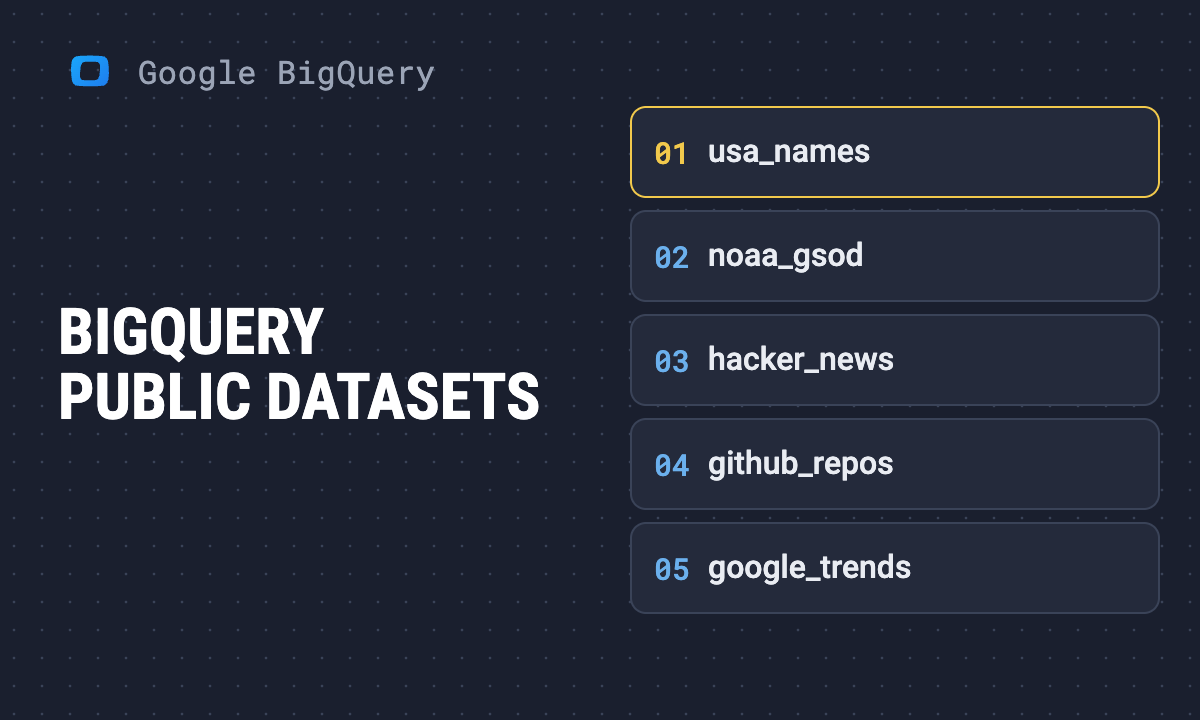 Article · Google BigQueryBigQuery public datasets: how to find, query and pay for them
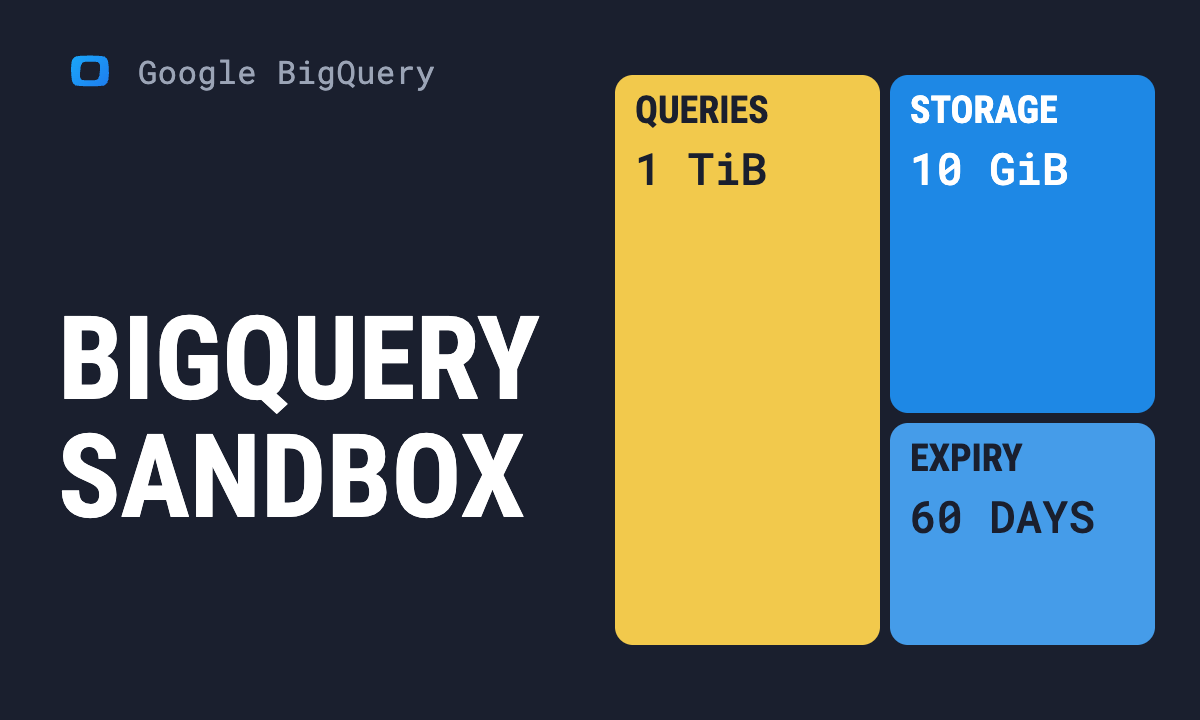 Article · Google BigQueryBigQuery sandbox: free limits, setup and what happens when you upgrade
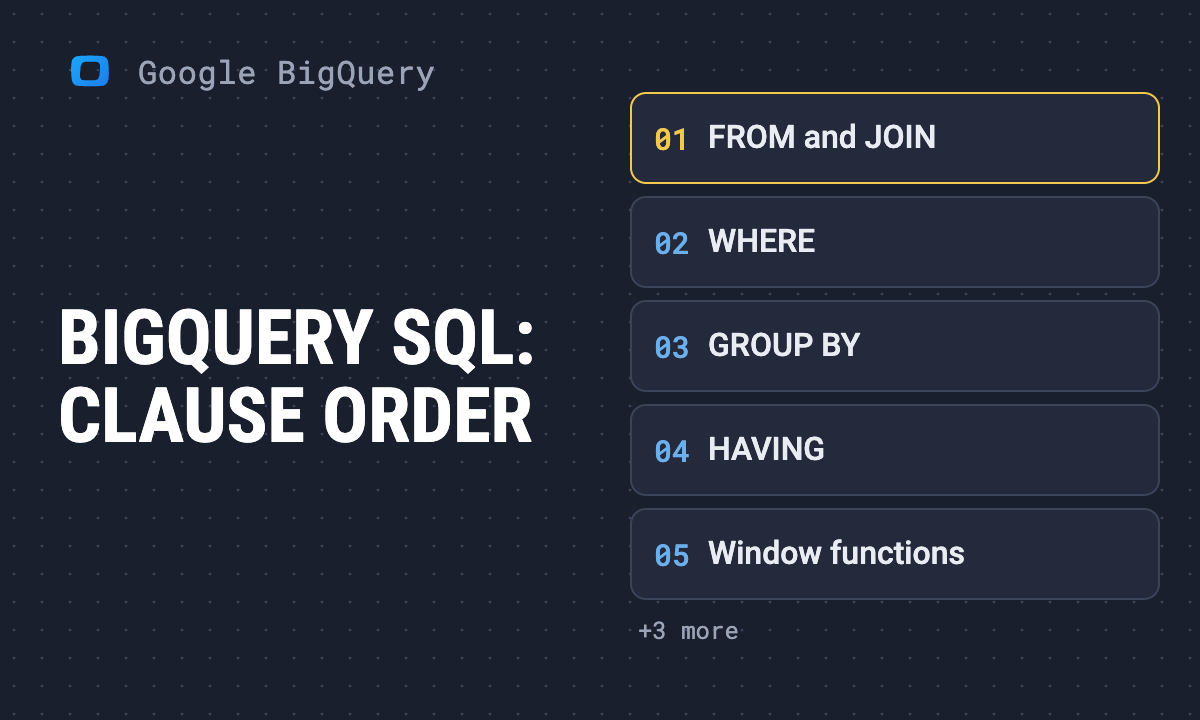 Article · Google BigQueryBigQuery SQL: syntax, clause order and tested examples
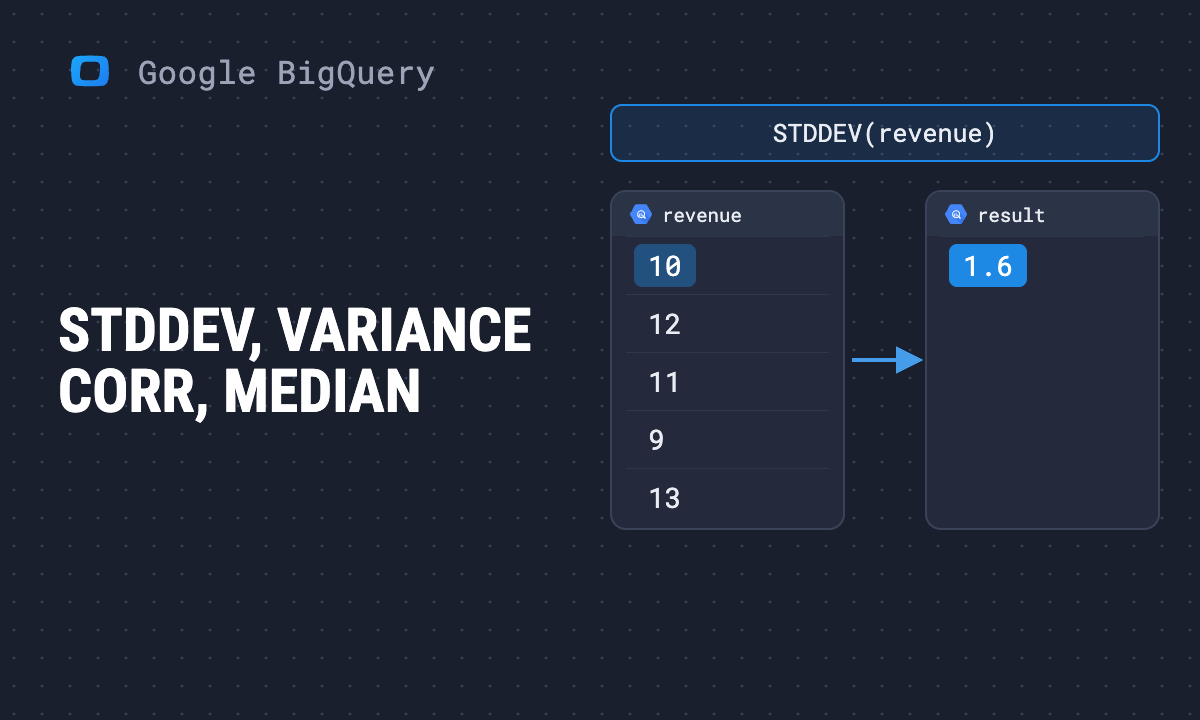 Article · Google BigQueryBigQuery statistical aggregate functions: STDDEV, VARIANCE, CORR and median
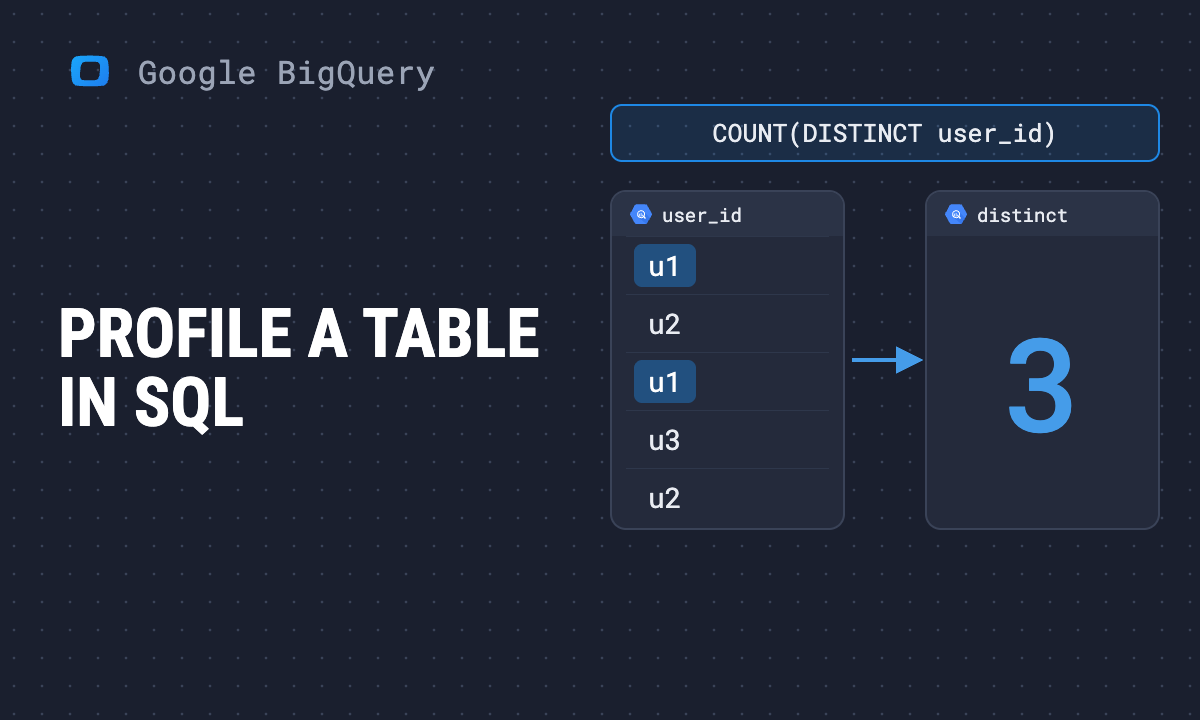 Article · Google BigQueryBigQuery table explorer and data insights: what changed, and the SQL to profile a table yourself
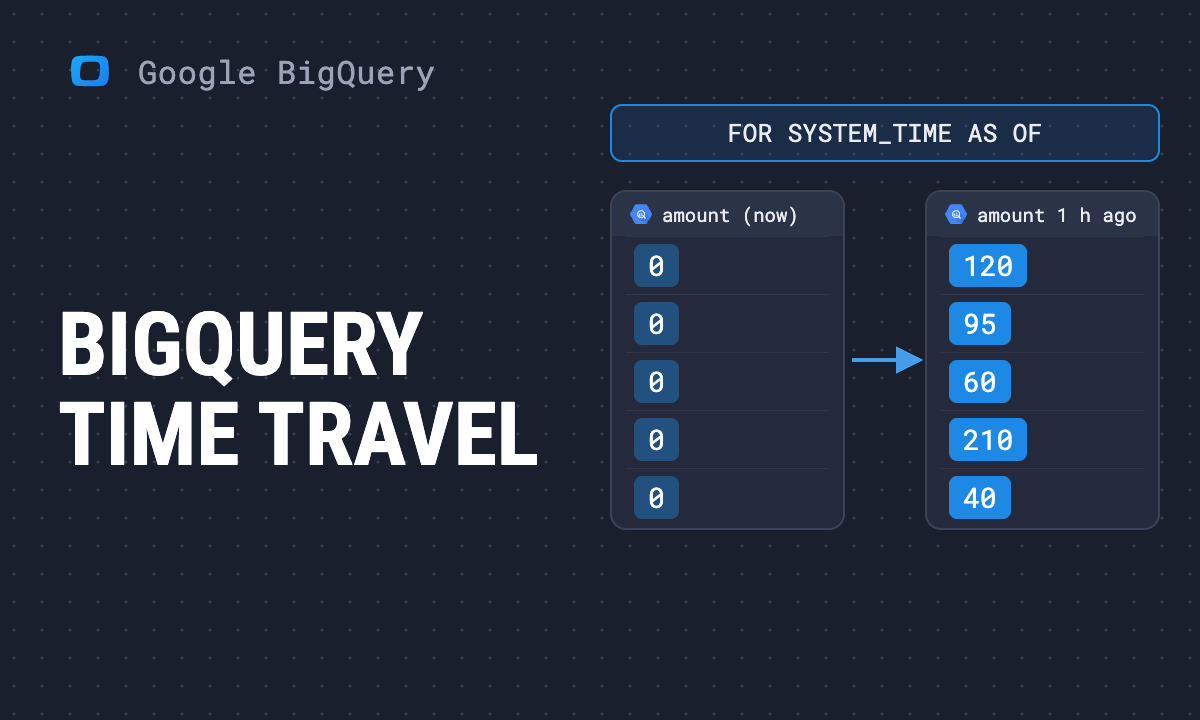 Article · Google BigQueryBigQuery time travel: FOR SYSTEM_TIME AS OF, the window and examples
 Article · Google BigQueryBigQuery export to CSV: query results, tables, Sheets and Excel
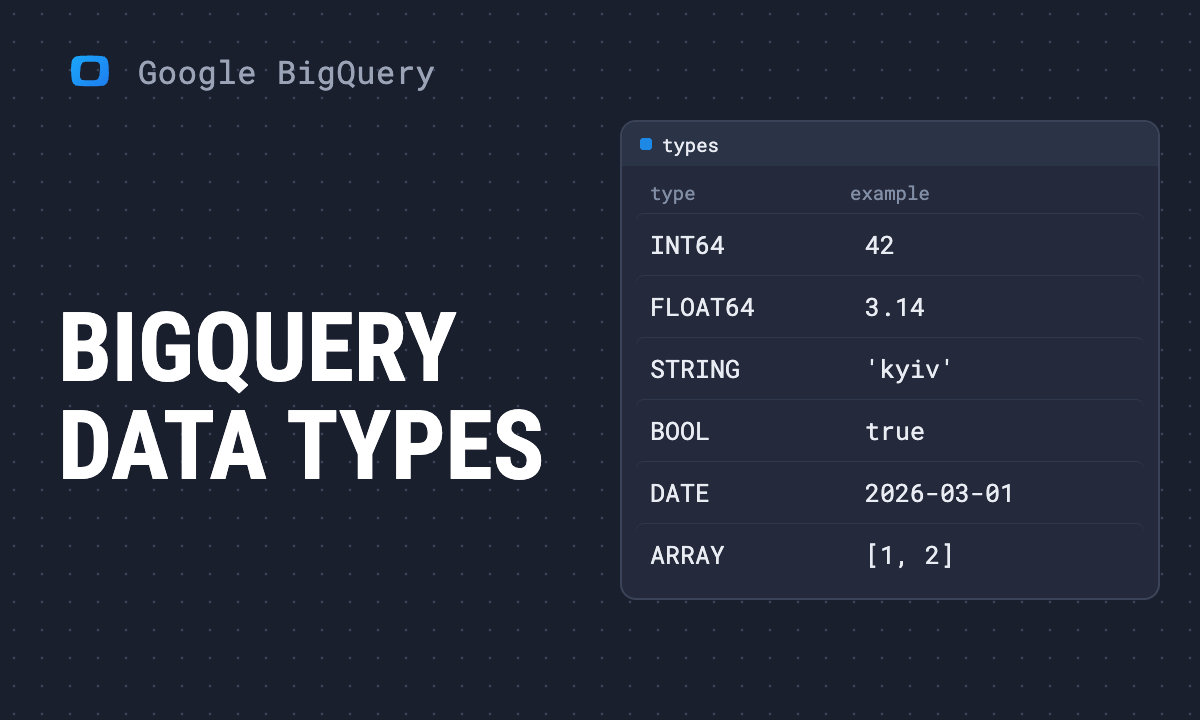 Article · Google BigQueryBigQuery data types: which to use, with limits and tested examples
 Article · Google BigQueryBigQuery console guide: BigQuery Studio, the query editor and job history
 Article · Google BigQueryBigQuery visualization tools: Data Studio, Looker, Sheets, Power BI, Tableau and Excel compared
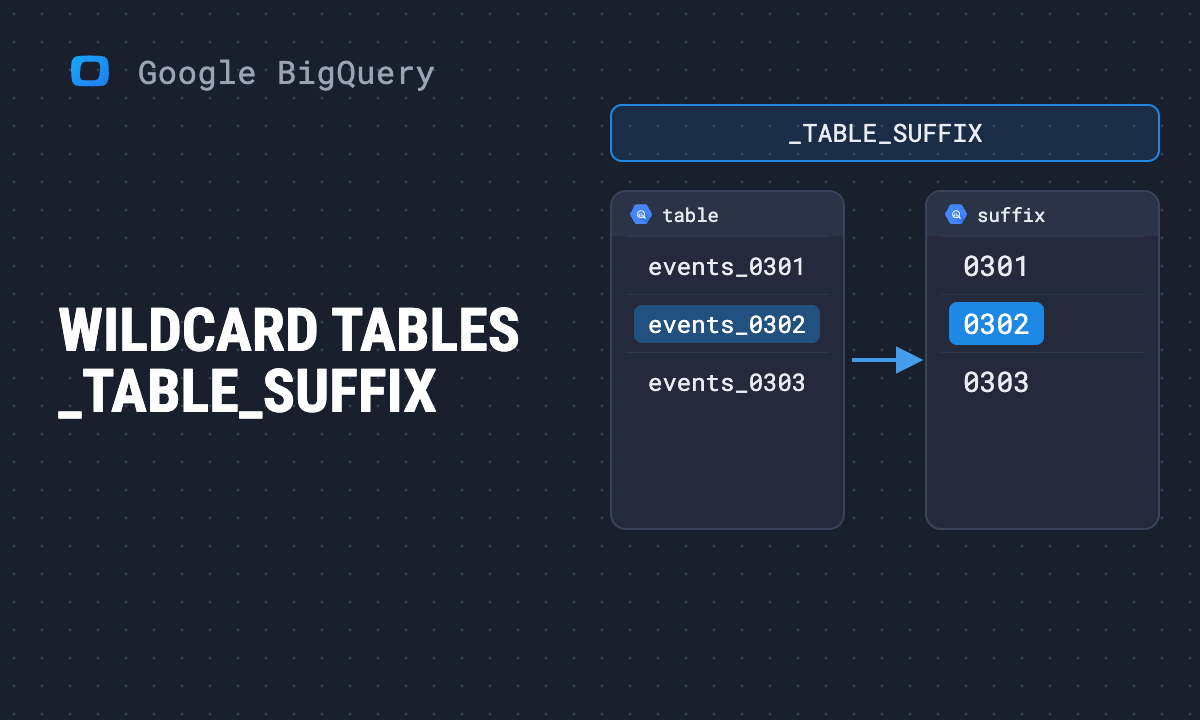 Article · Google BigQueryBigQuery wildcard tables and _TABLE_SUFFIX, with measured costs
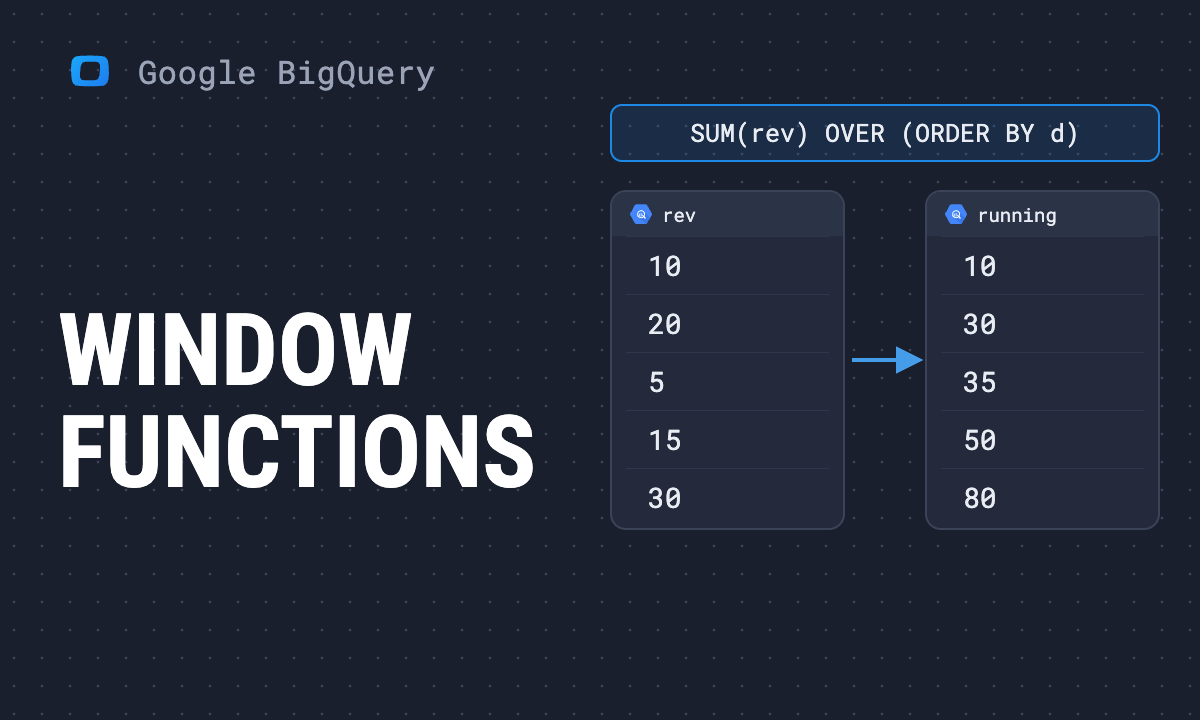 Article · Google BigQueryBigQuery window functions: OVER, PARTITION BY, frames and LAG, with examples
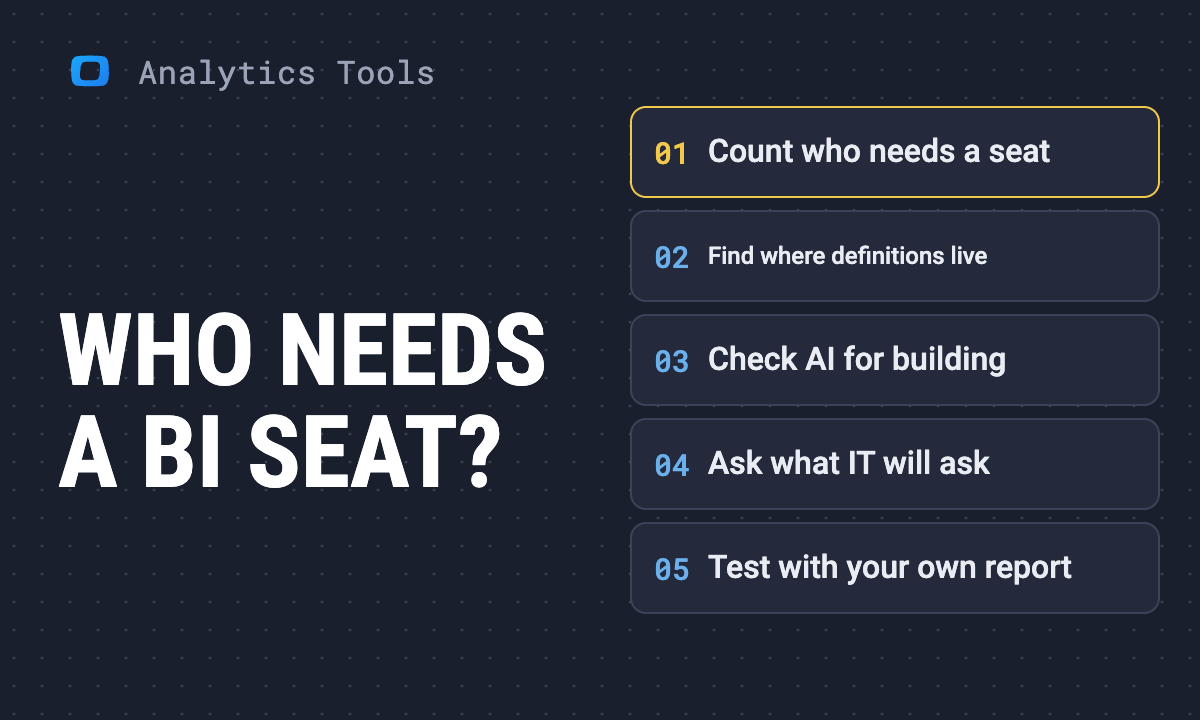 Article · Analytics ToolsHow to Choose a BI Tool When Per-User Licensing is the Problem
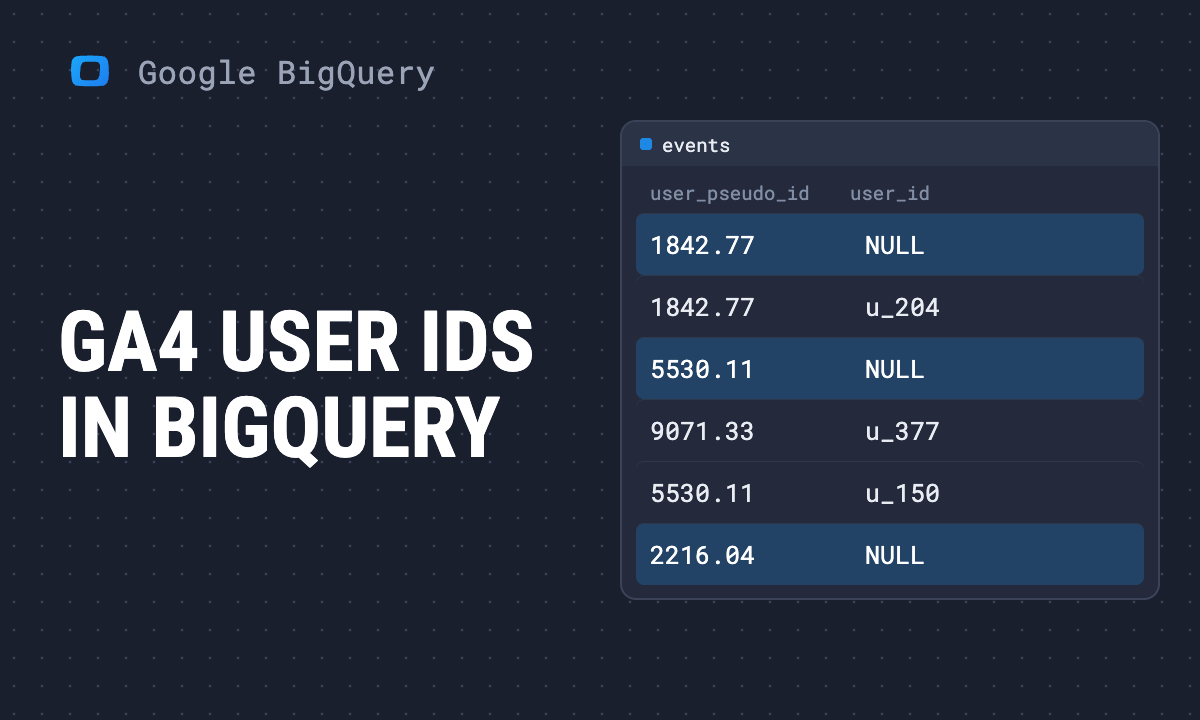 Article · Google BigQueryGA4 user properties in BigQuery: user_id, user_pseudo_id, first touch and LTV
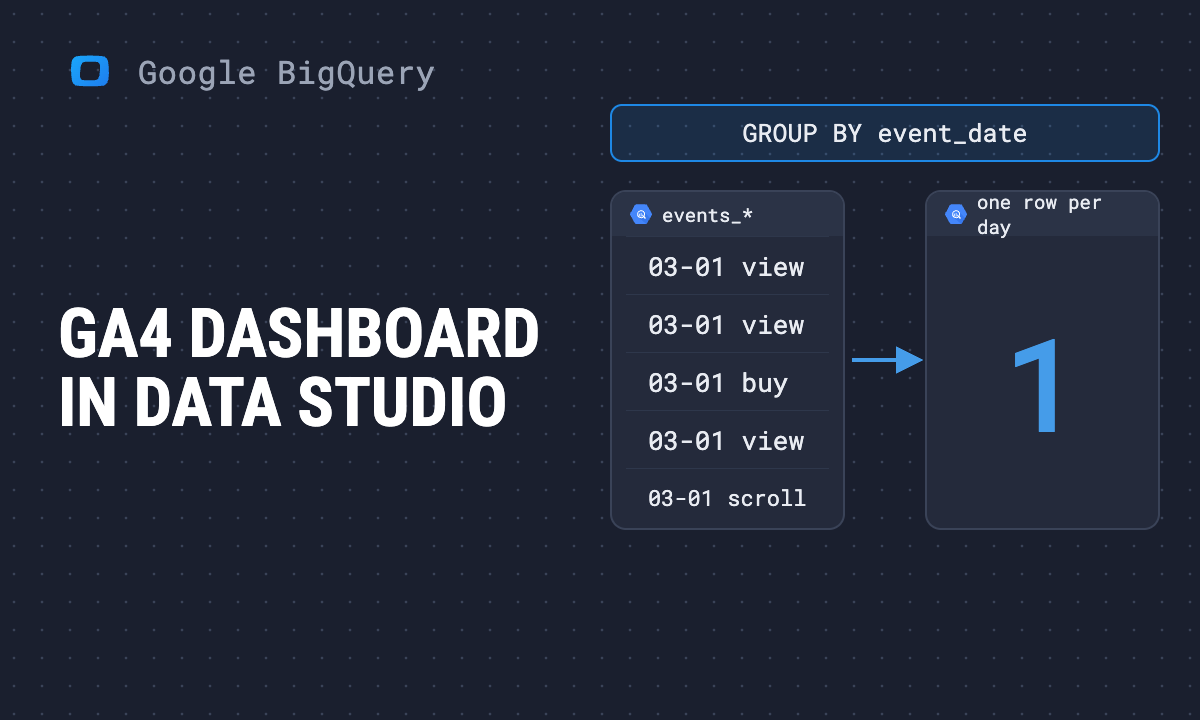 Article · Google BigQueryGA4 BigQuery dashboard in Data Studio: a flat daily table, not events_*
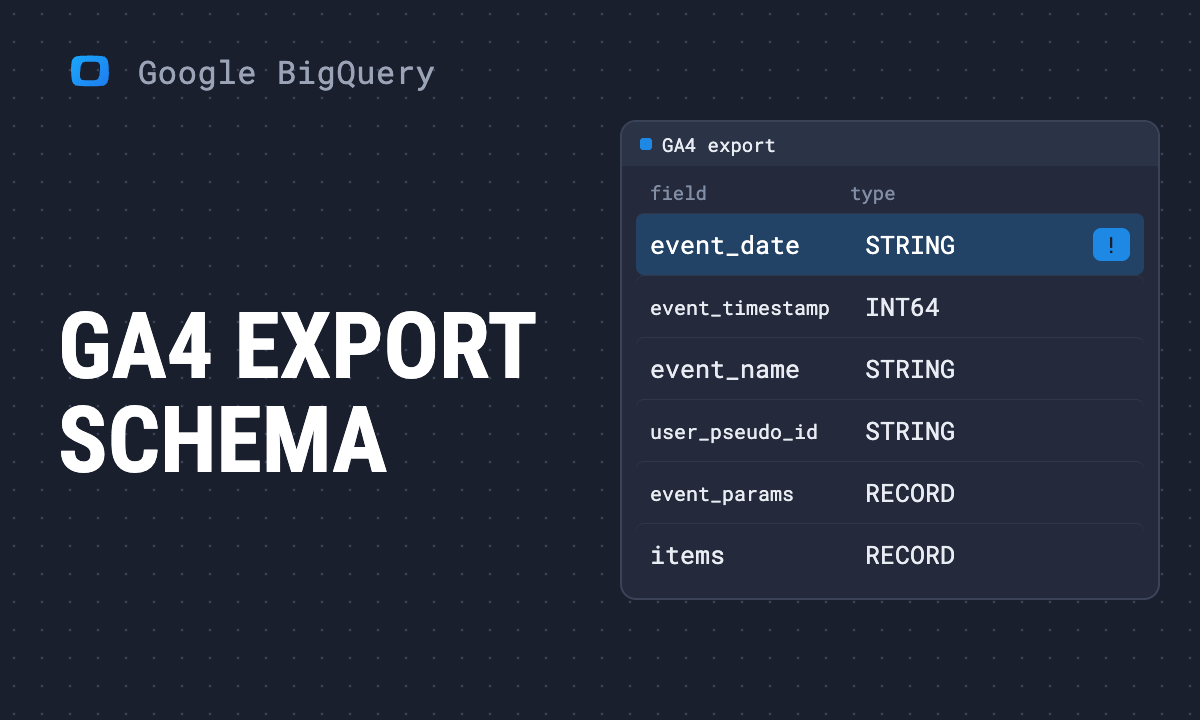 Article · Google BigQueryGA4 BigQuery Export schema: the tables, the fields and how dates work
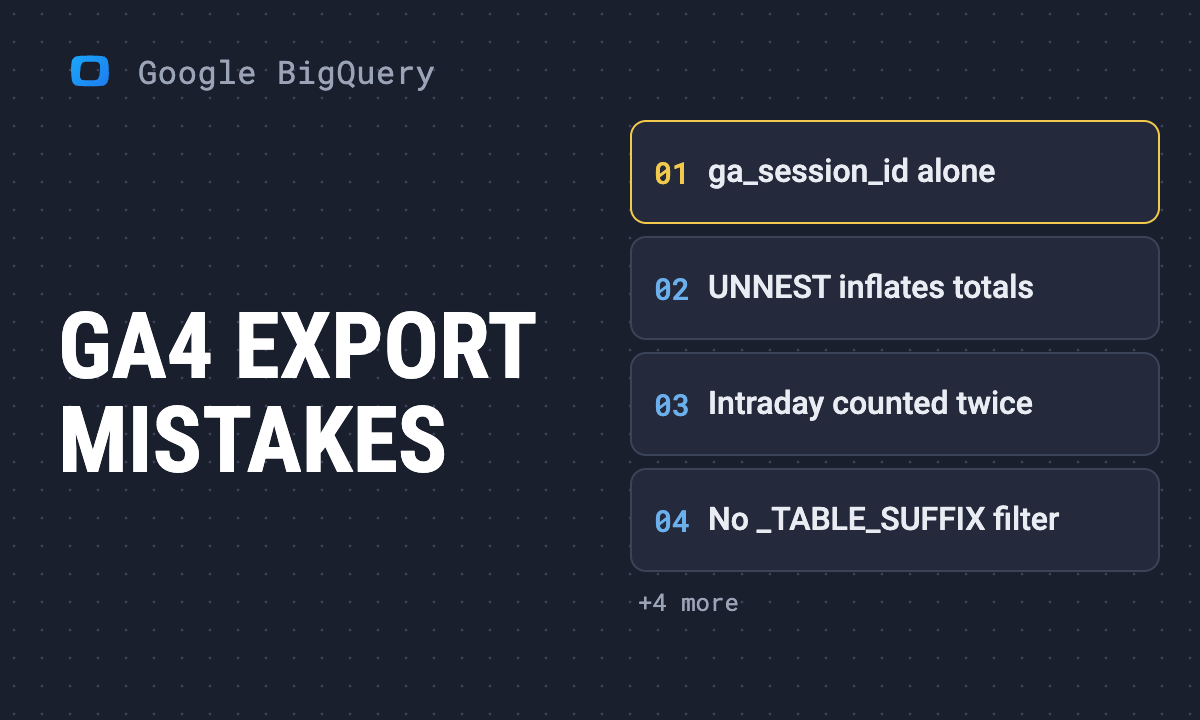 Article · Google BigQueryGA4 BigQuery Export mistakes: nine that change your numbers, and the fix for each
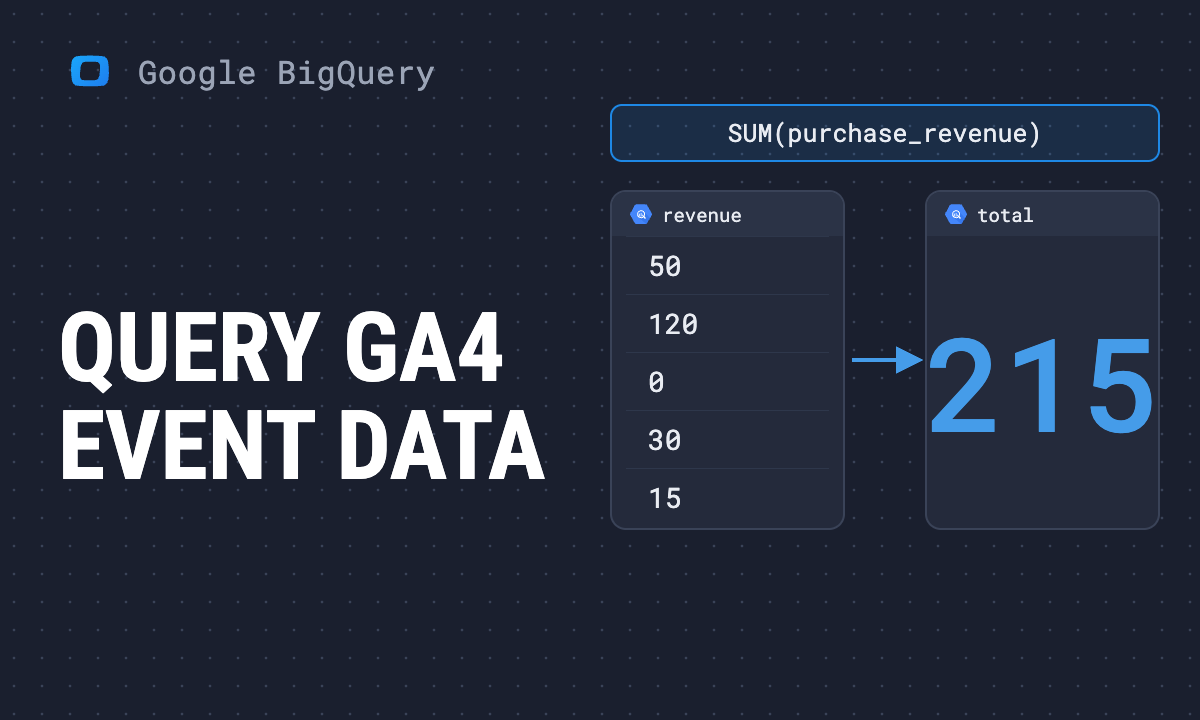 Article · Google BigQueryHow to query GA4 event data in BigQuery: sessions, sources and revenue
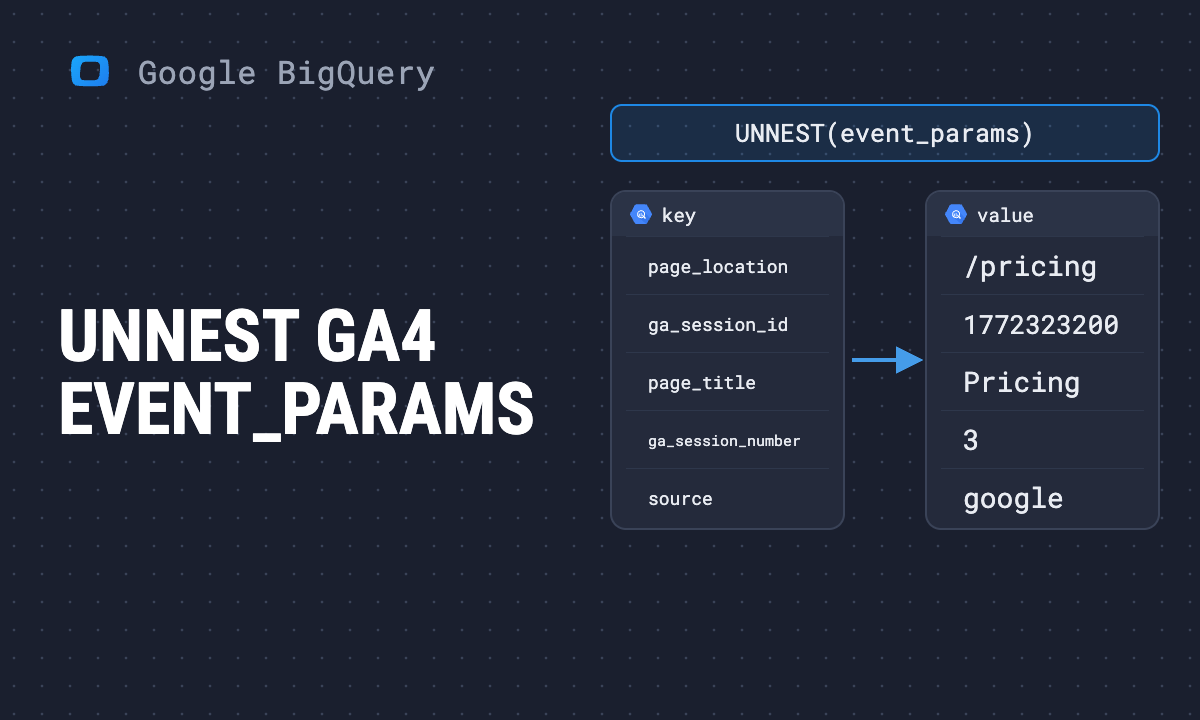 Article · Google BigQueryHow to unnest GA4 event_params in BigQuery: page_location, ga_session_id and items
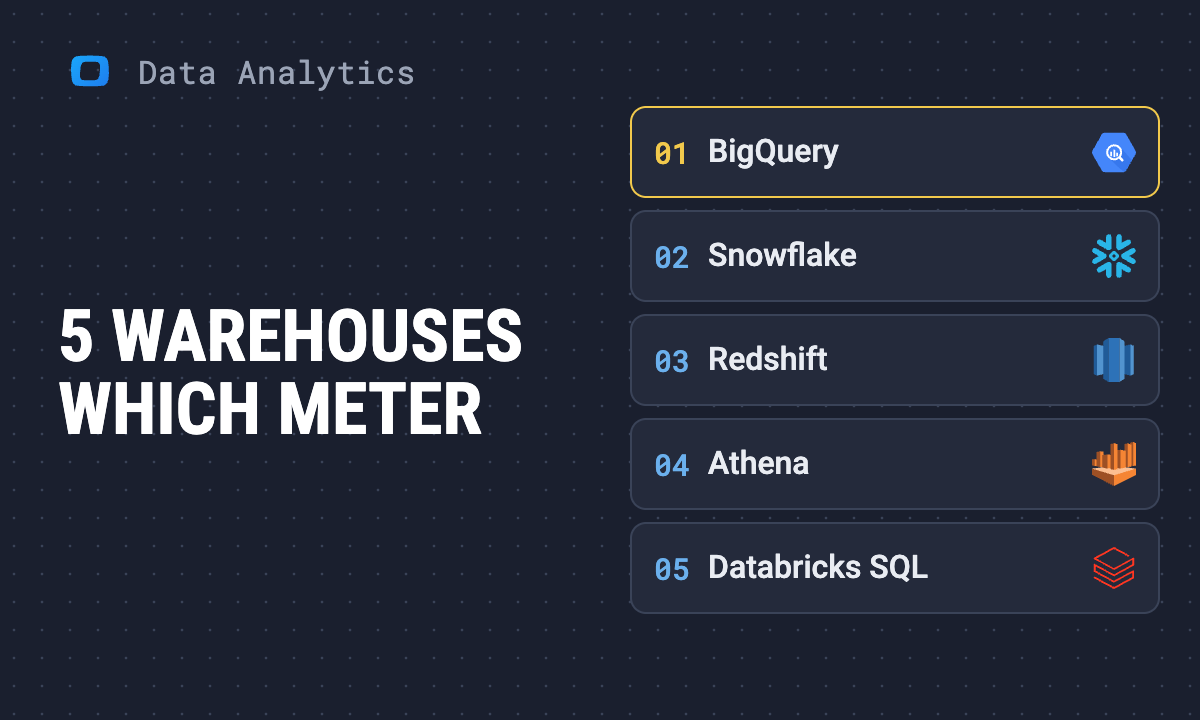 Article · Data AnalyticsHow to choose a data warehouse: BigQuery, Snowflake, Redshift, Athena and Databricks compared
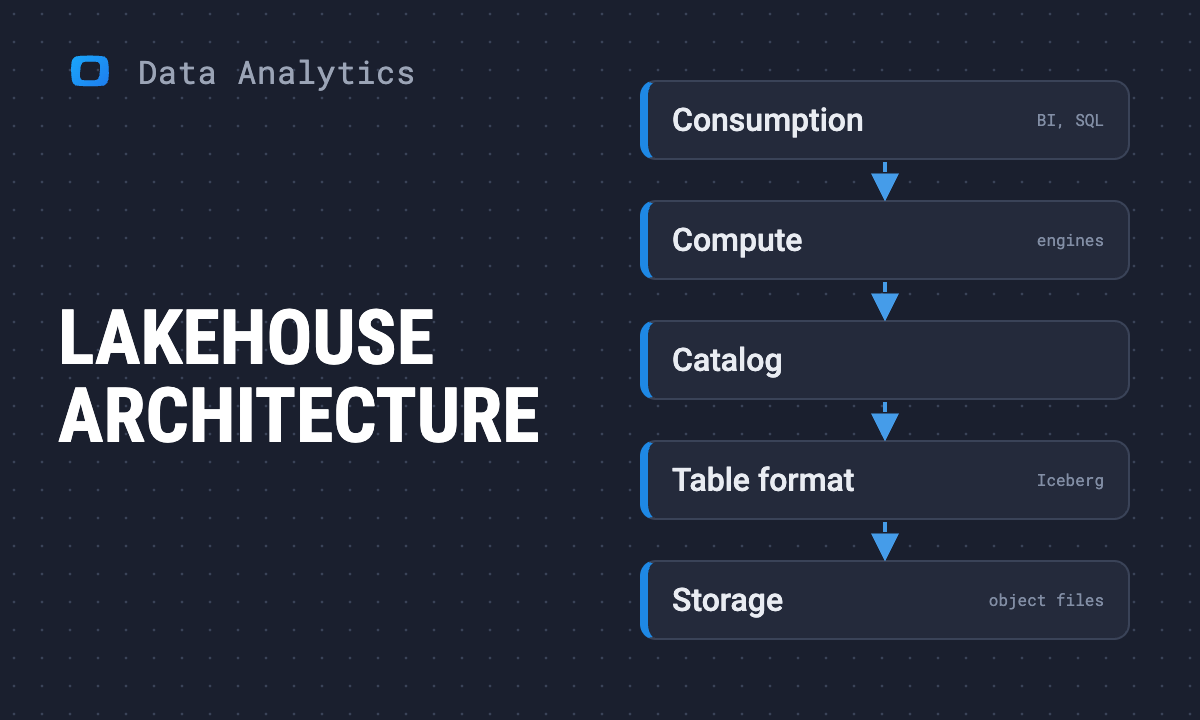 Article · Data AnalyticsData lakehouse architecture: the layers, open table formats and how to build one
 Article · Data AnalyticsData lakehouse use cases: real examples and when you need one
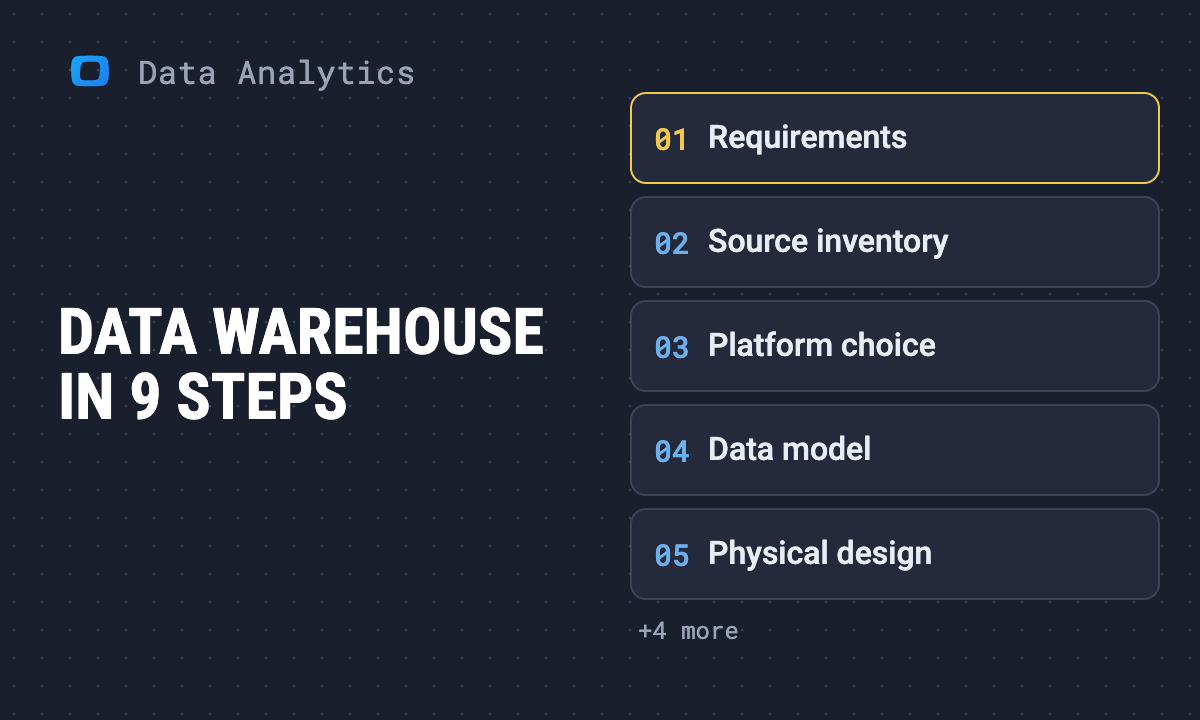 Article · Data AnalyticsData warehouse implementation: the steps and how to know each one is done
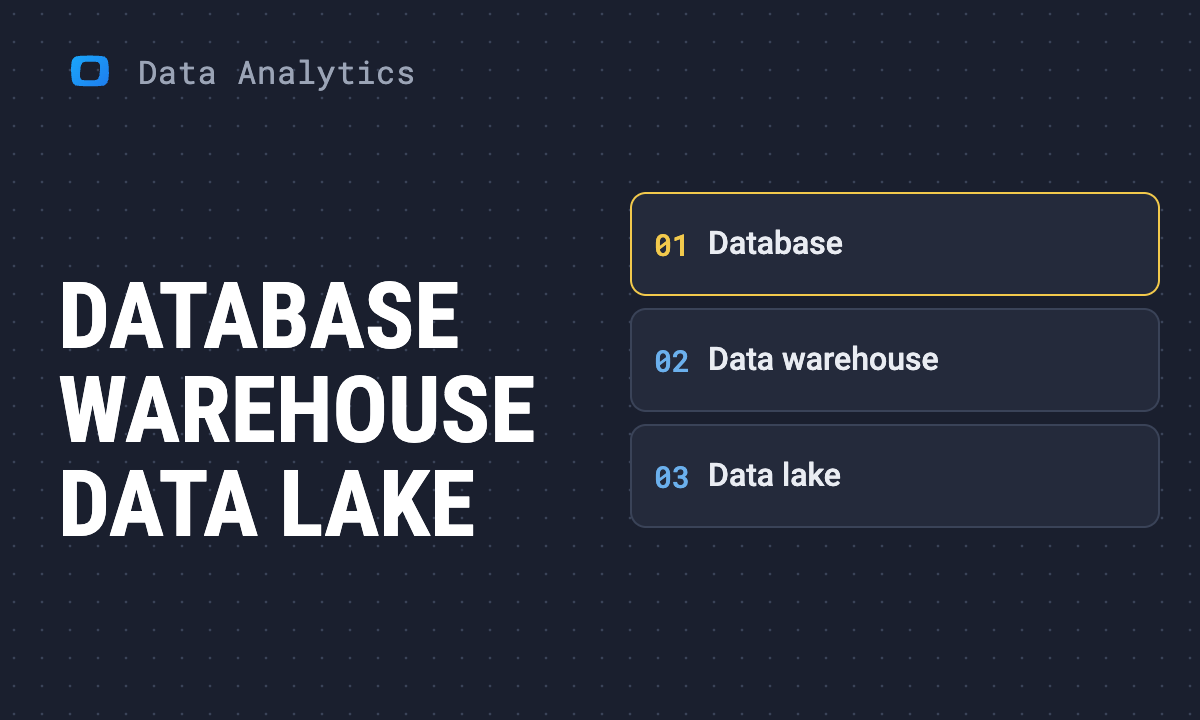 Article · Data AnalyticsDatabase vs data warehouse vs data lake: what each one is for and where your data belongs
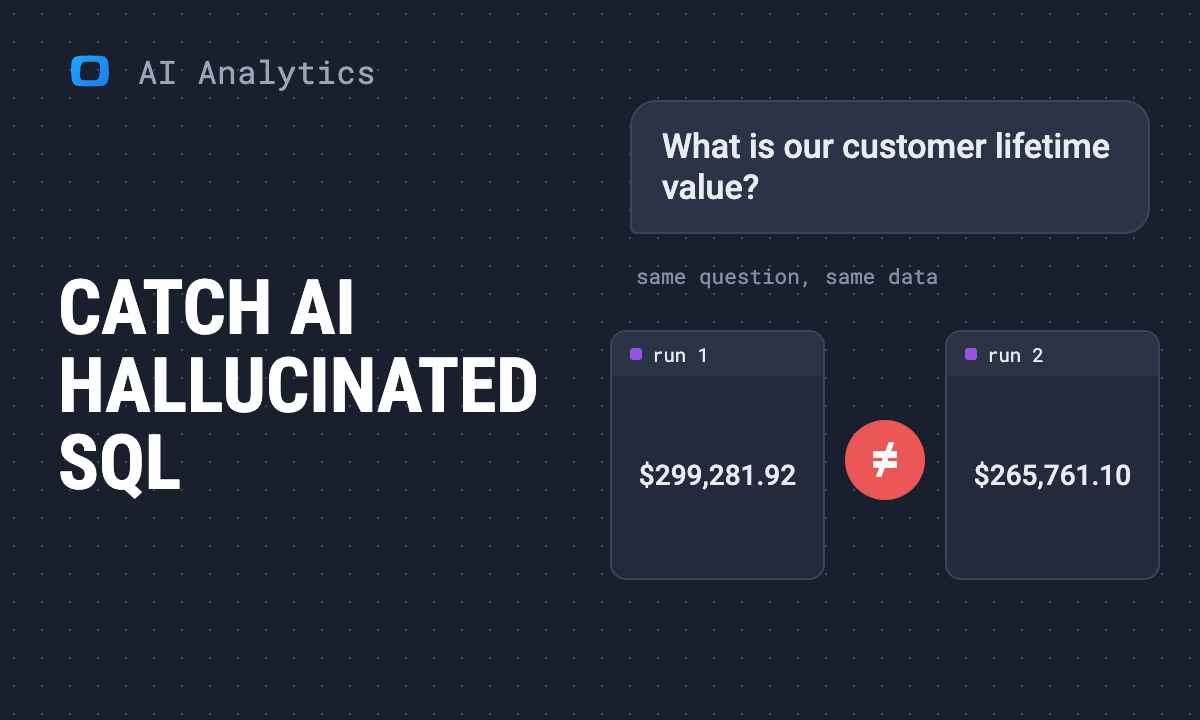 Article · AI in AnalyticsAI hallucinating SQL: what it looks like and how to catch it
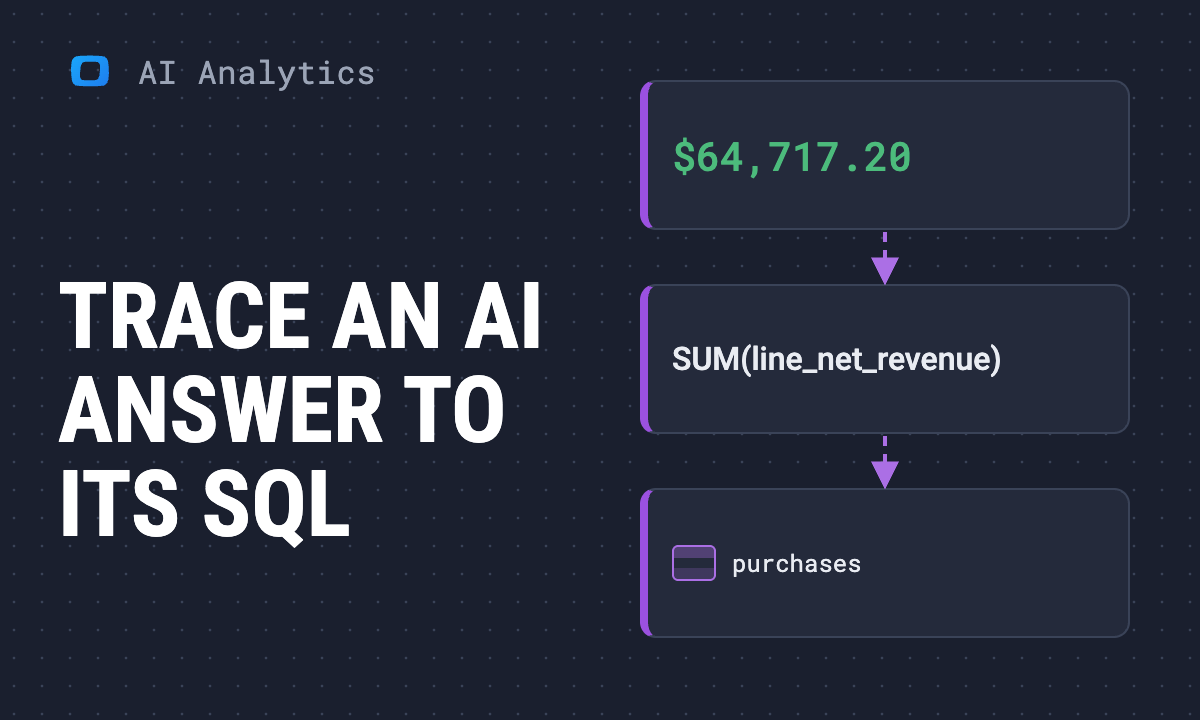 Article · AI in AnalyticsTrace an AI answer to its SQL: from number to source table
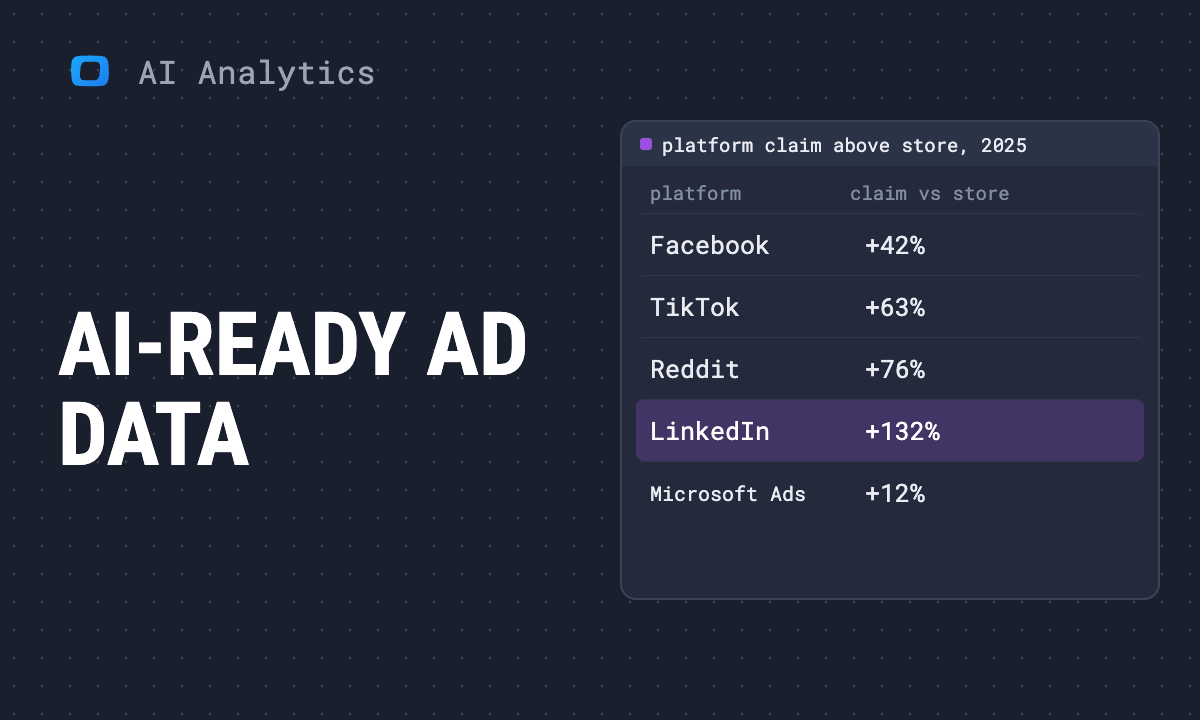 Article · AI in AnalyticsAI-ready marketing analytics data: what an AI needs from your ad data
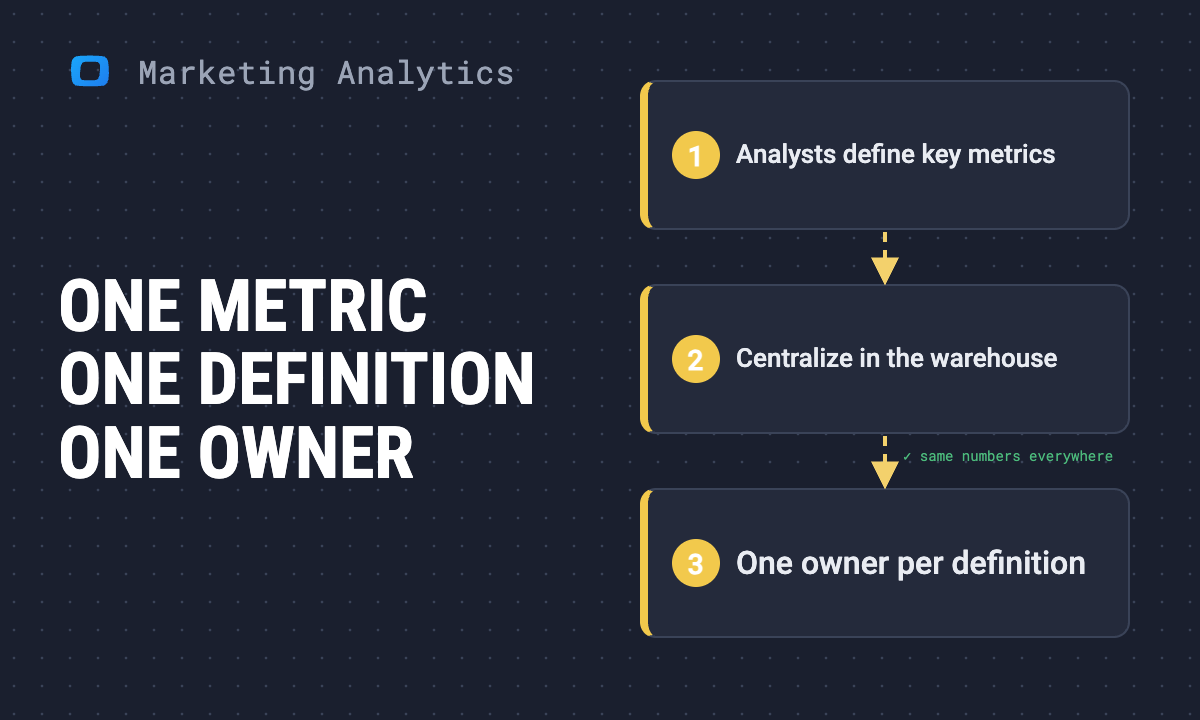 Article · Marketing AnalyticsHow to align marketing, sales and analytics teams on the same metrics
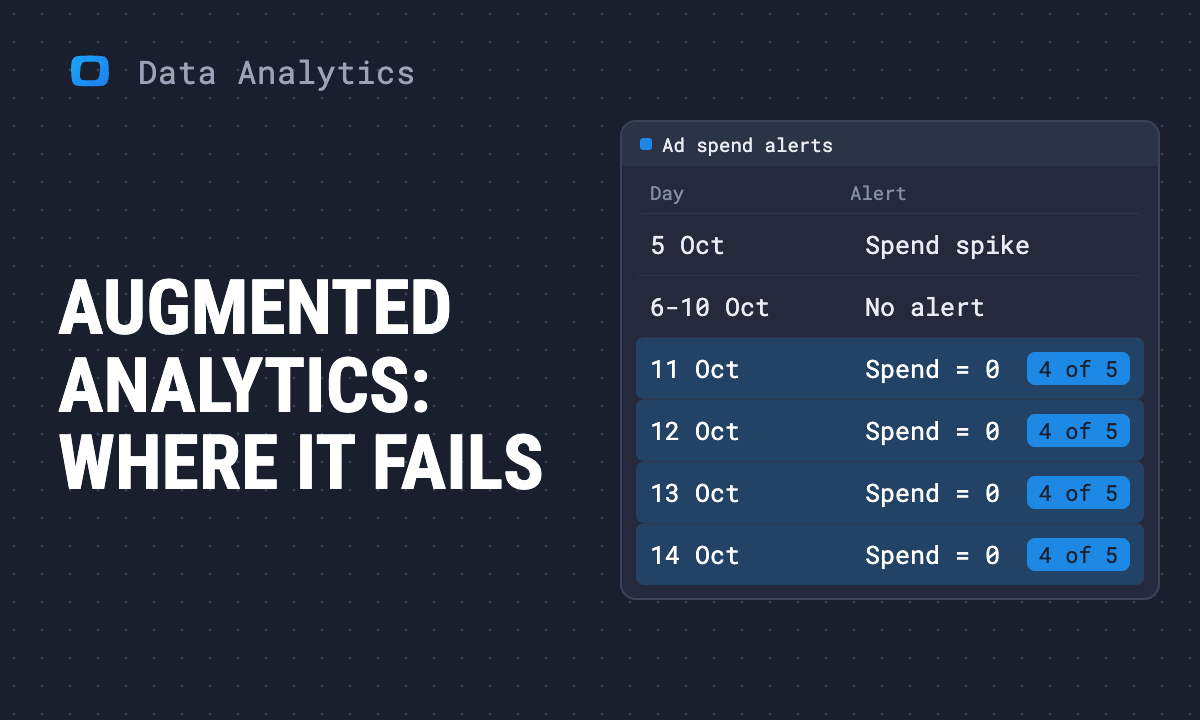 Article · Data AnalyticsAugmented analytics: what it is, use cases and examples, and where it fails
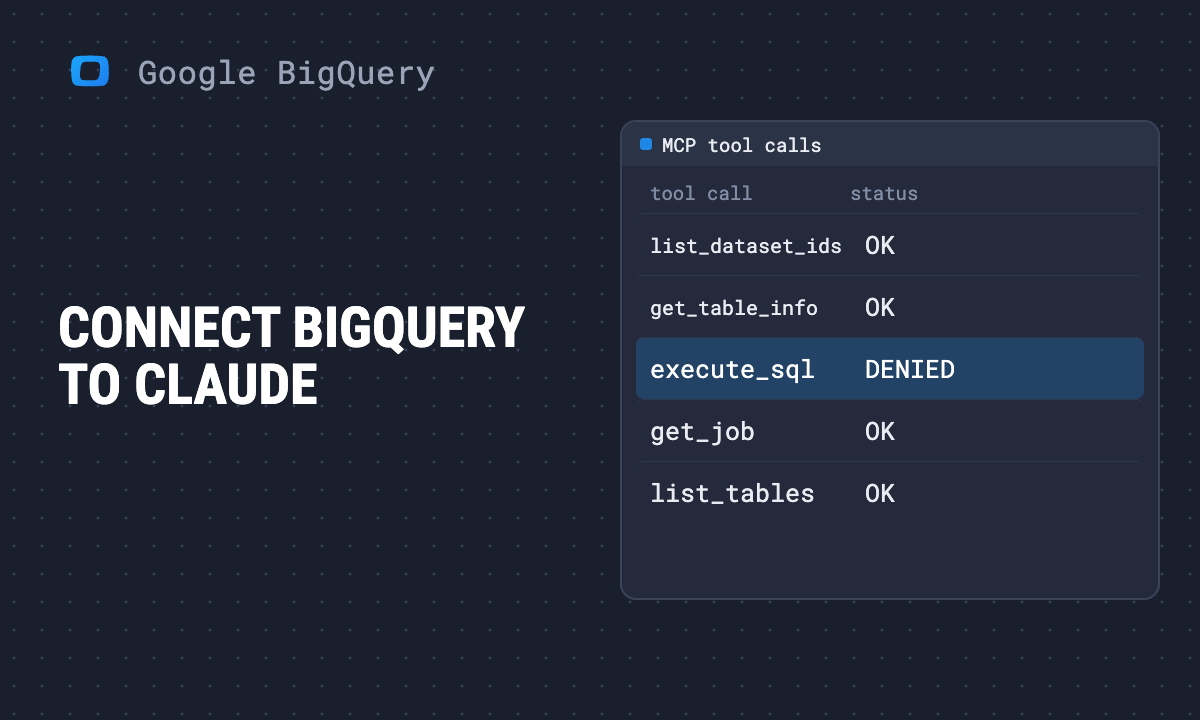 Article · Google BigQueryBigQuery MCP for Claude: connect it, see every query, check every number
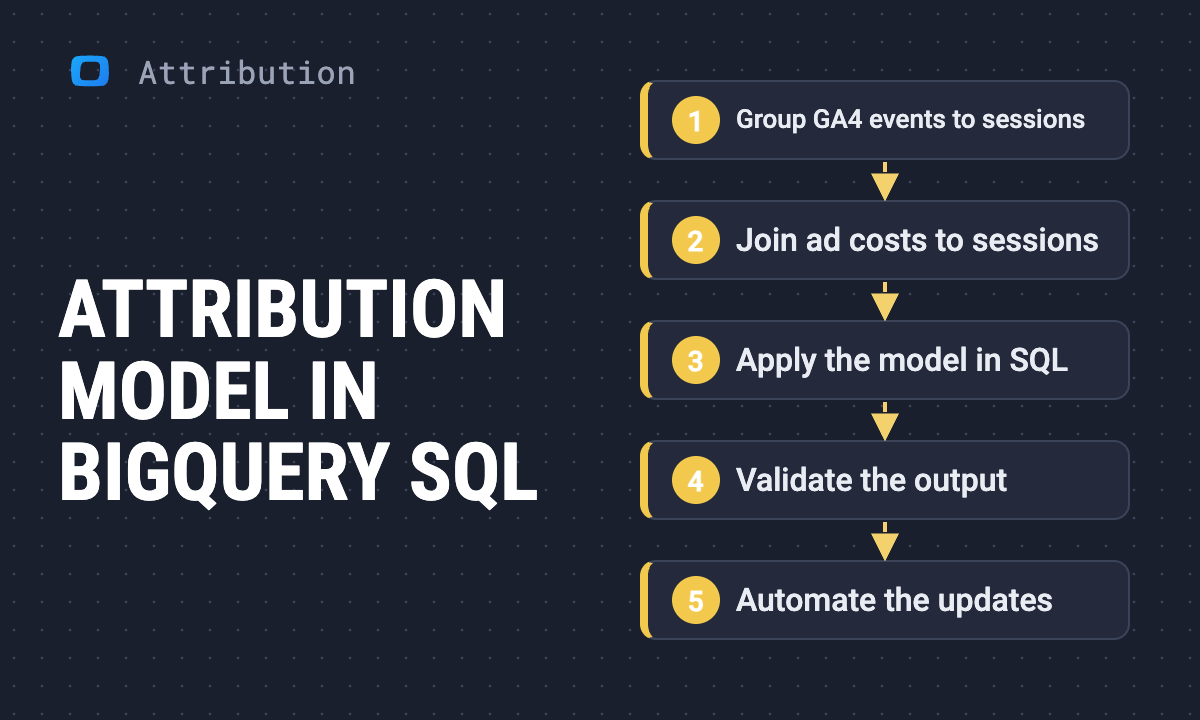 Article · Marketing AttributionHow to build a marketing attribution model in BigQuery
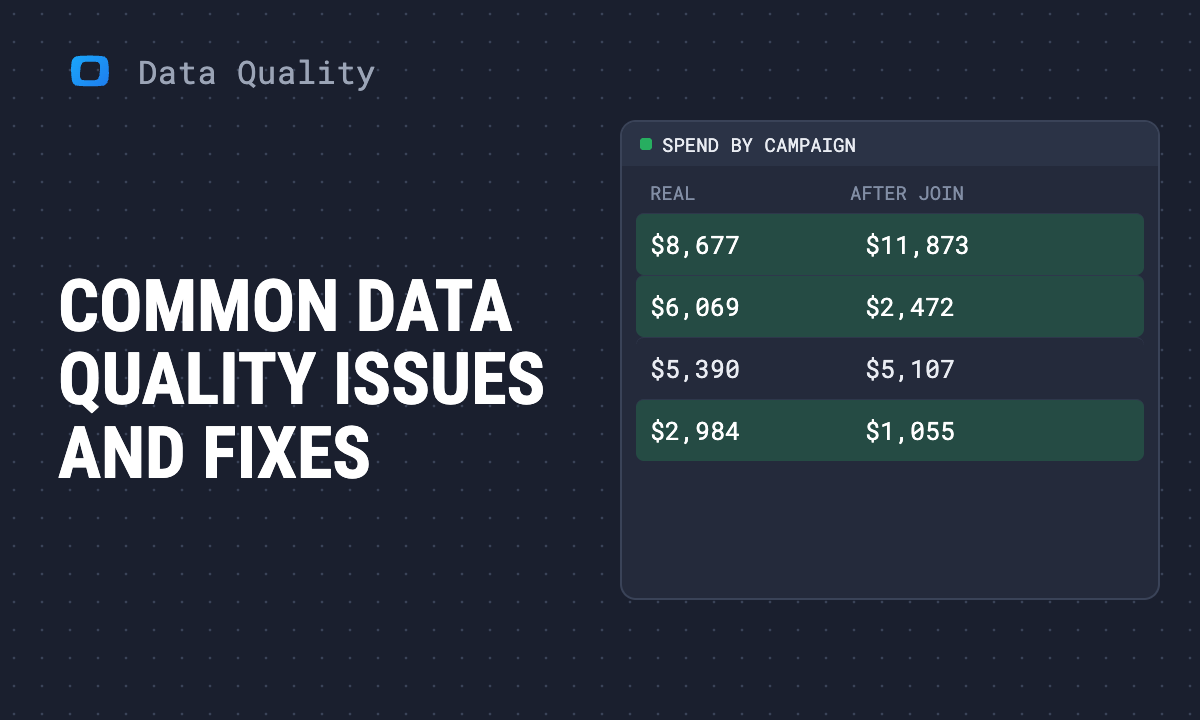 Article · Data QualityCommon data quality issues and how to fix them
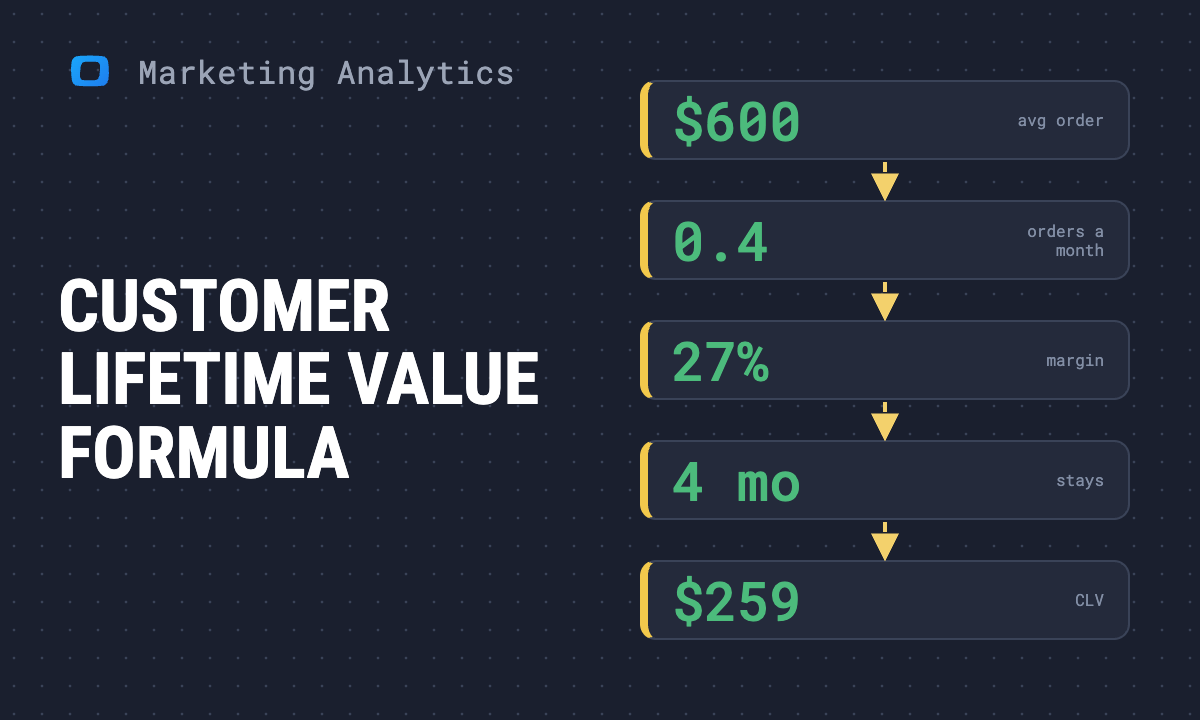 Use case · Marketing AnalyticsCustomer lifetime value: formula, calculation and analysis
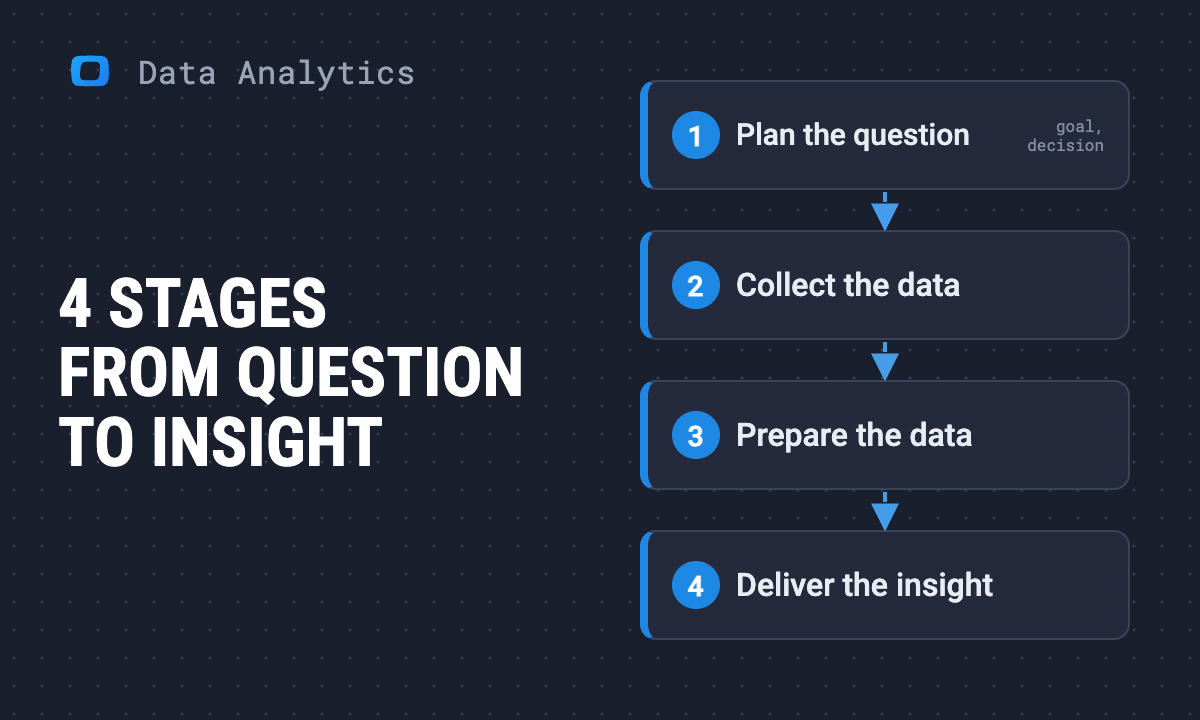 Article · Data AnalyticsThe data analysis process: 4 stages from question to delivered insight
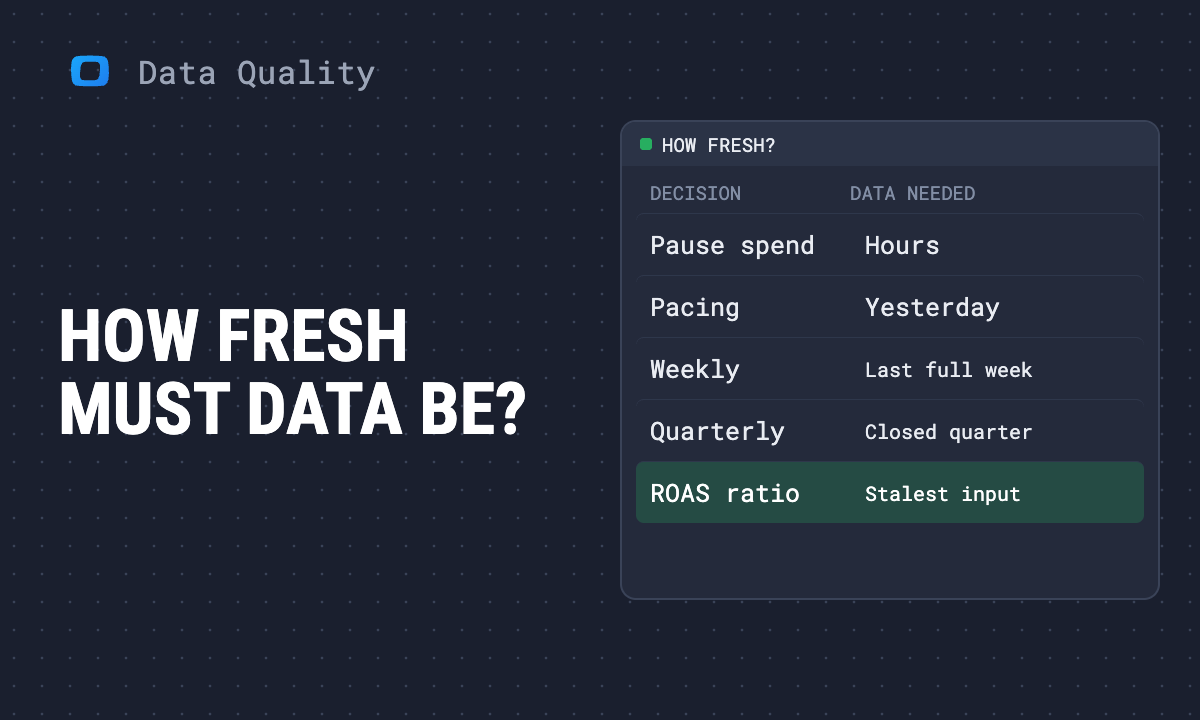 Article · Data QualityWhat is data freshness? How to measure it and how fresh a decision needs
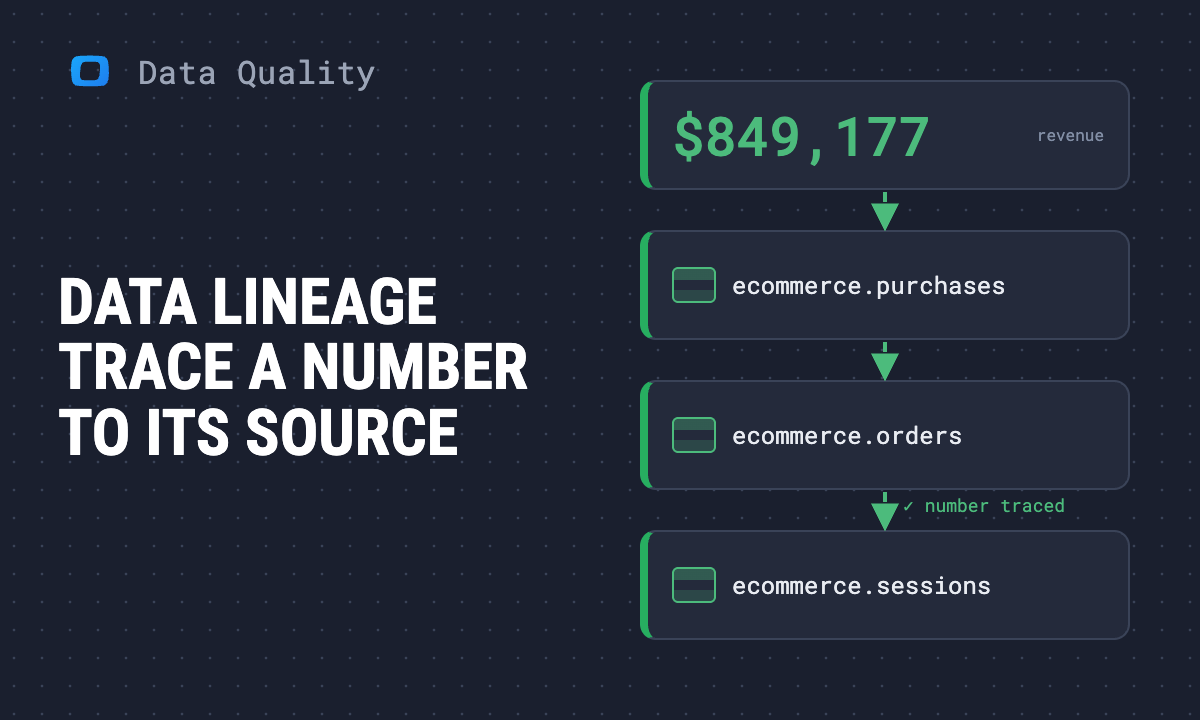 Article · Data QualityData lineage: how to trace a number back to its source
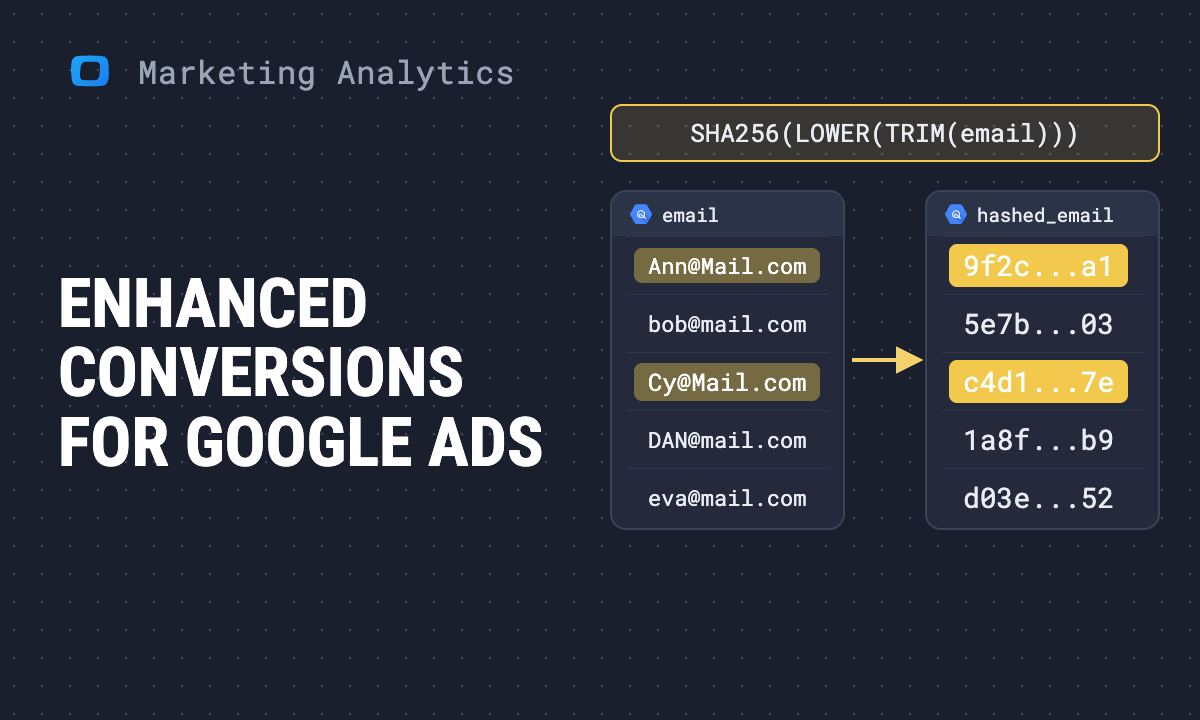 Use case · Marketing AnalyticsGoogle Ads enhanced conversions: how to set them up in 2026
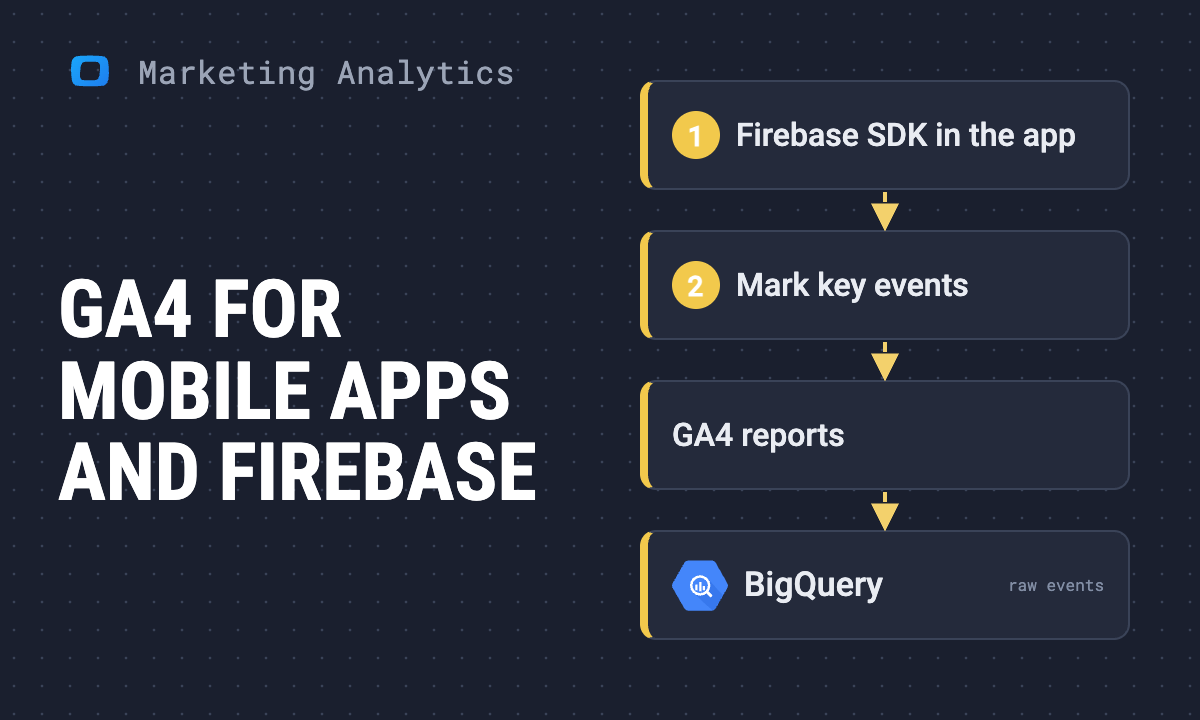 Article · Marketing AnalyticsGoogle Analytics for mobile apps: a GA4 and Firebase guide
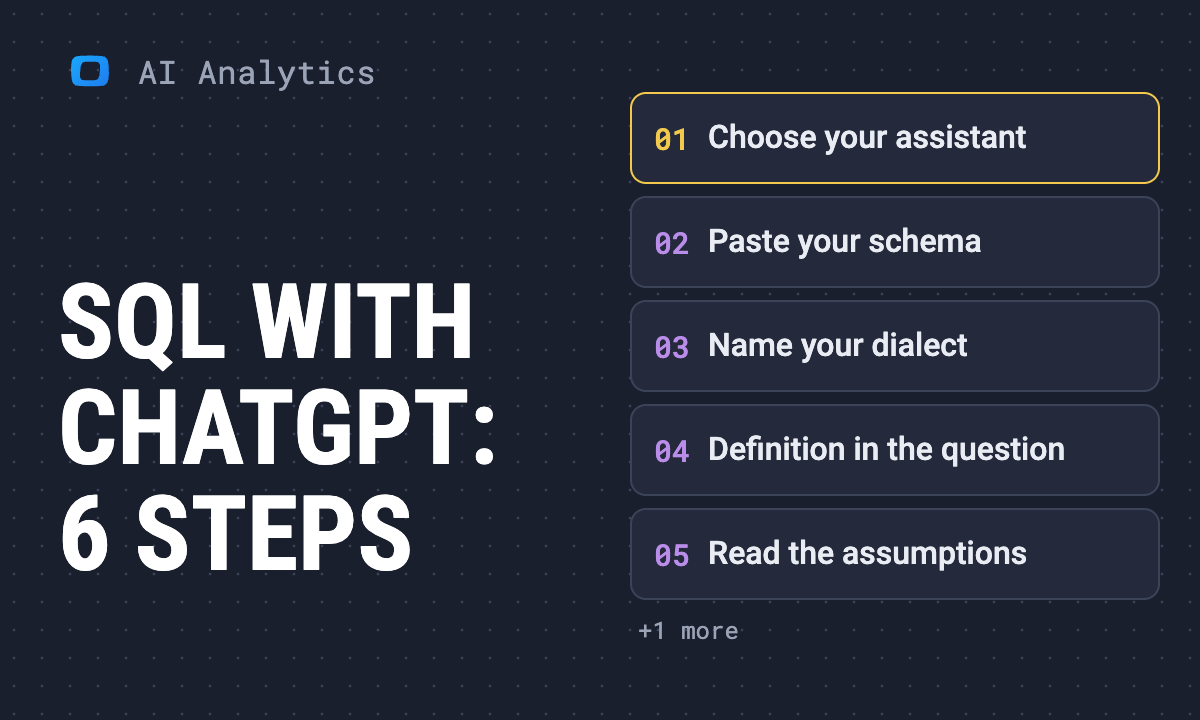 Article · AI in AnalyticsUsing ChatGPT to write SQL for your reports: six steps and a check
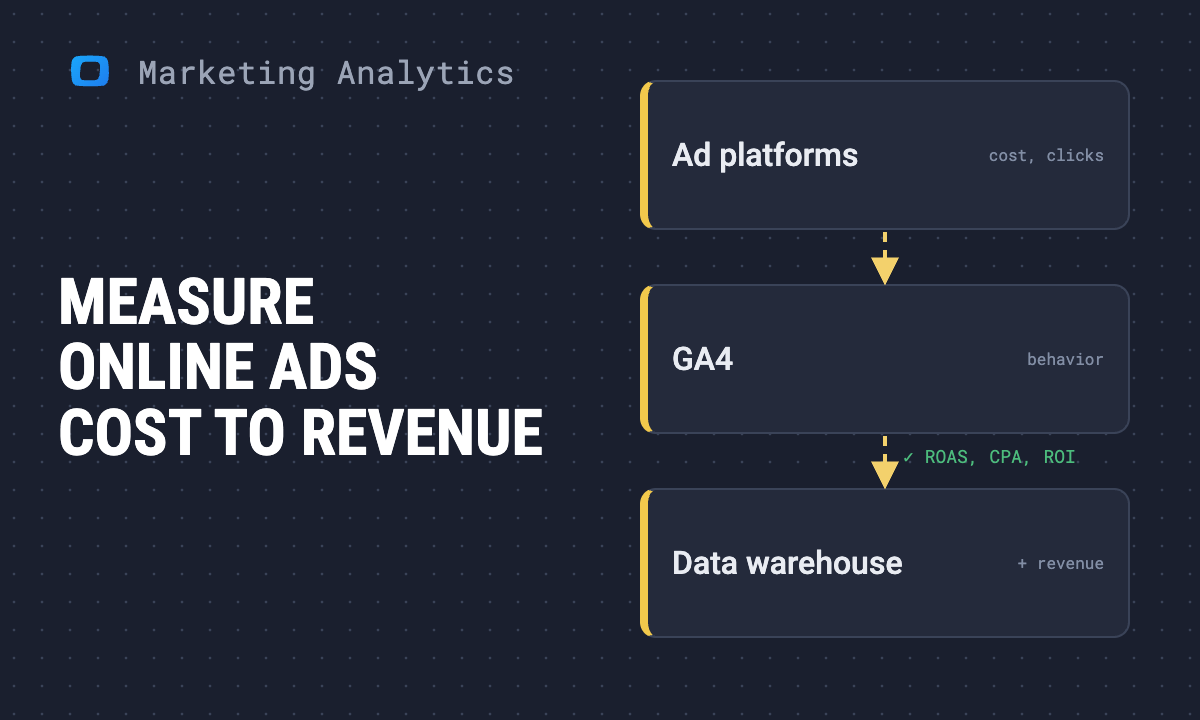 Use case · Marketing AnalyticsHow to measure online advertising effectiveness
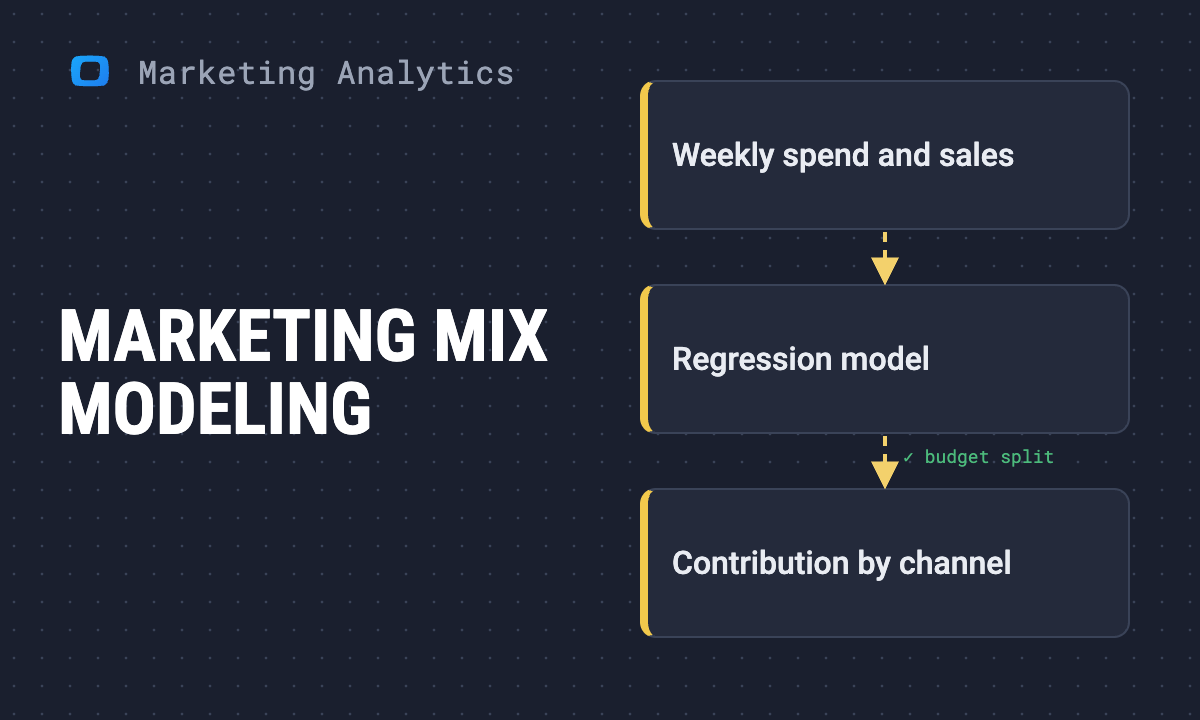 Article · Marketing AnalyticsHow to use marketing mix modeling to increase ROI
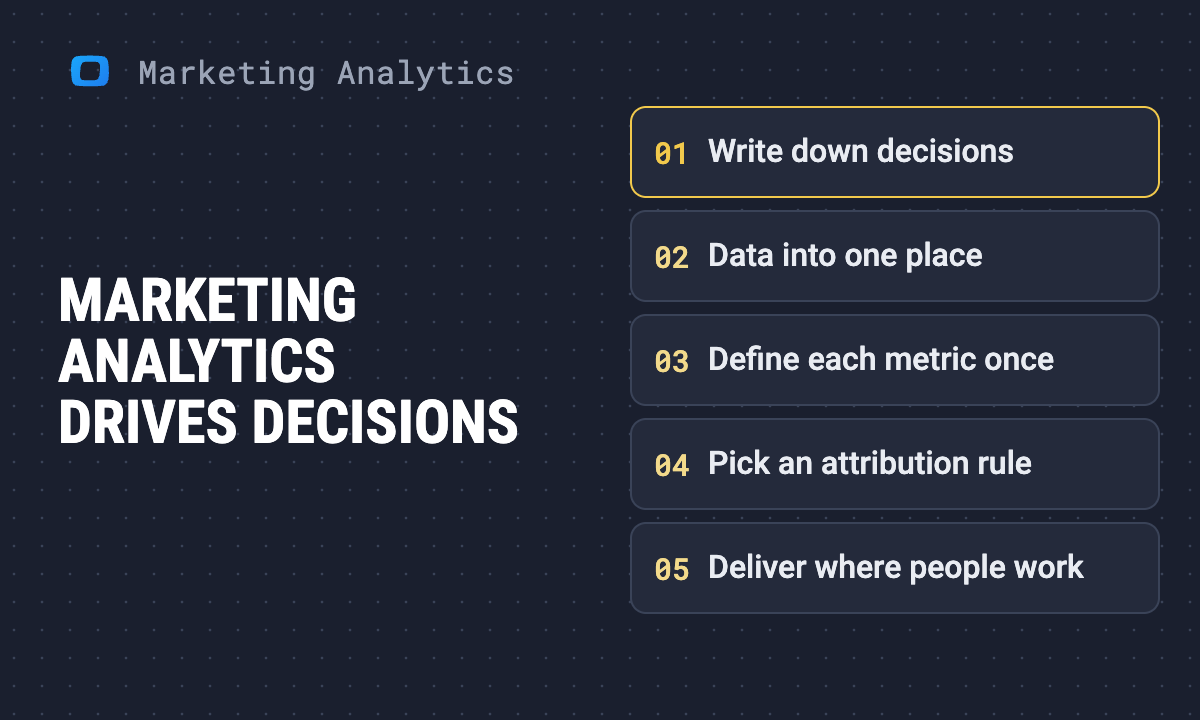 Article · Marketing AnalyticsMarketing analytics: what it is and how it drives better decisions
 Article · AI in AnalyticsMCP and your data warehouse: where cross-tool joins belong
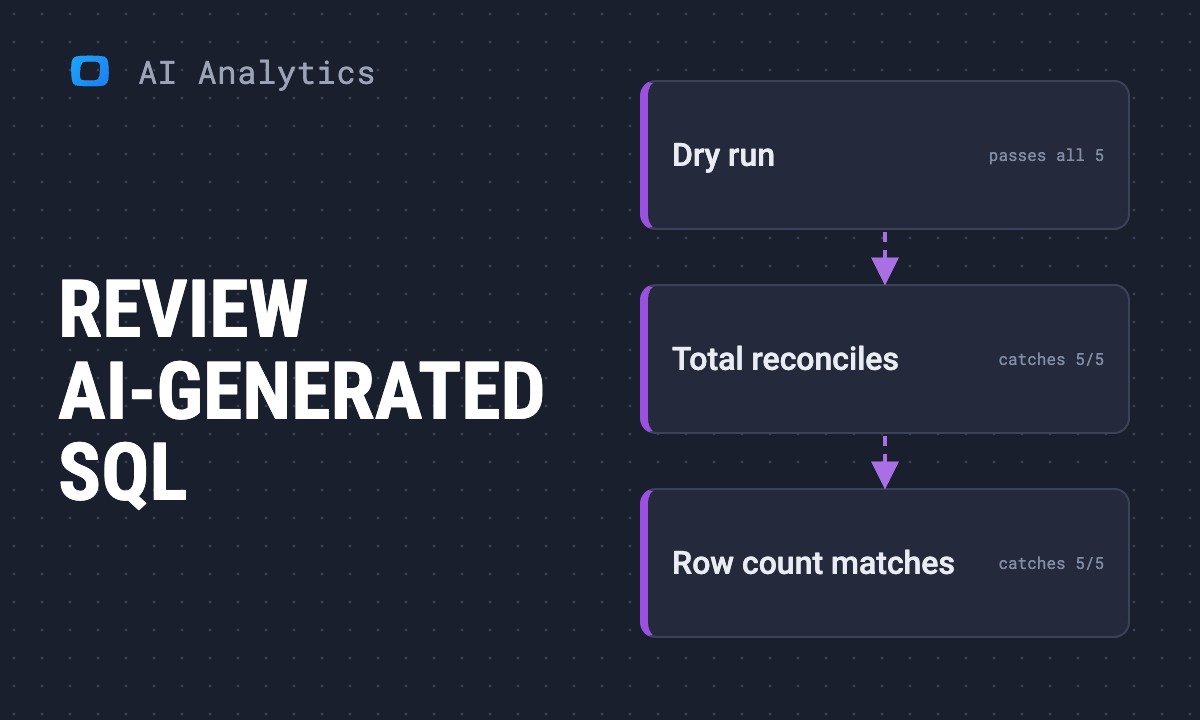 Article · AI in AnalyticsHow to Review AI-Generated SQL: The Checks, in Order, Tested on ChatGPT and Claude
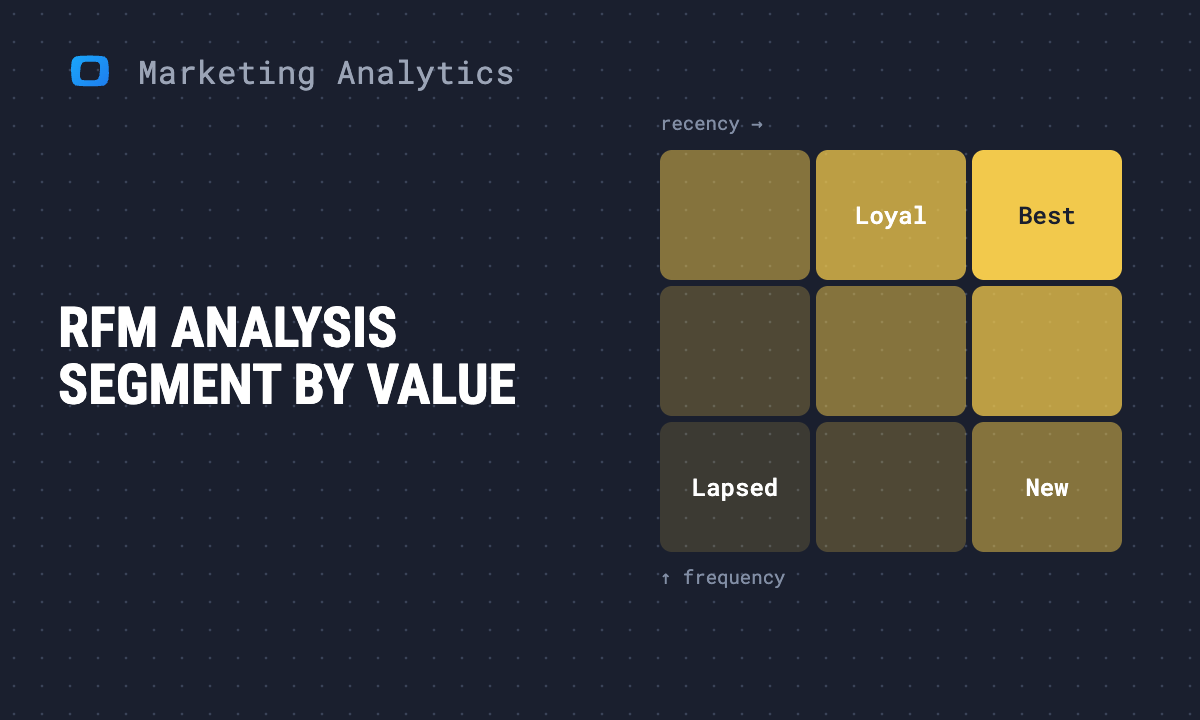 Use case · Marketing AnalyticsRFM analysis: how to segment customers by recency, frequency and value
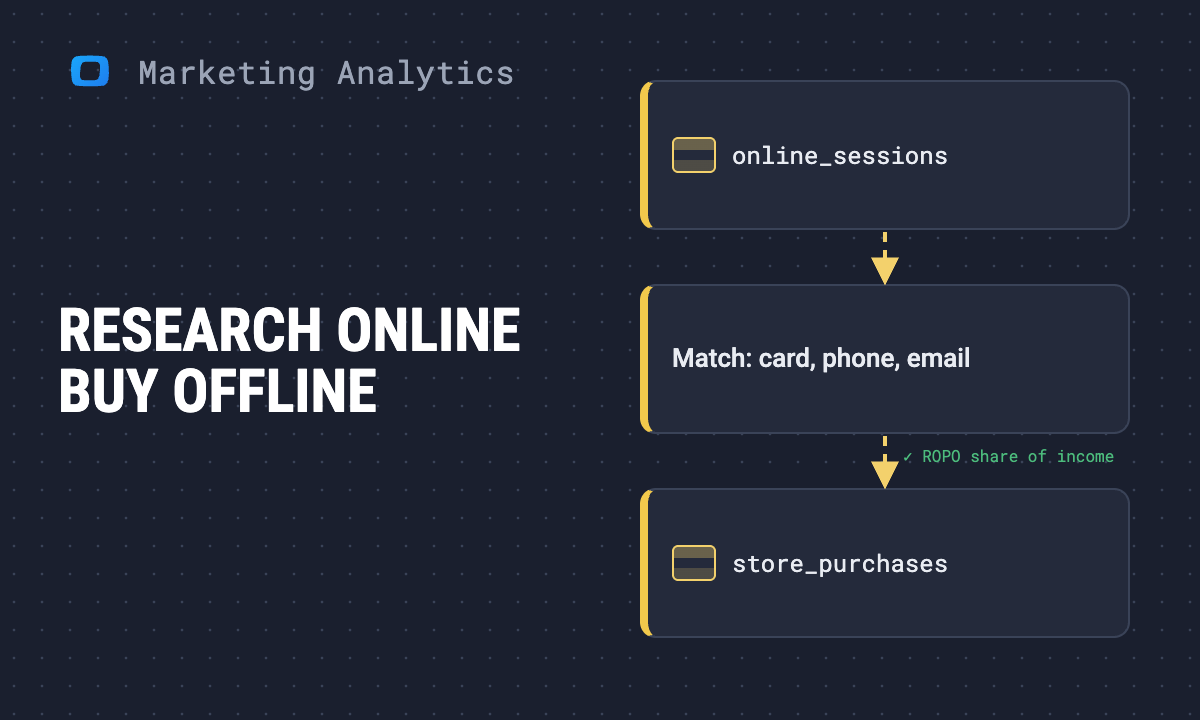 Article · Marketing AnalyticsWhat is the ROPO effect and how to measure it
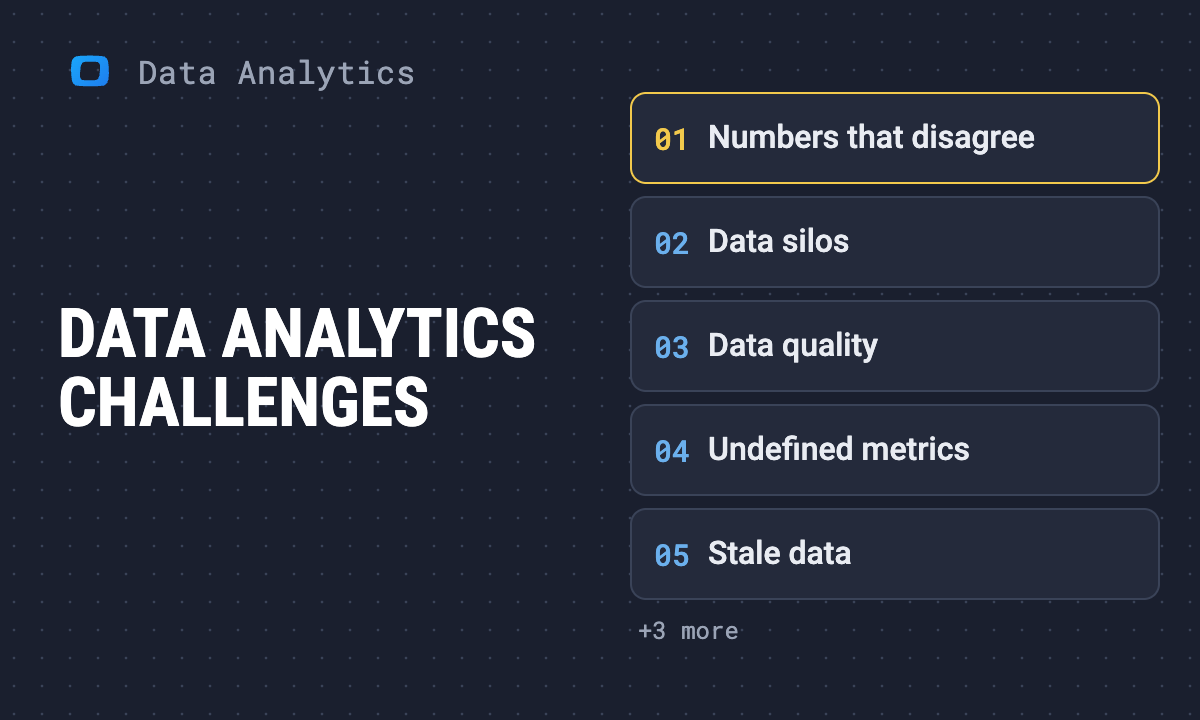 Article · Data AnalyticsData analytics challenges: what they look like and what to fix first
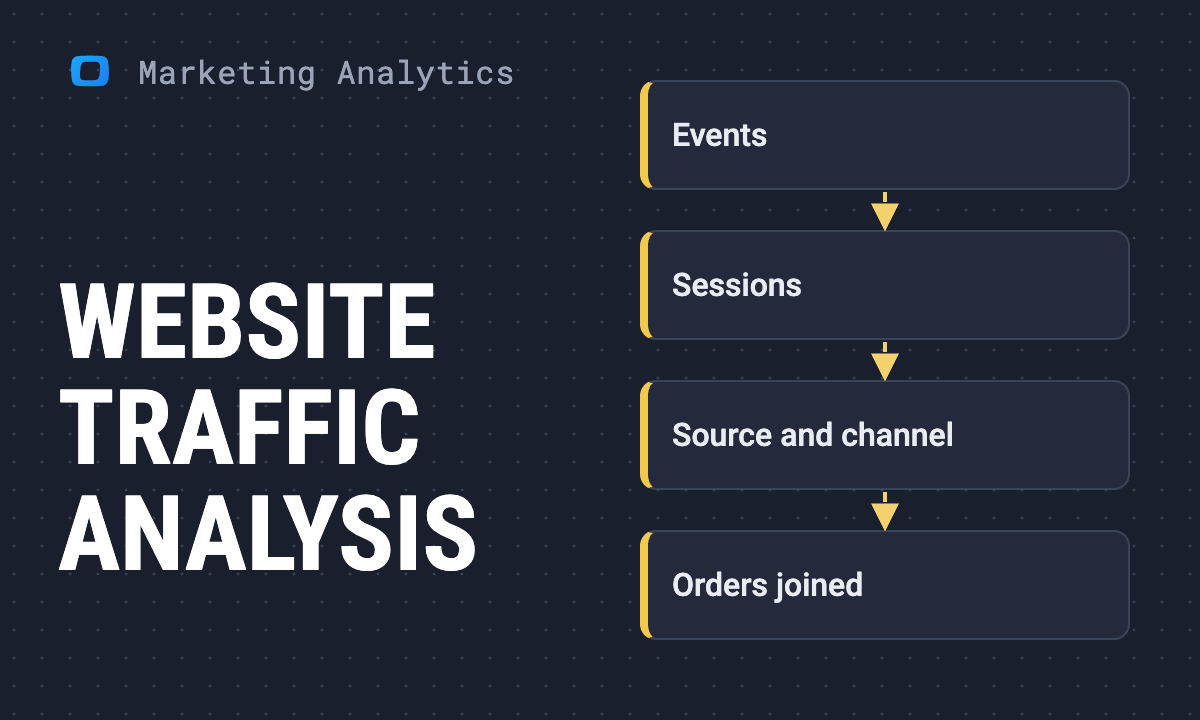 Use case · Marketing AnalyticsWebsite traffic analysis: what it is and how to do it
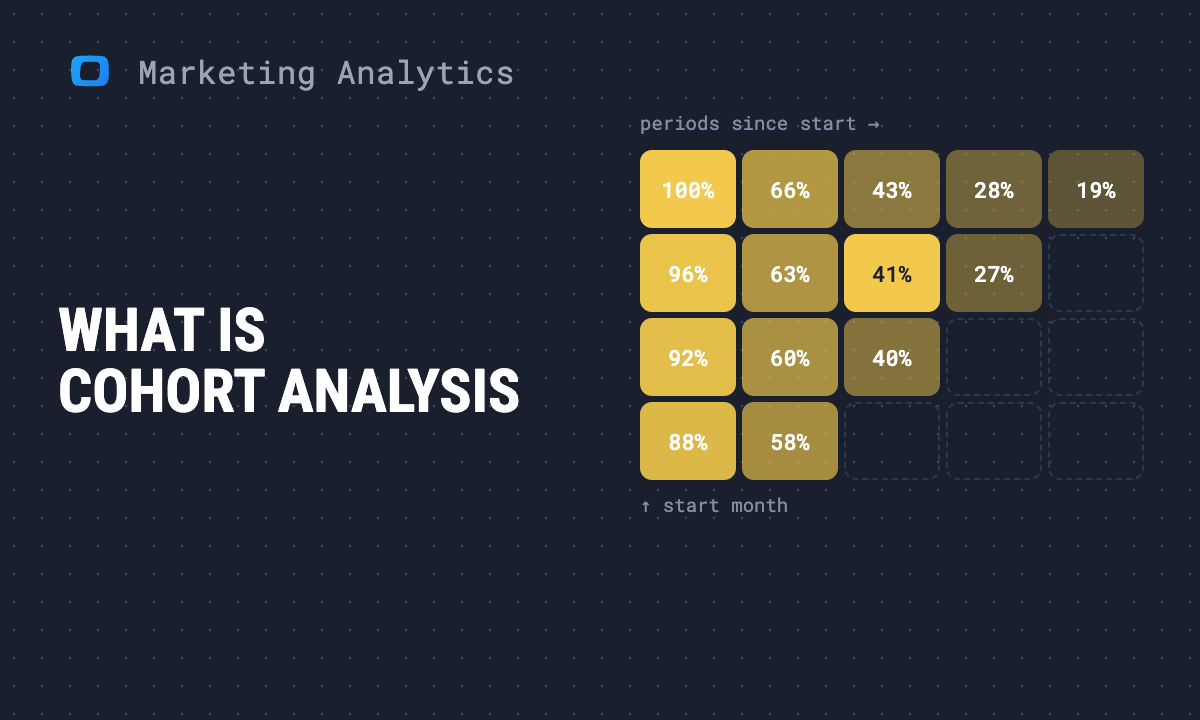 Article · Marketing AnalyticsWhat is cohort analysis: how to build and read a cohort report
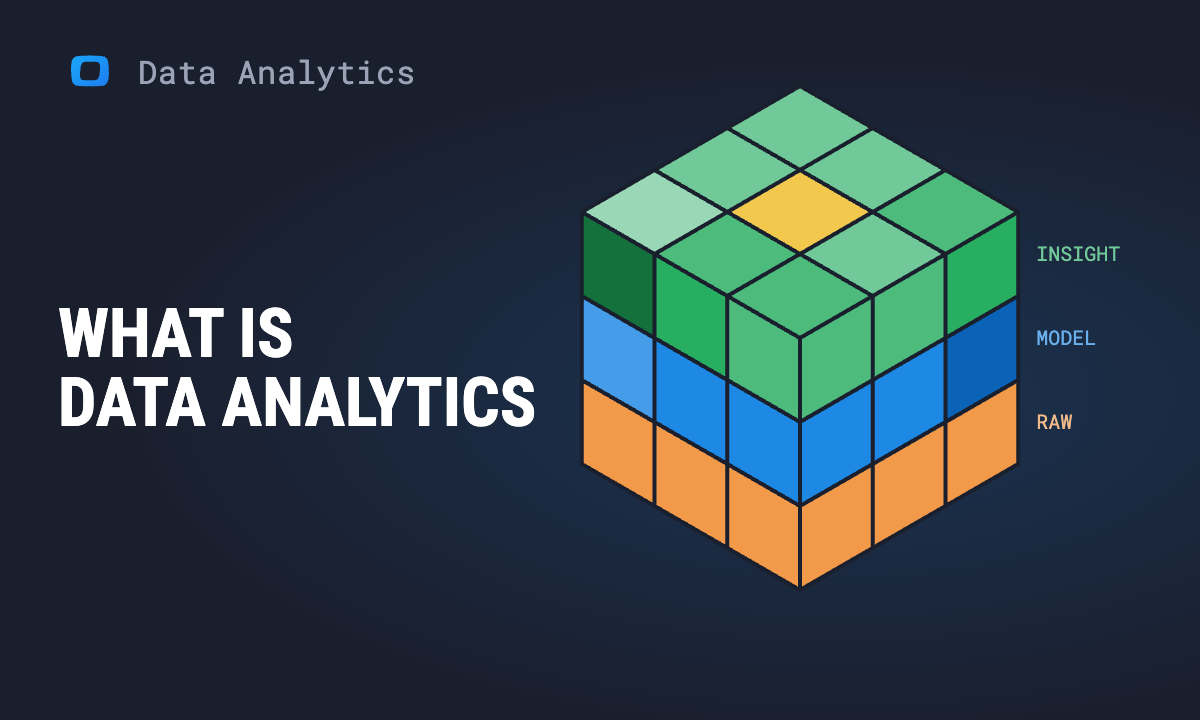 Article · Data AnalyticsWhat is data analytics? How data becomes an insight you can trust
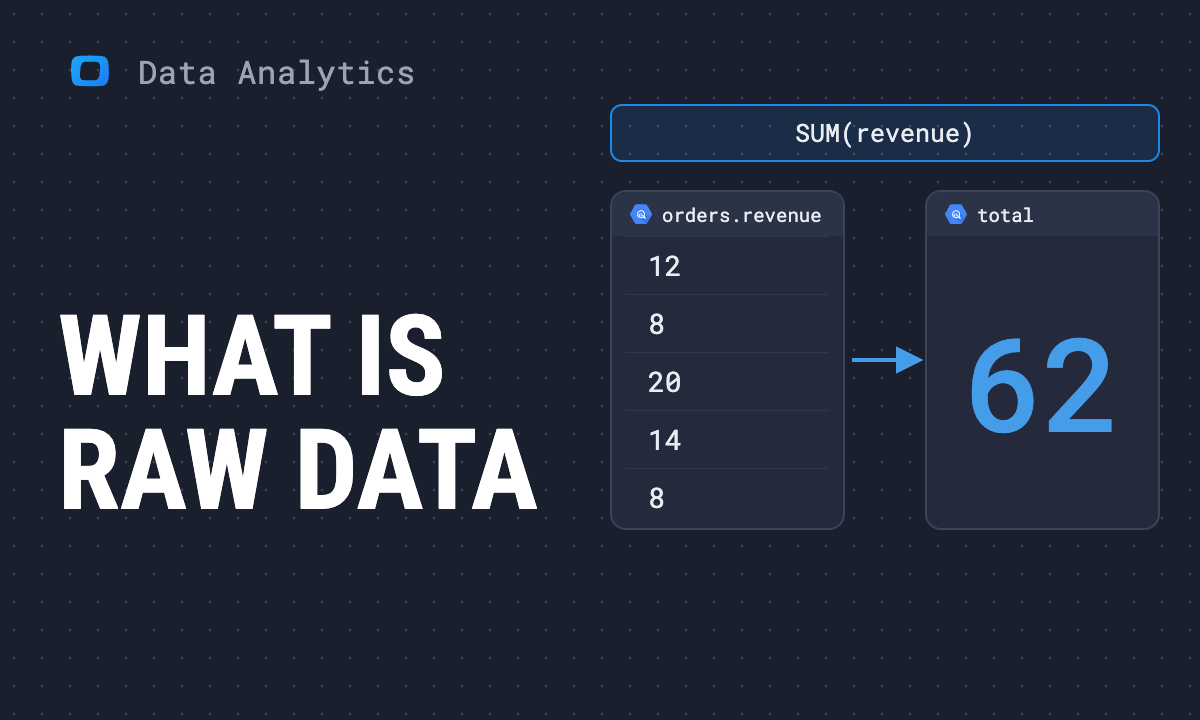 Article · Data AnalyticsWhat is raw data? Definition, examples and what aggregation loses
 Article · Data AnalyticsE-commerce data processing: who controls your data and your numbers
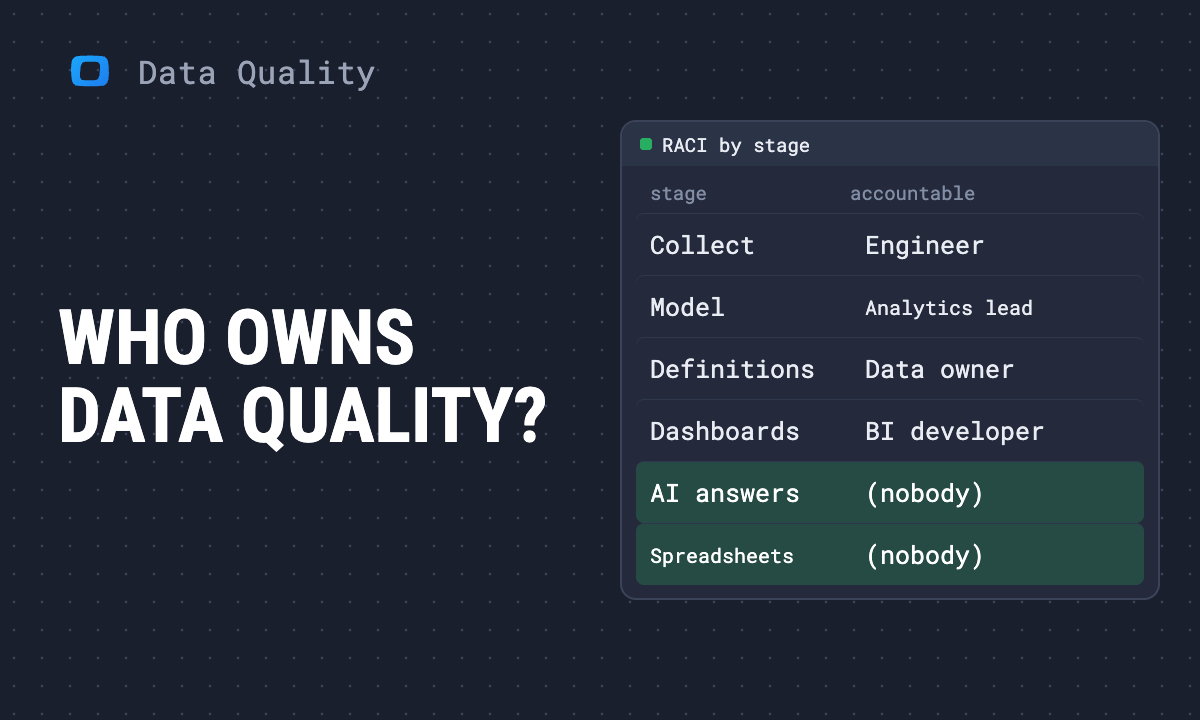 Article · Data QualityWho is responsible for data quality? A RACI for analytics teams
 Article · Google BigQuerySnowflake vs BigQuery: A detailed comparison
 Article · Data QualityData Quality Checks on Every Data Mart: Prove the Number Before Anyone Asks
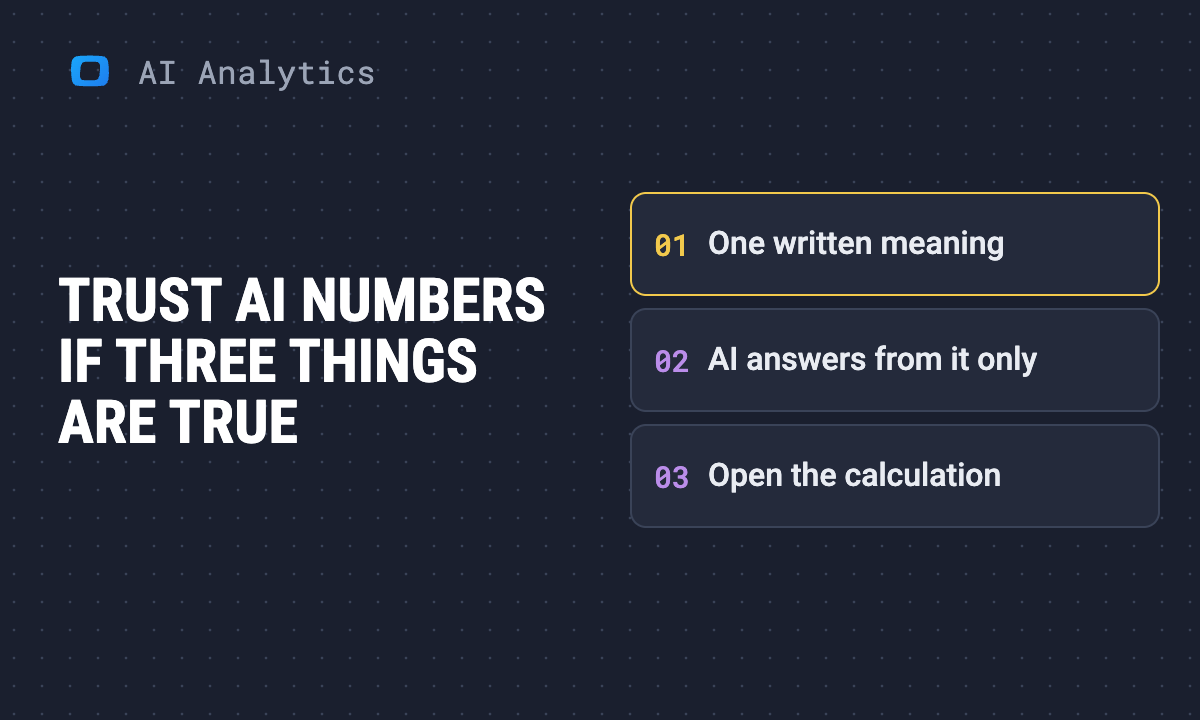 Article · AI in AnalyticsCan You Trust AI with Your Business Numbers?
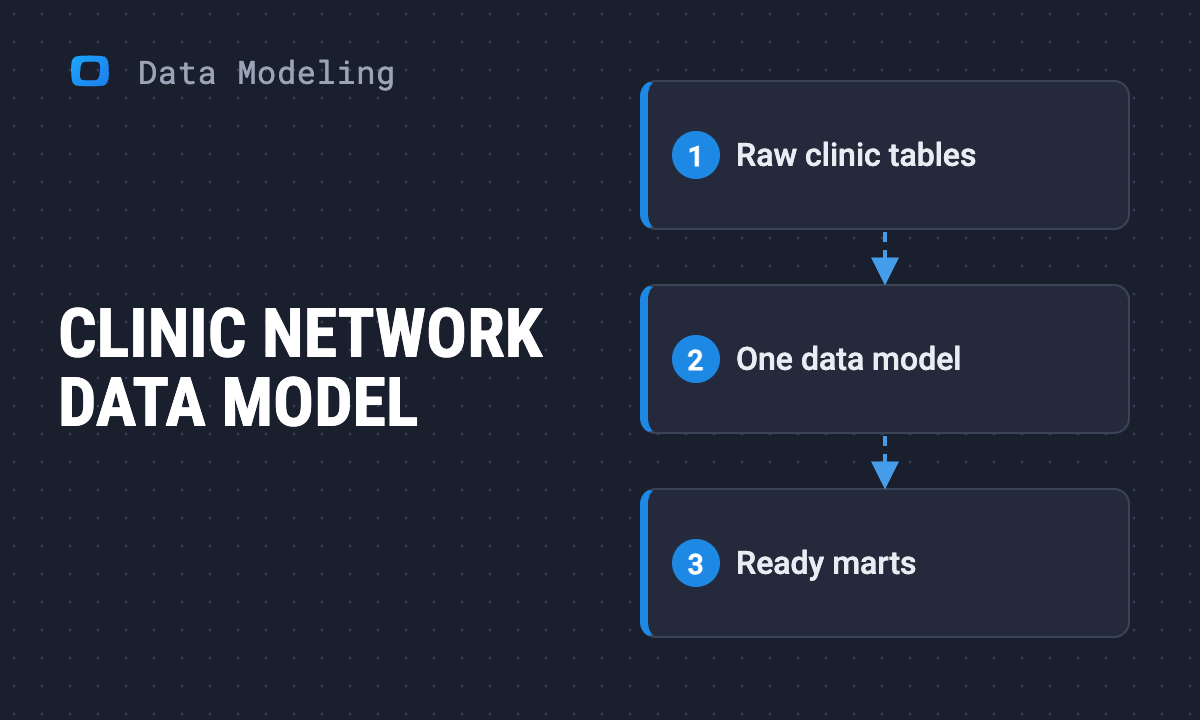 Article · Data ModelingClinic Network Data Model: Tables, Keys and One Definition per Metric
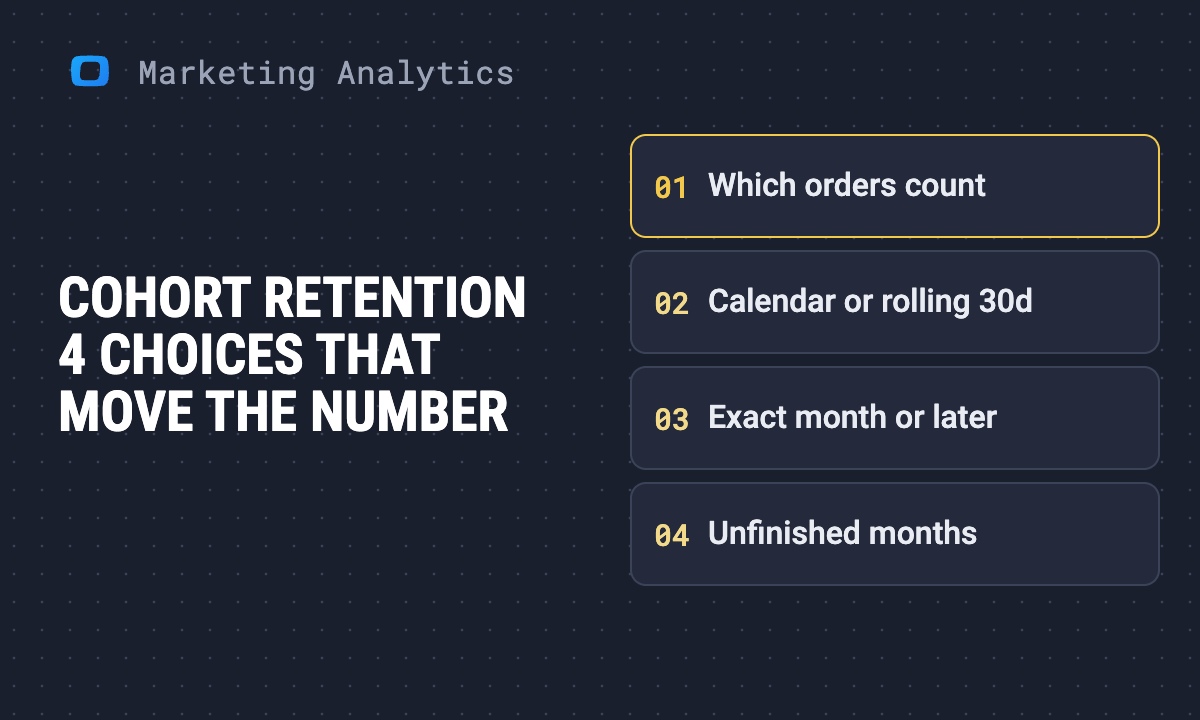 Article · Marketing AnalyticsCohort Retention Analysis in SQL: Four Choices That Change the Number
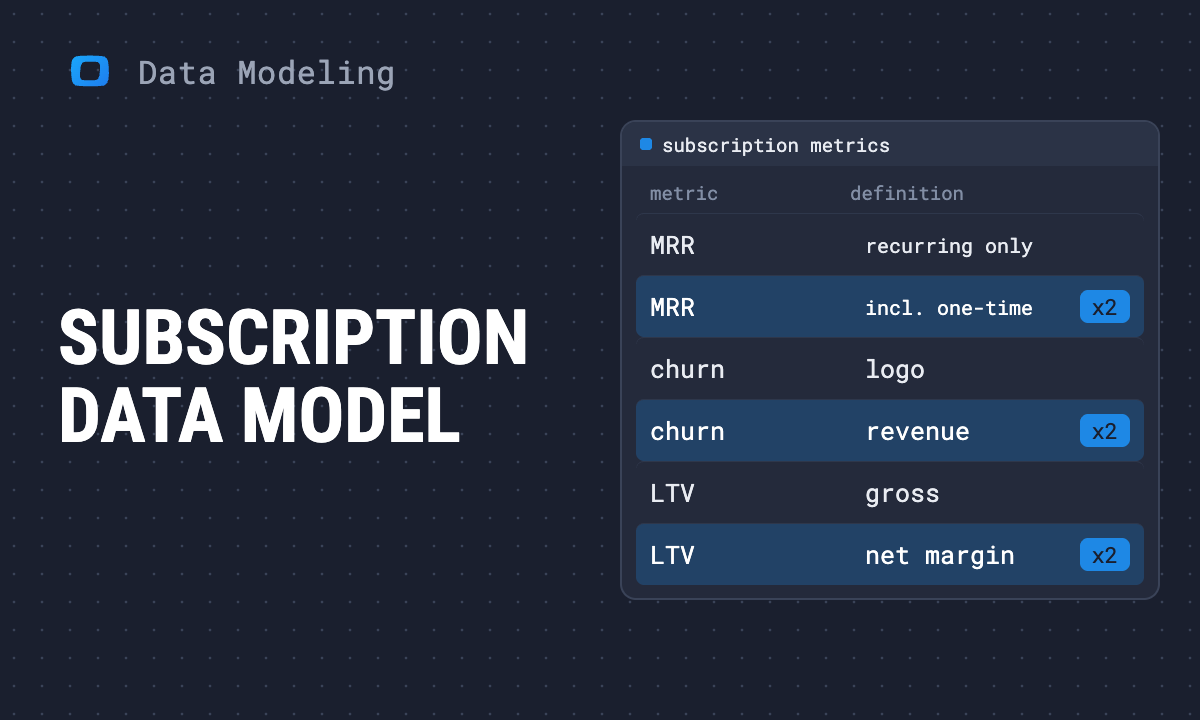 Article · Data ModelingSubscription E-Commerce Data Model: Tables, Keys and One Definition per Metric
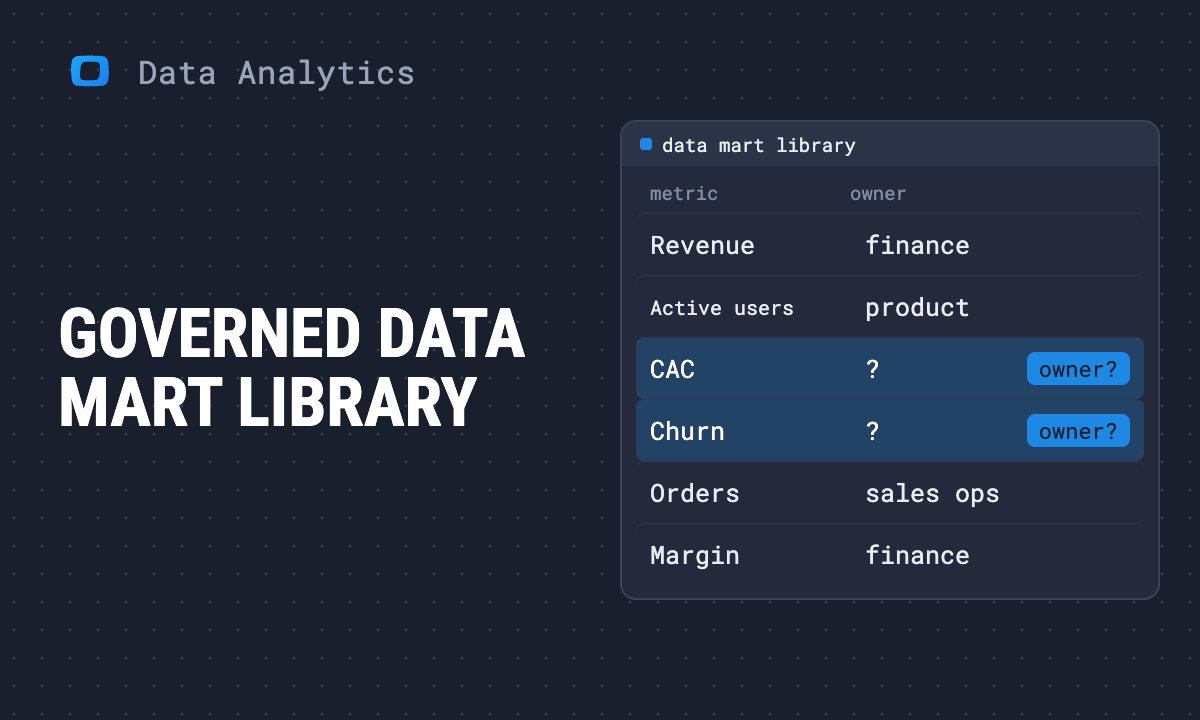 Article · Data AnalyticsHow to Build a Governed Data Mart Library: Start with the Numbers People Argue About
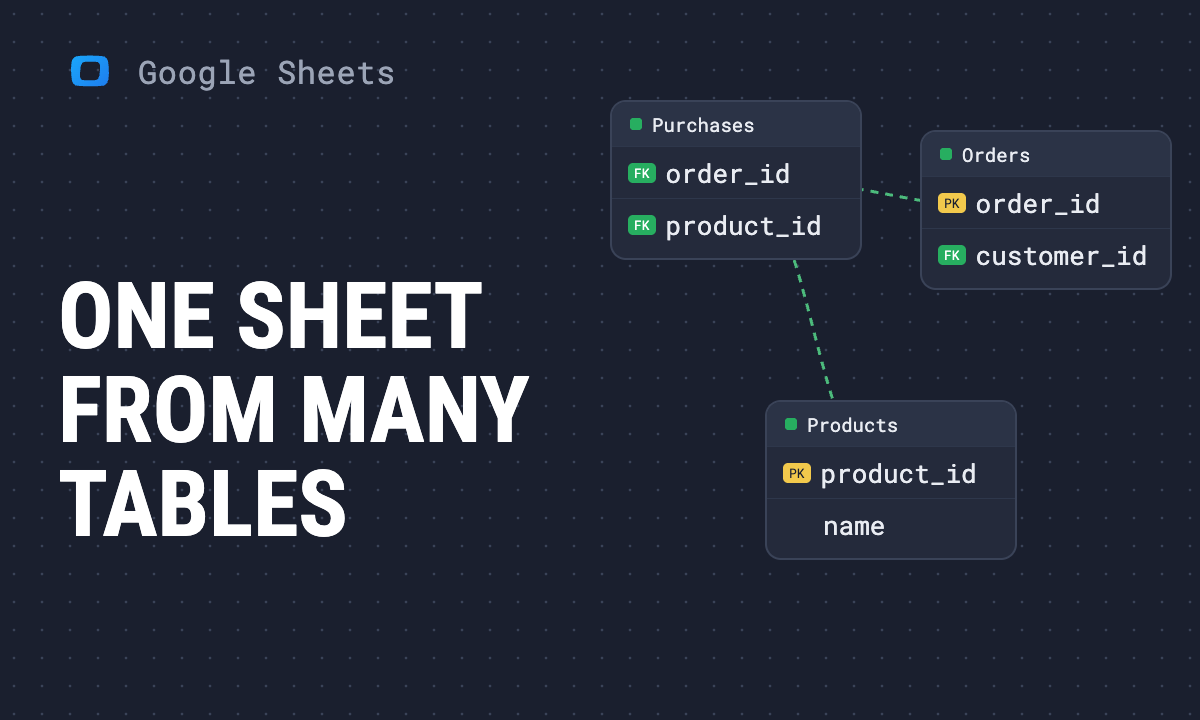 Article · Google Sheets TipsJoined Data Marts in Google Sheets: One Report from Several Tables, No VLOOKUP Chains
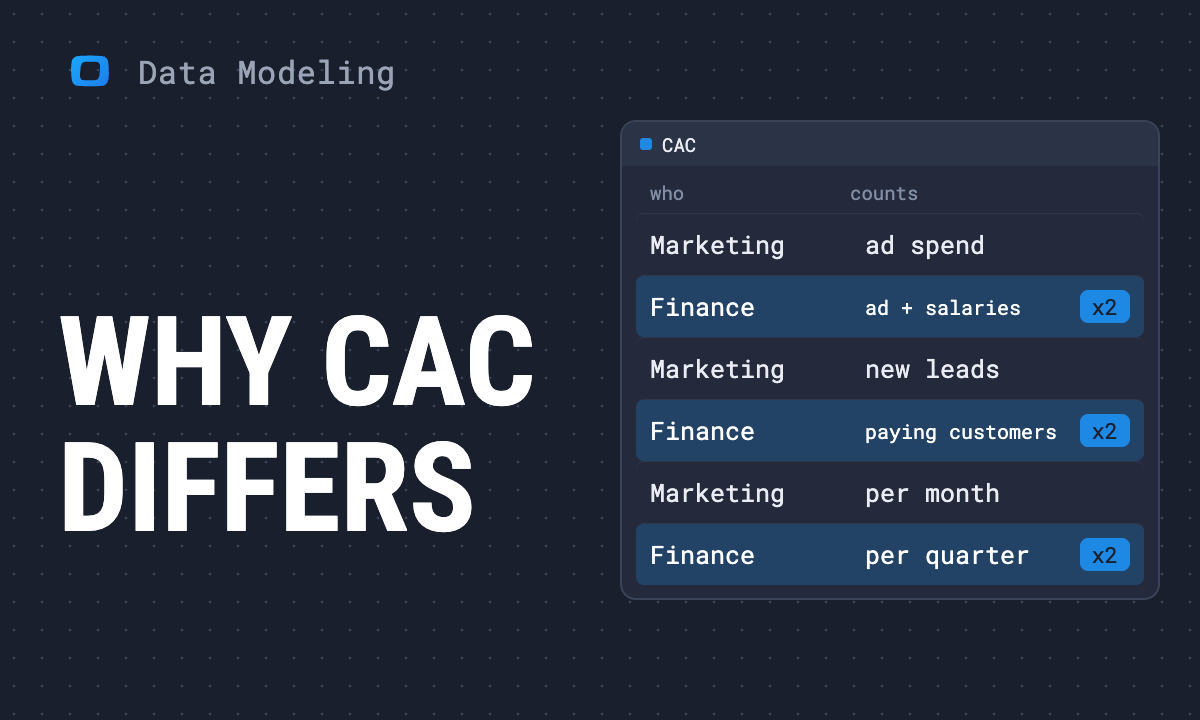 Article · Data ModelingMarketing Analytics Data Model: What to Ask Your Analyst for
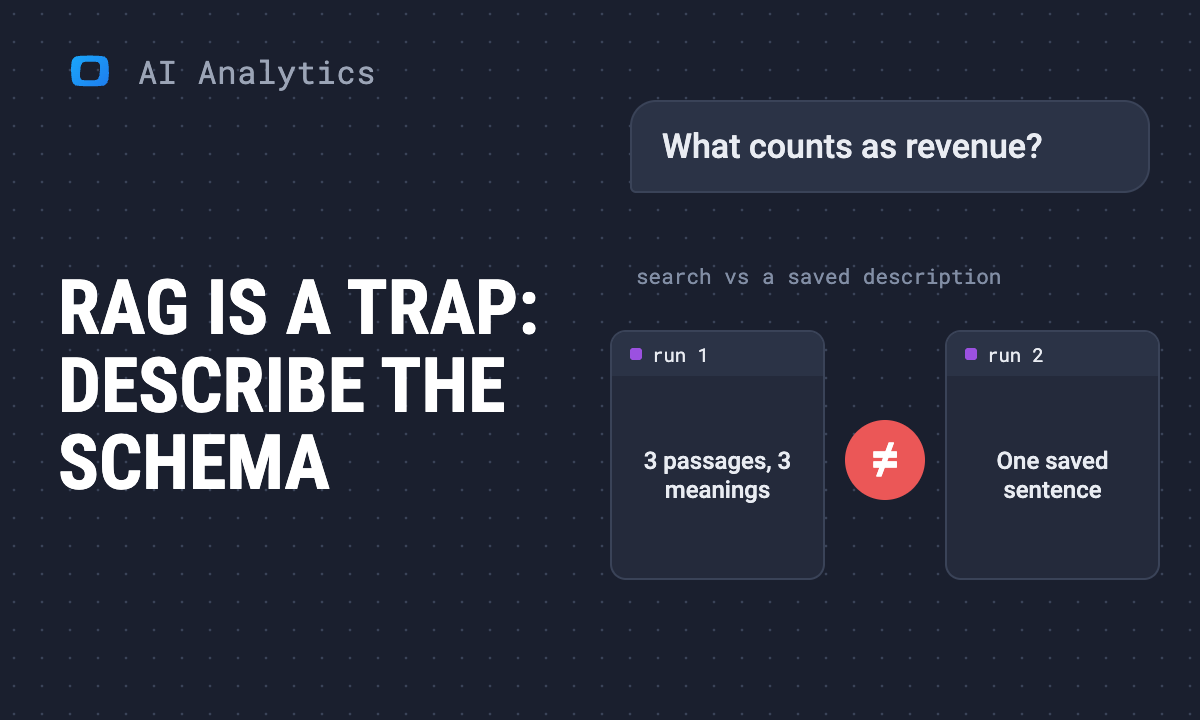 Article · AI in AnalyticsRAG Over Your Warehouse Metadata is a Trap: Describe the Schema Instead
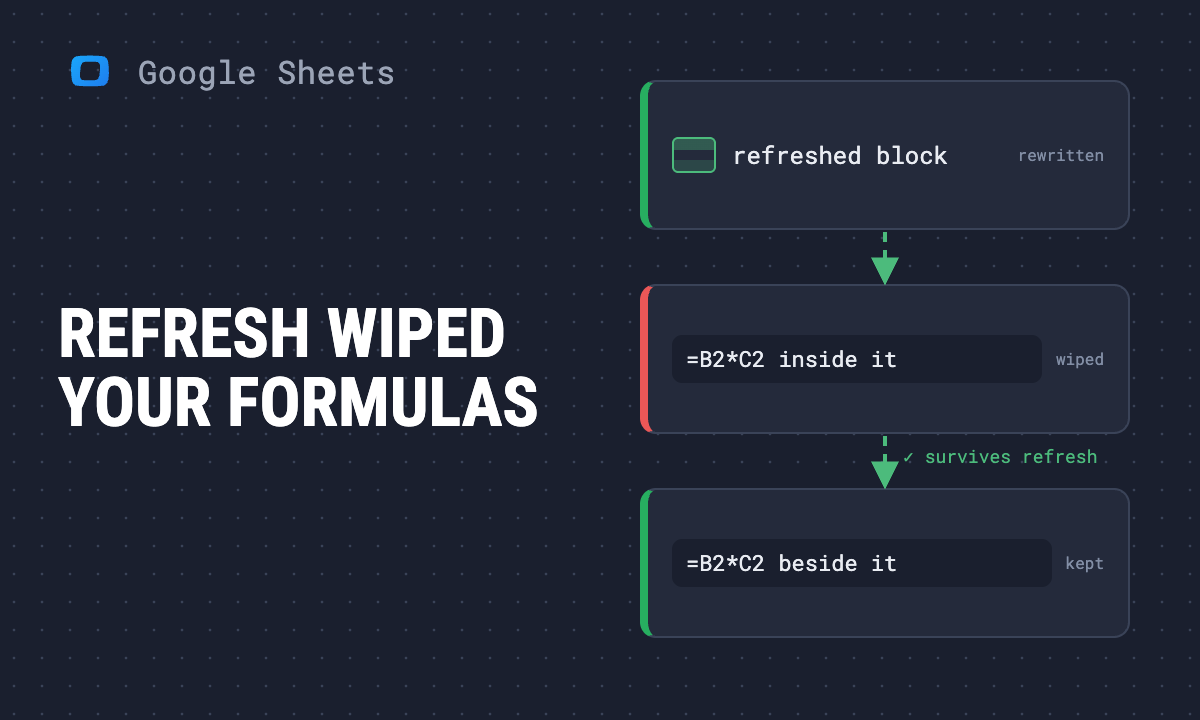 Article · Google Sheets TipsWhy Your Scheduled Refresh Keeps Wiping Google Sheets Formulas (and How to Fix It)
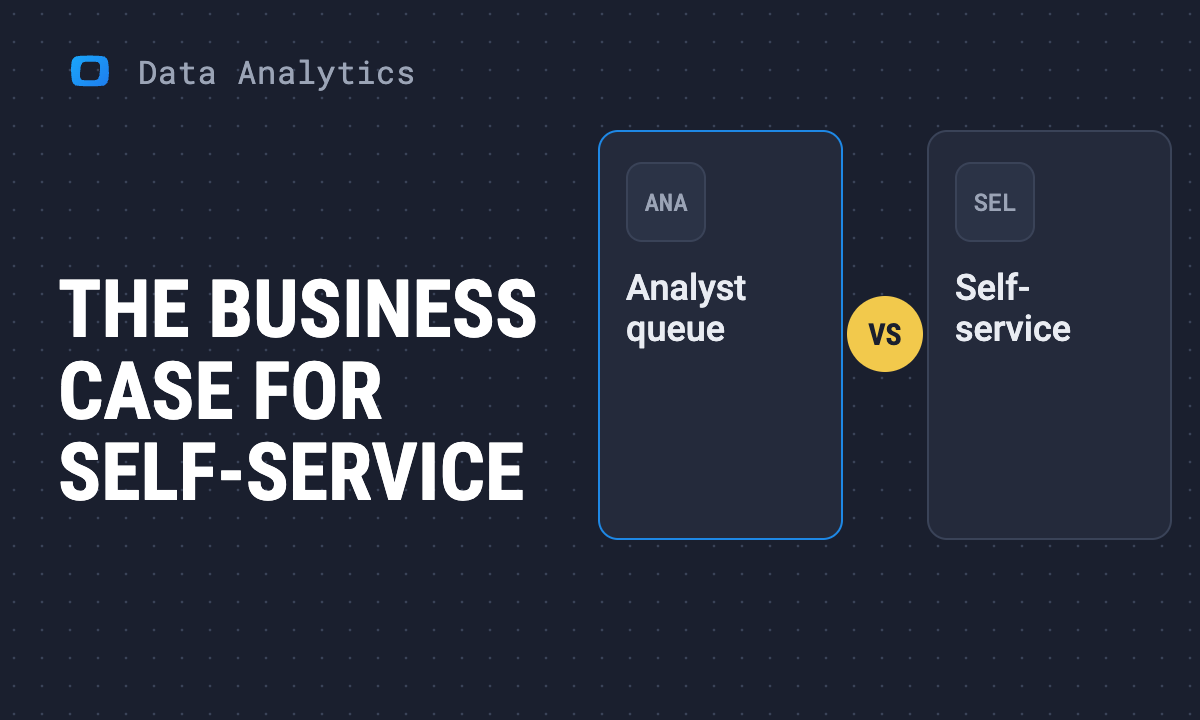 Article · Data AnalyticsThe Forwardable Business Case for Governed Self-Service Analytics
 Article · AI in AnalyticsText-to-SQL Accuracy: What a Benchmark Score Tells You About Your Own Warehouse
 GlossaryData Model
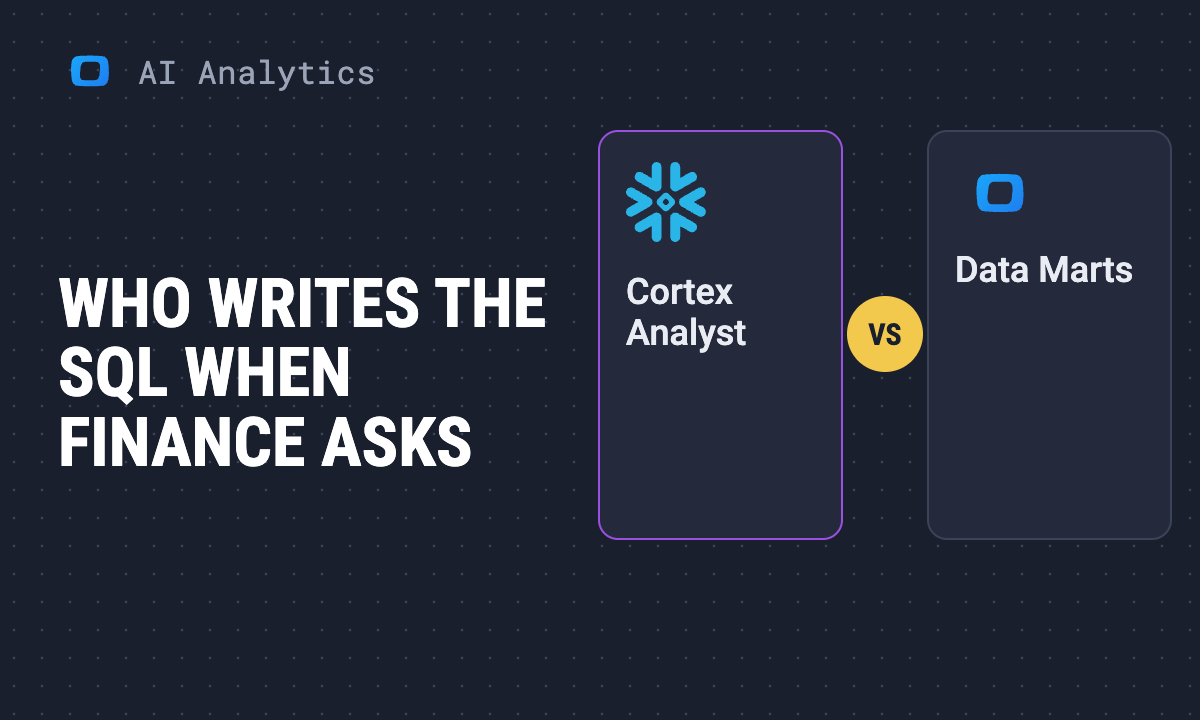 Article · AI in AnalyticsGoverned AI Analytics on Snowflake: Who Writes the SQL When Finance Asks
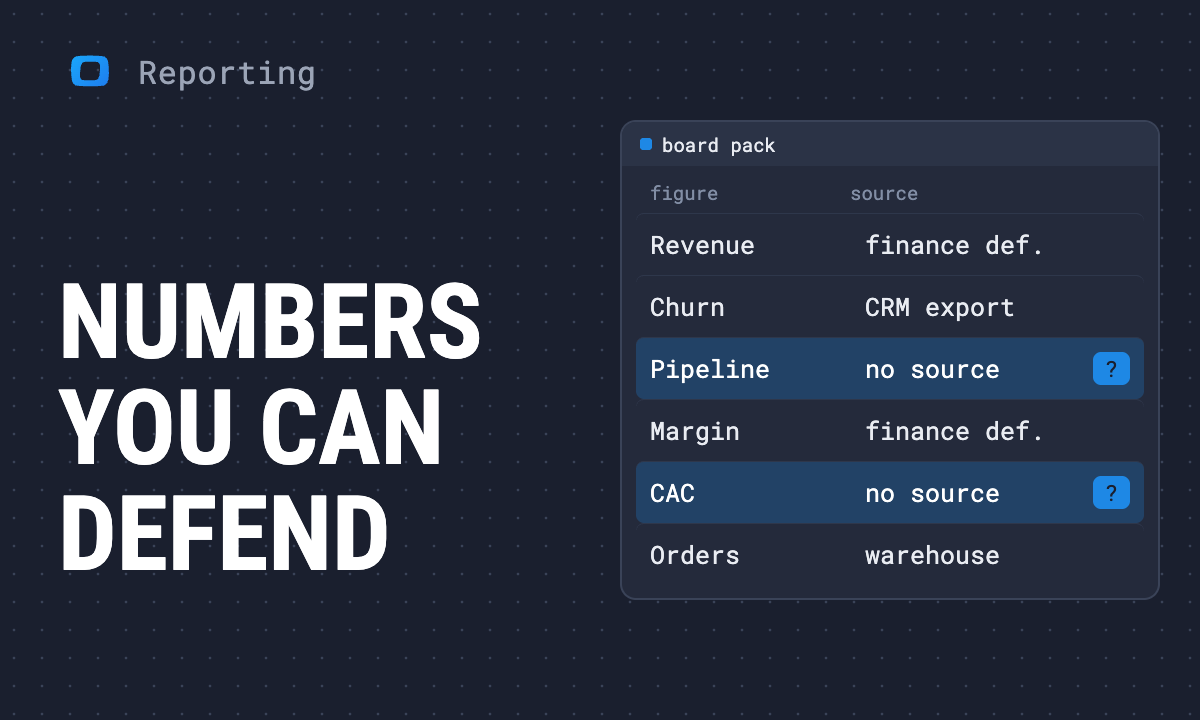 Article · ReportingBoard Pack Numbers You Can Defend: What the Audit Covers and What It Doesn't
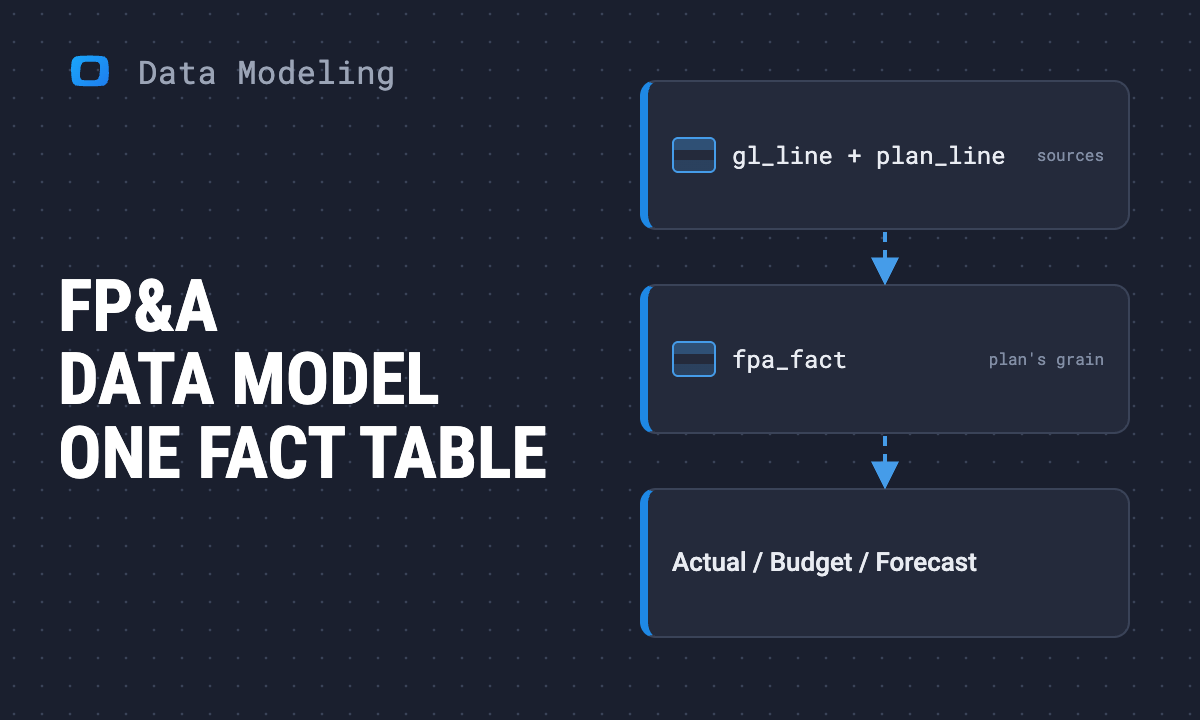 Article · Data ModelingThe FP&A Data Model: The Tables and Keys Behind Actuals, Budget and Forecast
 Article · Data ModelingDo You Need a Semantic Layer? Data Model vs Data Mart vs the Layer
 Article · ReportingWhy Sales, Marketing and Finance Report Different Pipeline Numbers
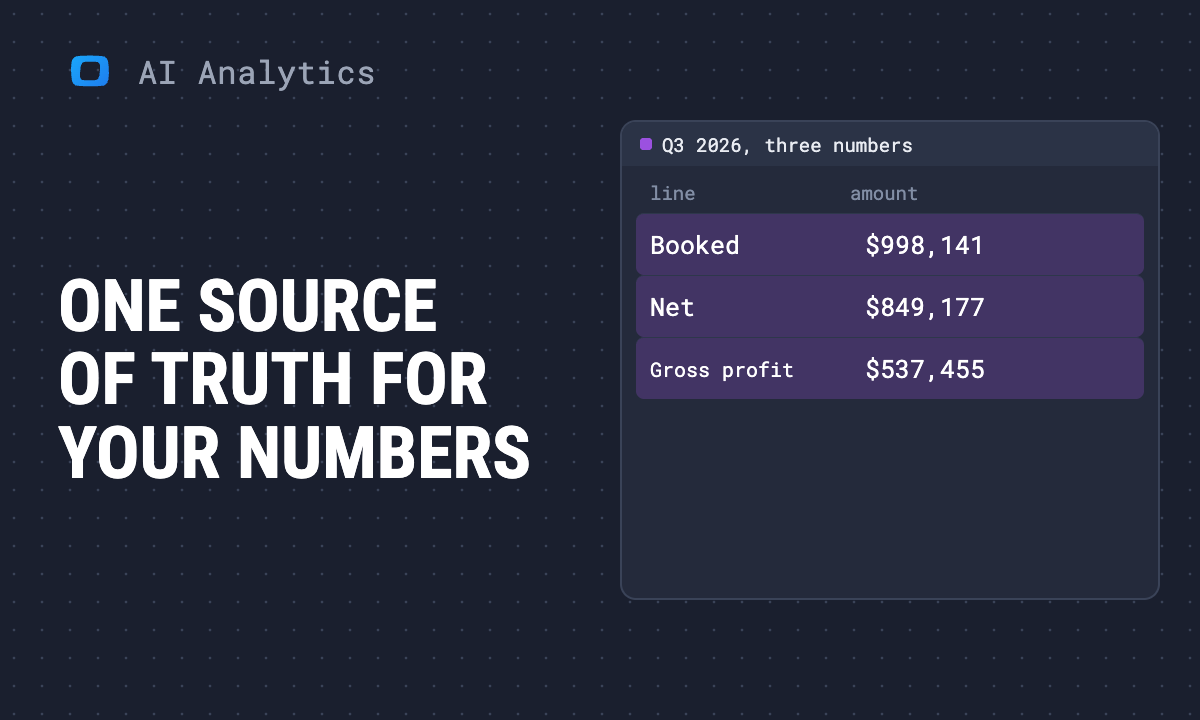 Article · AI in AnalyticsEveryone in the meeting has a different number: how to get one source of truth
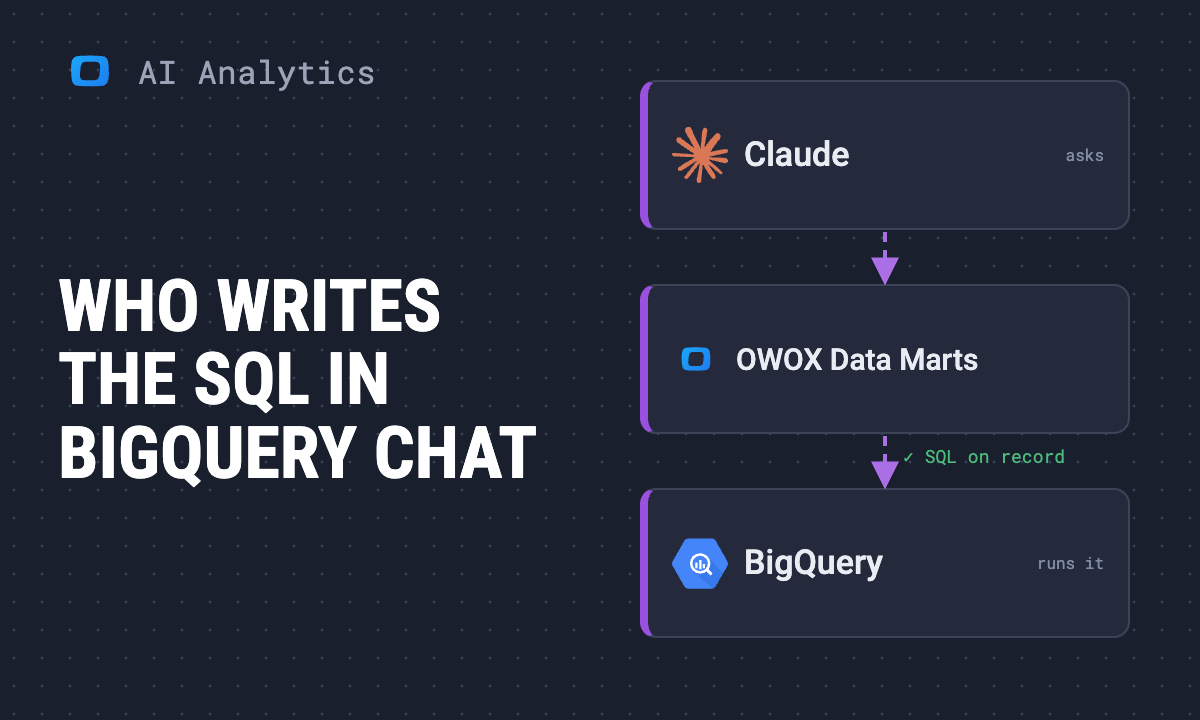 Article · AI in AnalyticsGoverned AI Analytics on BigQuery: Who Writes the SQL When Your Team Asks in Chat
 Article · AI in AnalyticsAI Data Analyst Tools You Can Trust: An Honest Comparison
 ArticlePhoto sizes for Facebook: A guide to all Facebook image sizes in 2026
 Article · AI in AnalyticsSemantic Layer for AI Agents: Do You Need One, or Do You Already Have It?
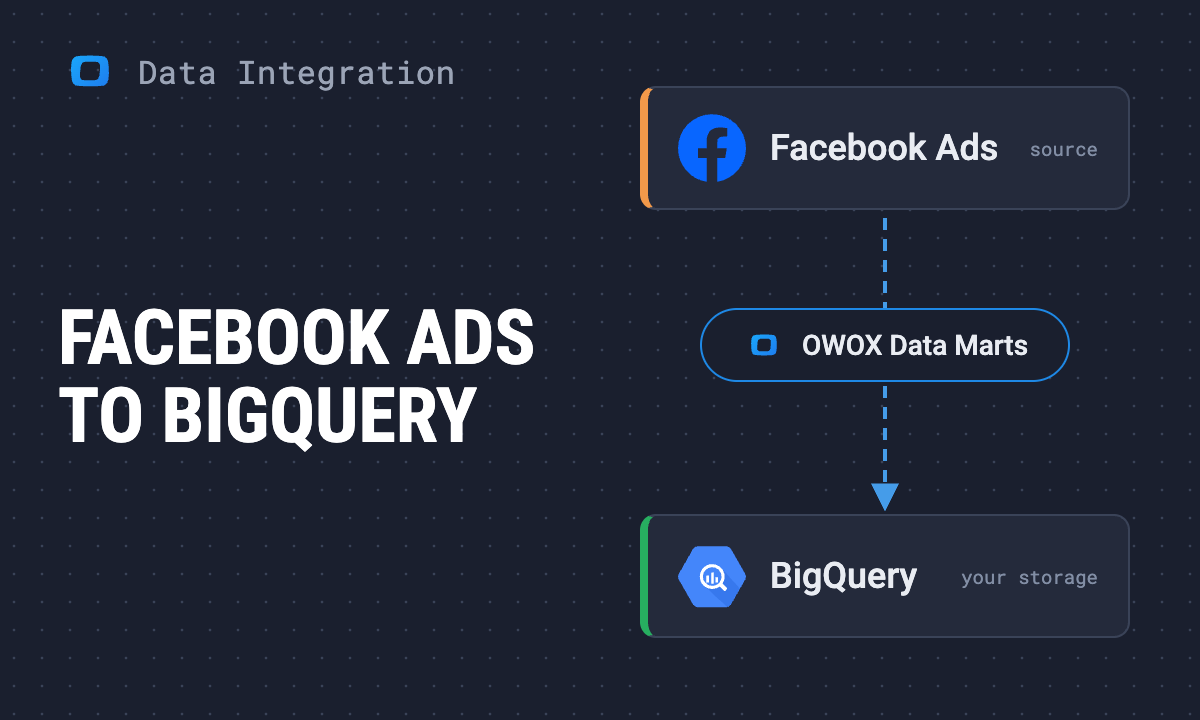 Article · Data IntegrationHow to connect Facebook Ads to BigQuery with OWOX Data Marts
 Article · GA4GDPR compliance with Google Analytics 4 Consent Mode
 Article · Data TrackingGoogle Analytics and GDPR: how to stay compliant in Europe
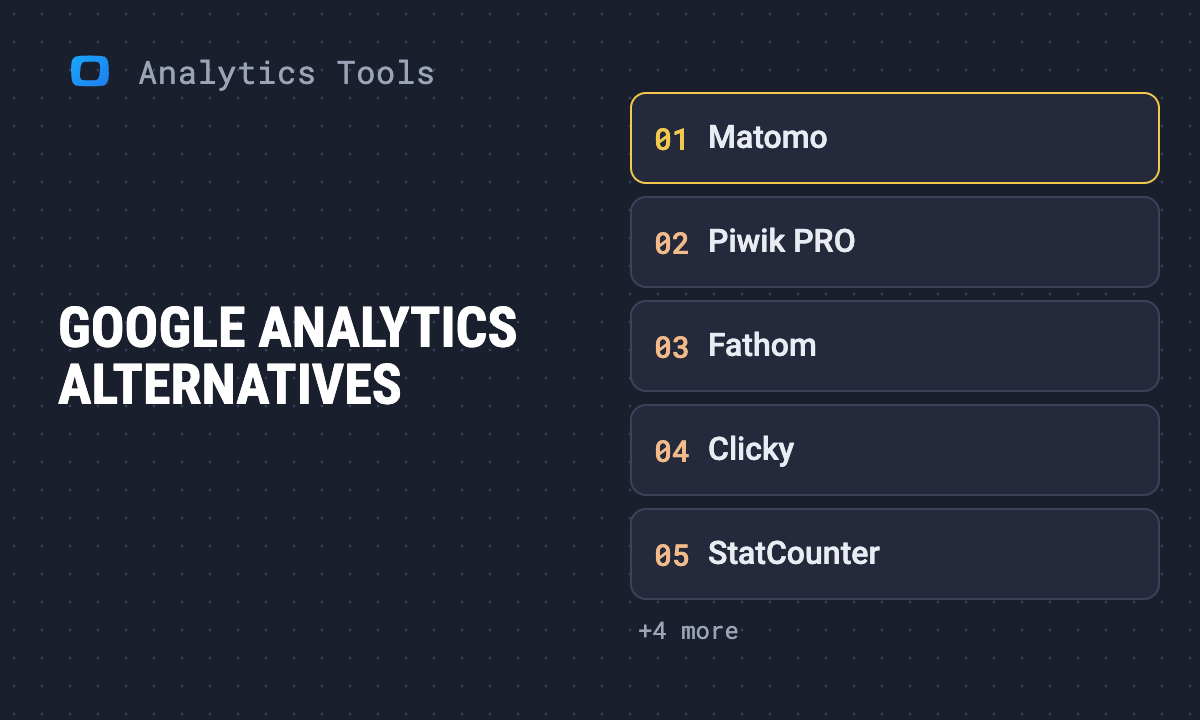 Article · GA4Google Analytics alternatives: the main options compared
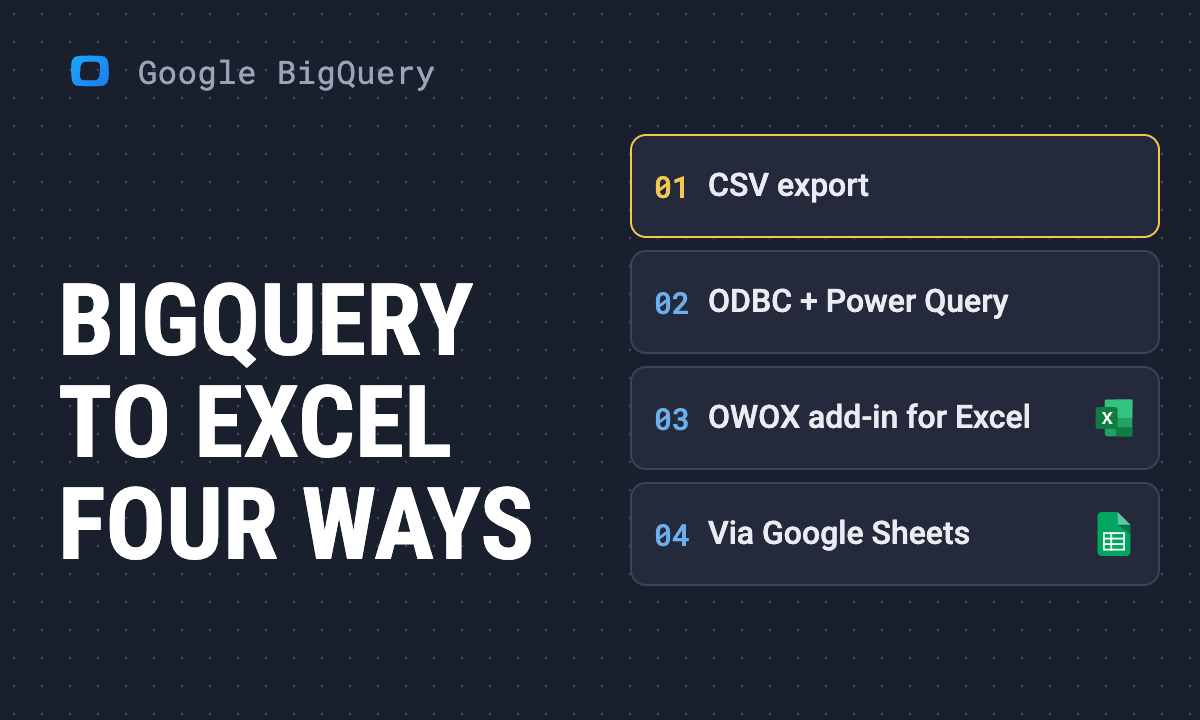 Use case · Google BigQueryHow to connect BigQuery to Excel: four ways that work
 Use case · Google BigQueryBigQuery query examples: six sample queries you can run on GA4 data
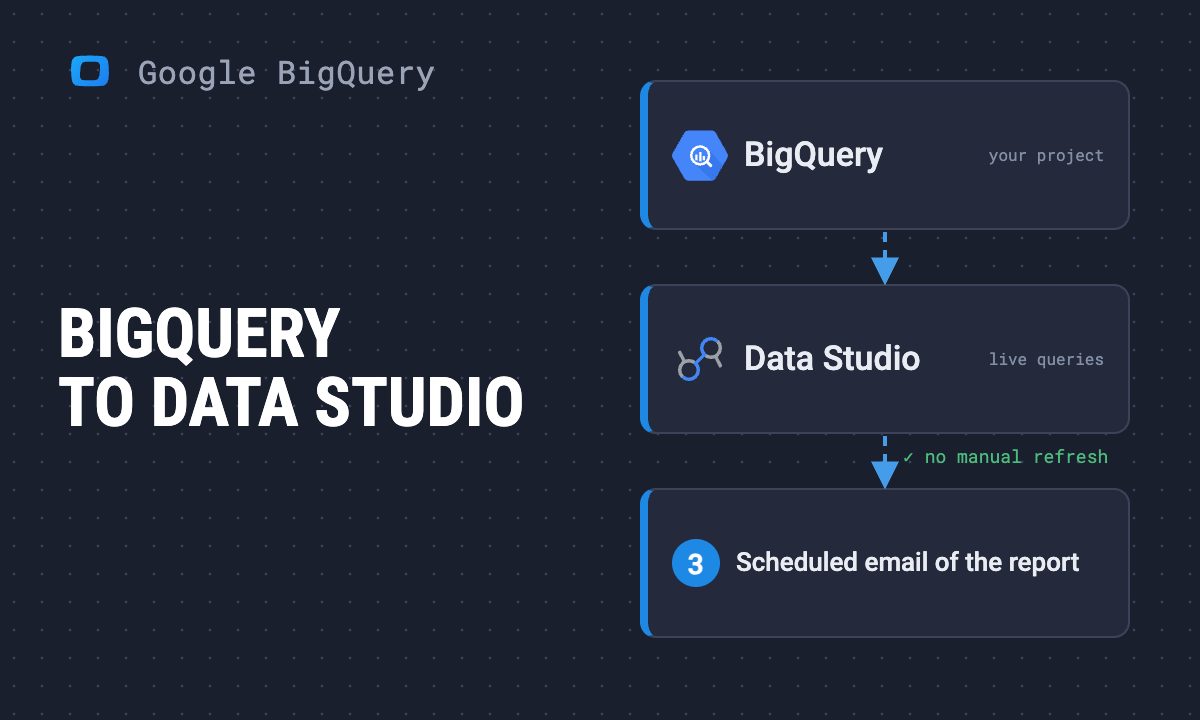 Use case · Google BigQueryHow to connect BigQuery to Looker Studio and automate your reports
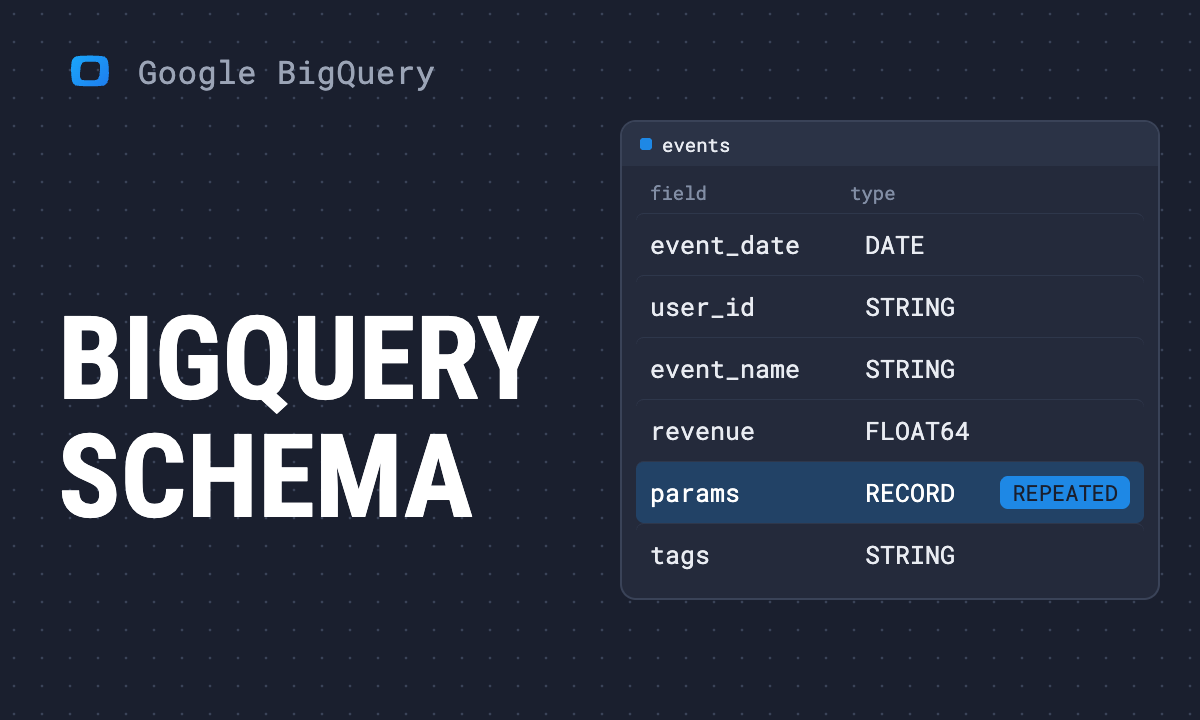 Use case · Google BigQueryBigQuery schema: how to specify, view and change a table schema
 Use case · Google BigQueryHow to connect Google Sheets to BigQuery: three ways
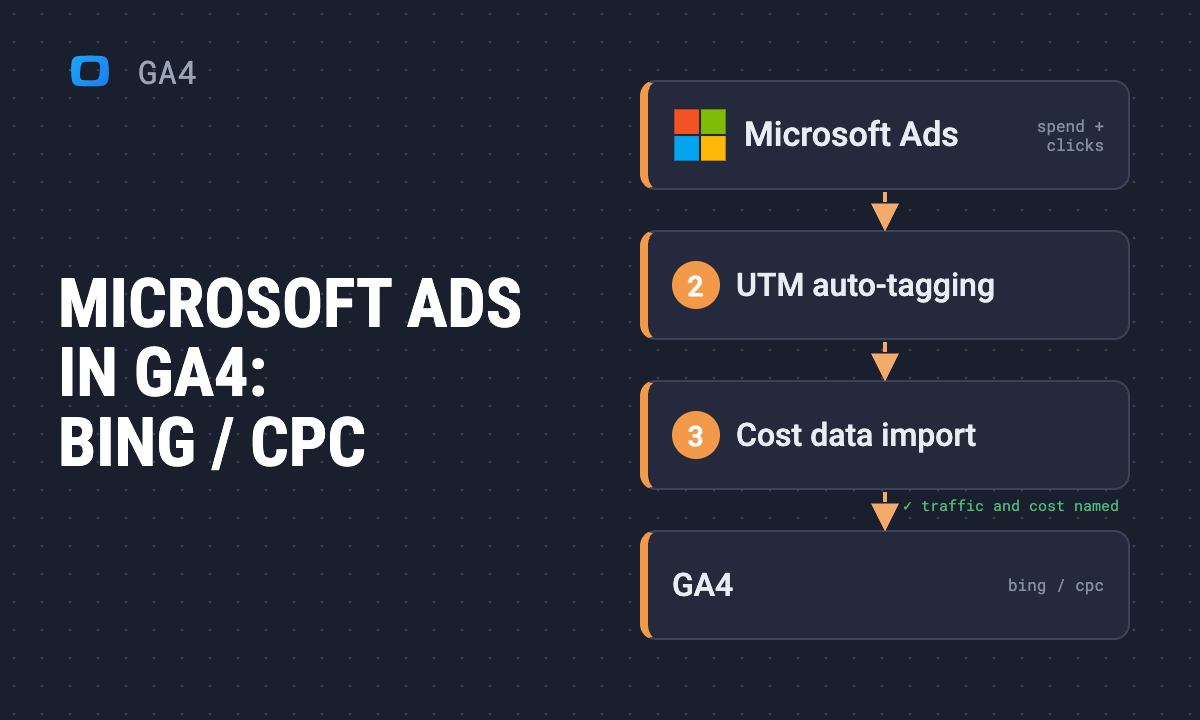 Use case · GA4Microsoft Ads (Bing Ads) in Google Analytics 4: tracking and cost data
 Article · Data ModelingBusiness reporting: the OWOX approach to Data Marts
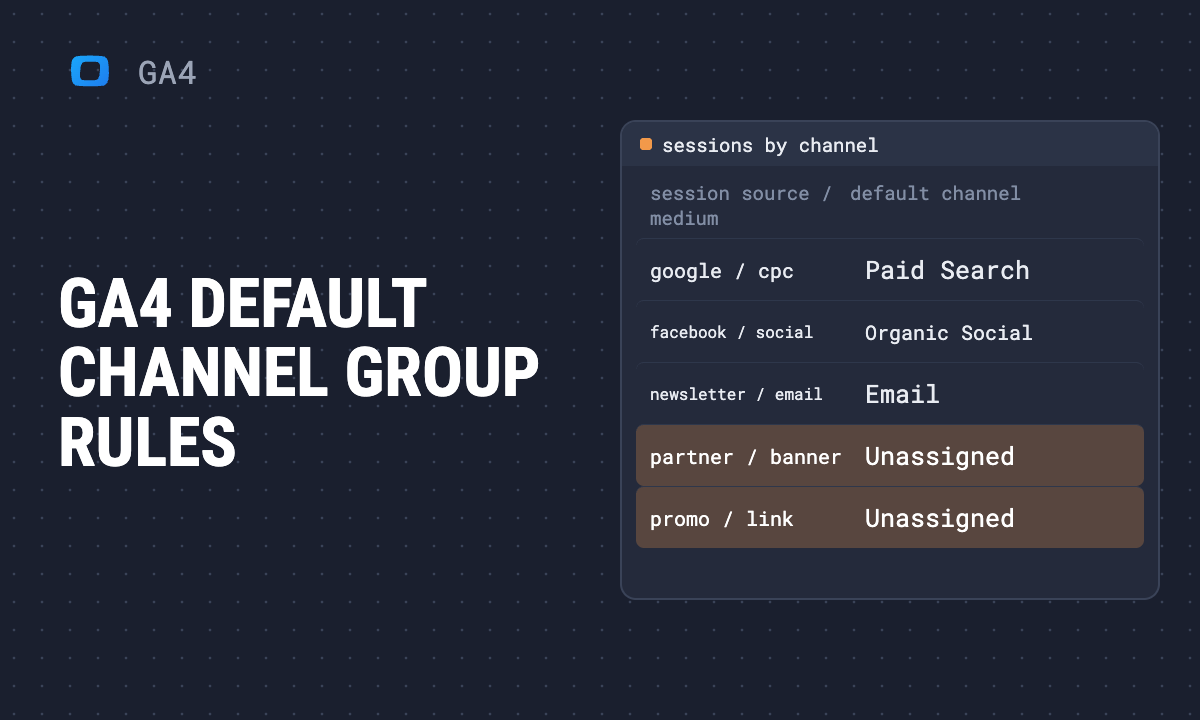 Article · GA4GA4 default channel group: the rules, and how to build your own
 Article · Data ModelingConceptual data modeling explained: definition and four examples
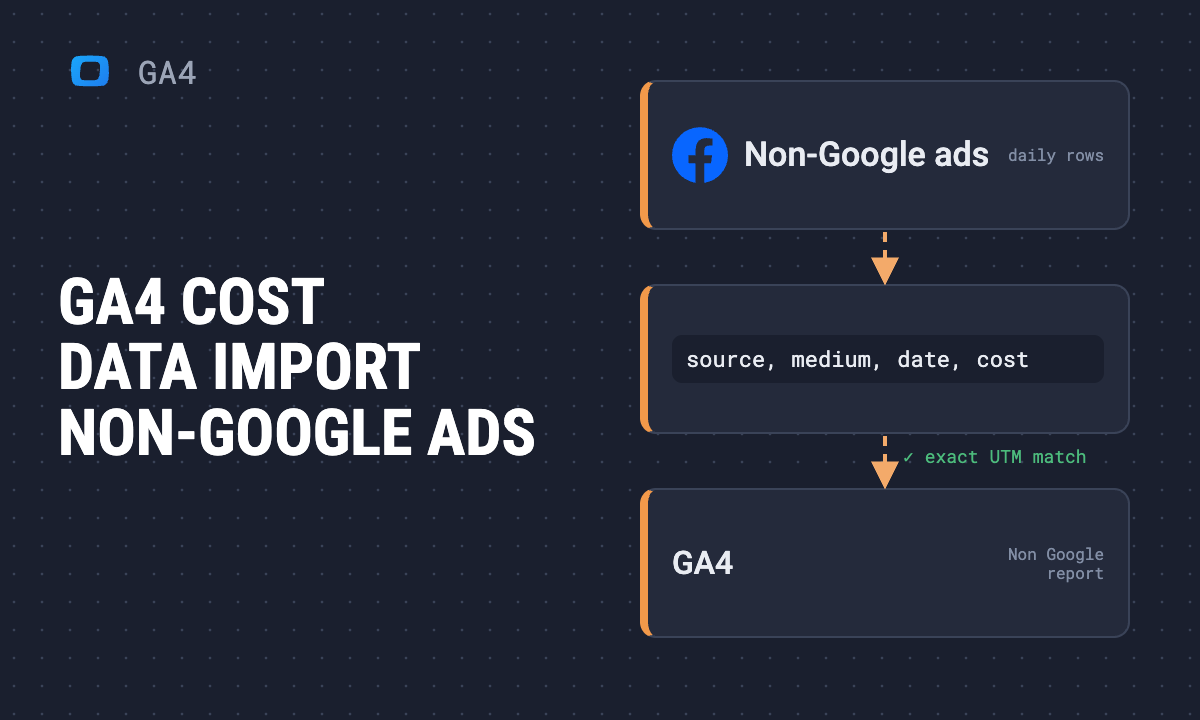 Use case · GA4GA4 cost data import: how to bring non-Google ad costs into Google Analytics 4
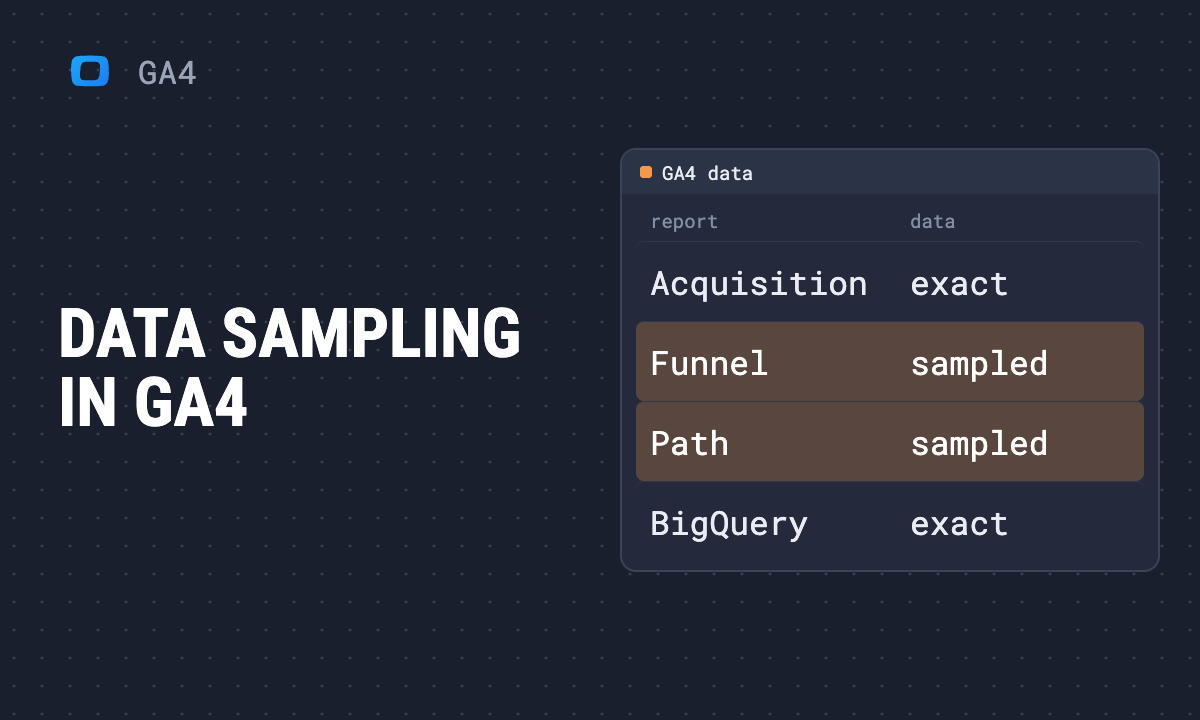 Article · GA4Data sampling in Google Analytics 4: limits and how to avoid it
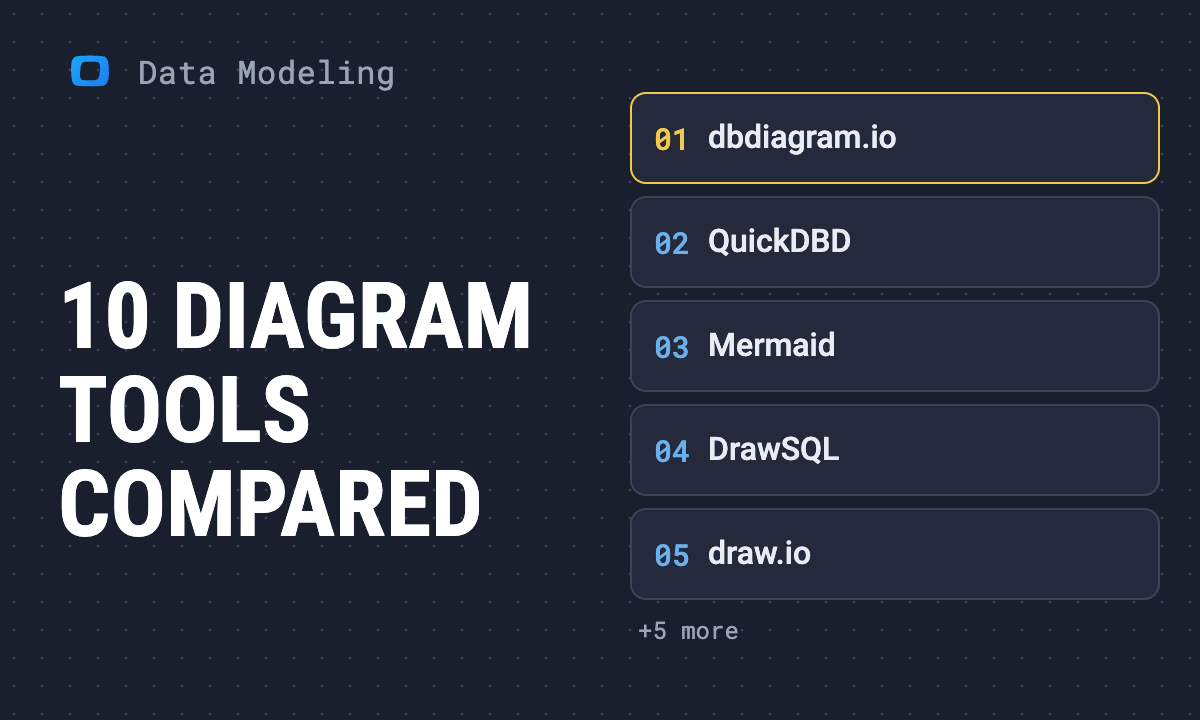 Article · Data ModelingTop 10 free database diagram design tools
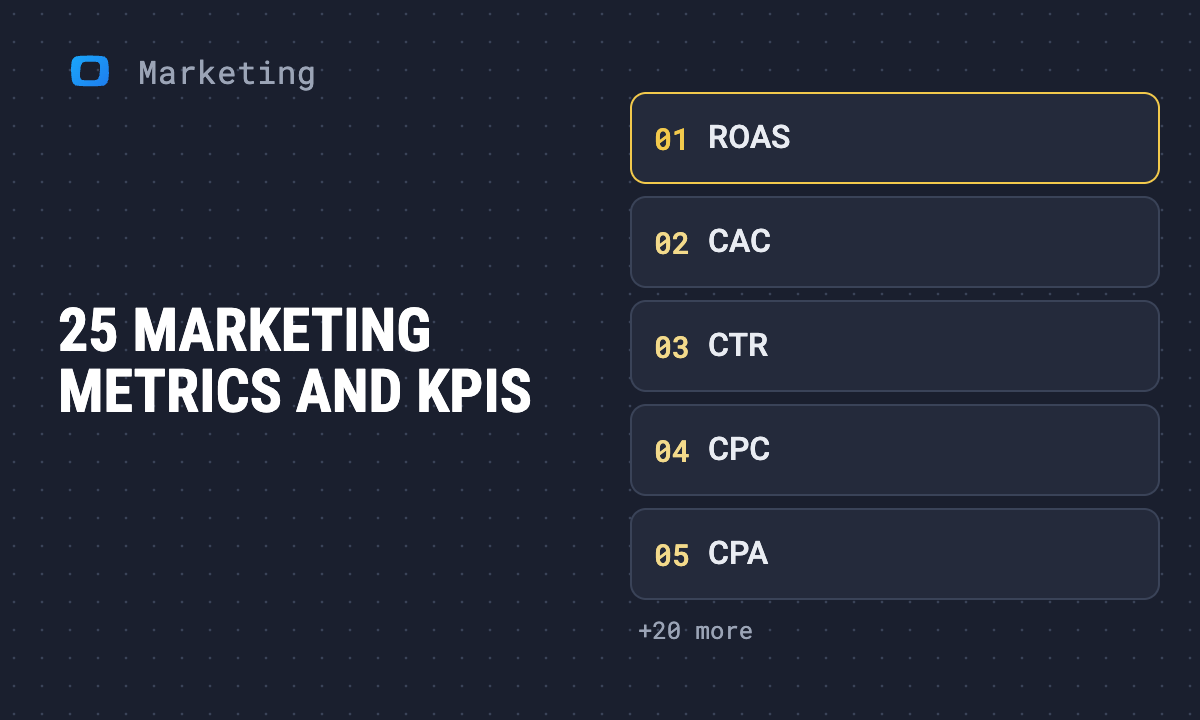 Article · Marketing Strategy25 marketing metrics and KPIs to track, with formulas
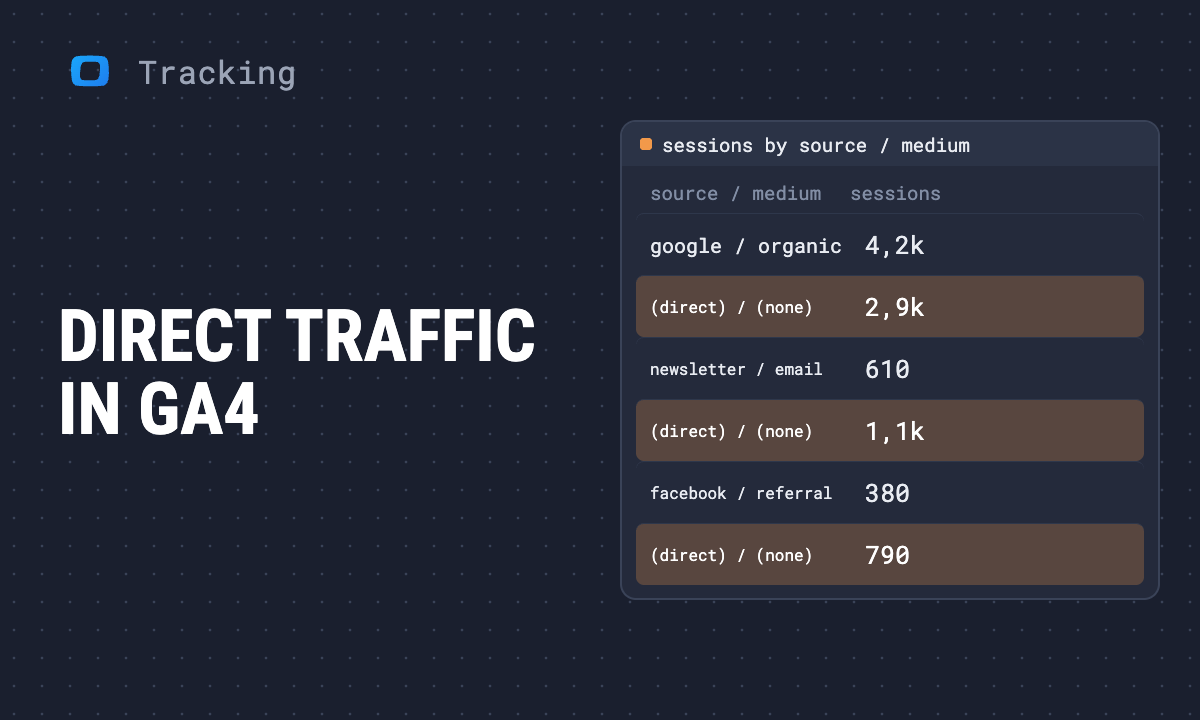 Article · Data TrackingWhat is direct traffic in Google Analytics 4, and how to reduce it
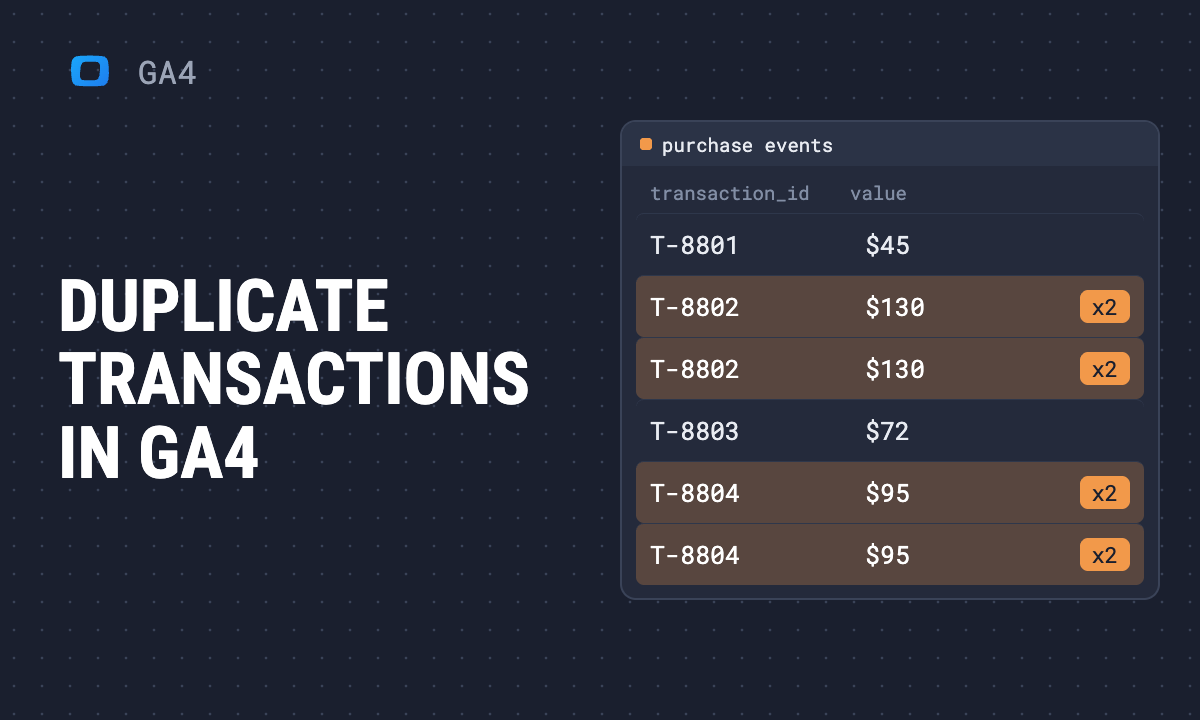 Article · GA4Duplicate transactions in GA4: how to find and remove them
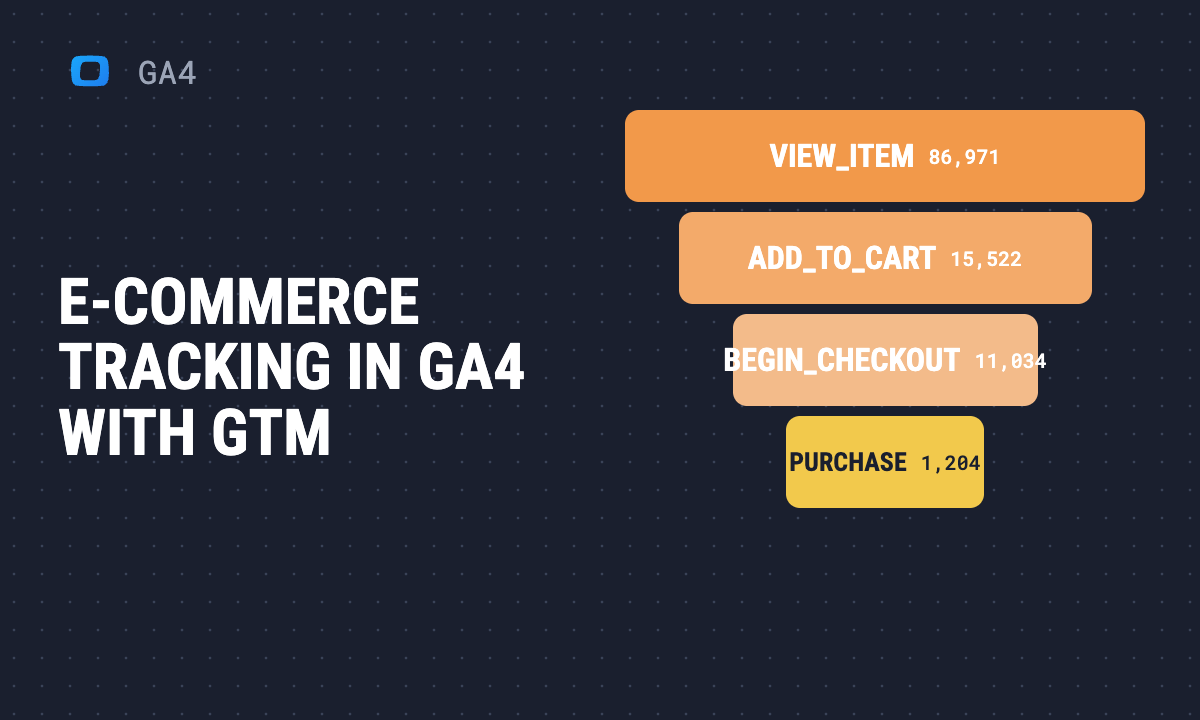 Article · GA4E-commerce tracking in Google Analytics 4 with Google Tag Manager
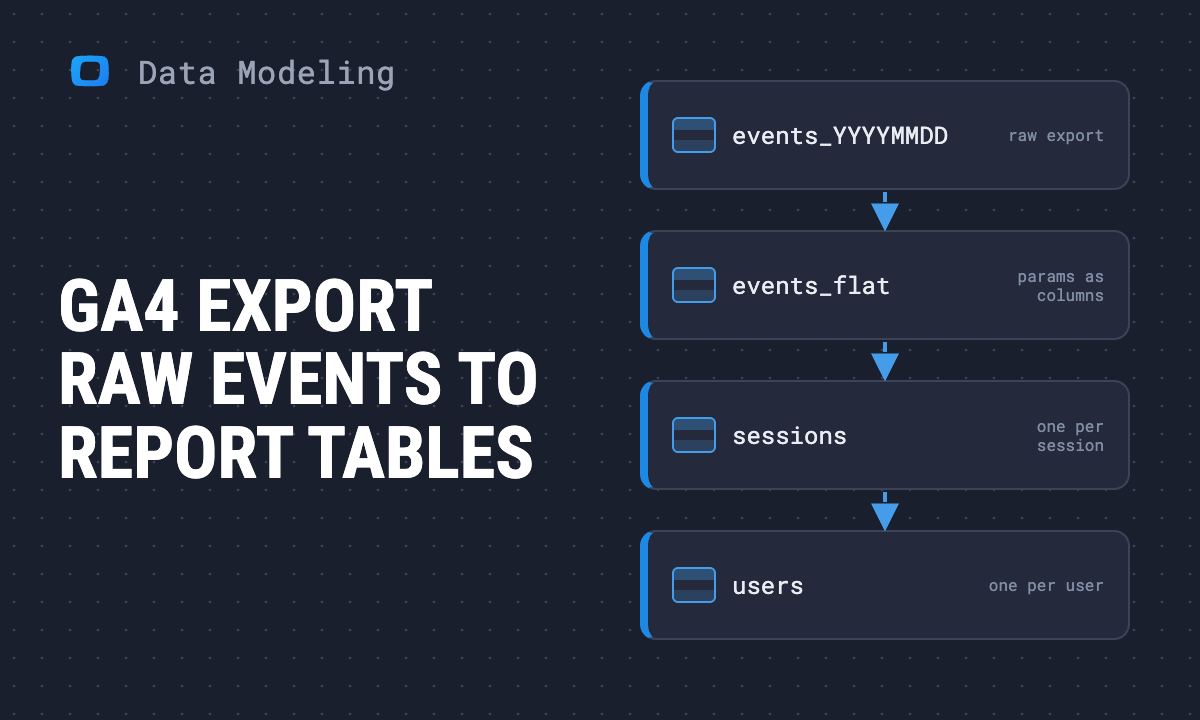 Article · Data ModelingWhy your GA4 export to BigQuery needs a data model, and how to build it
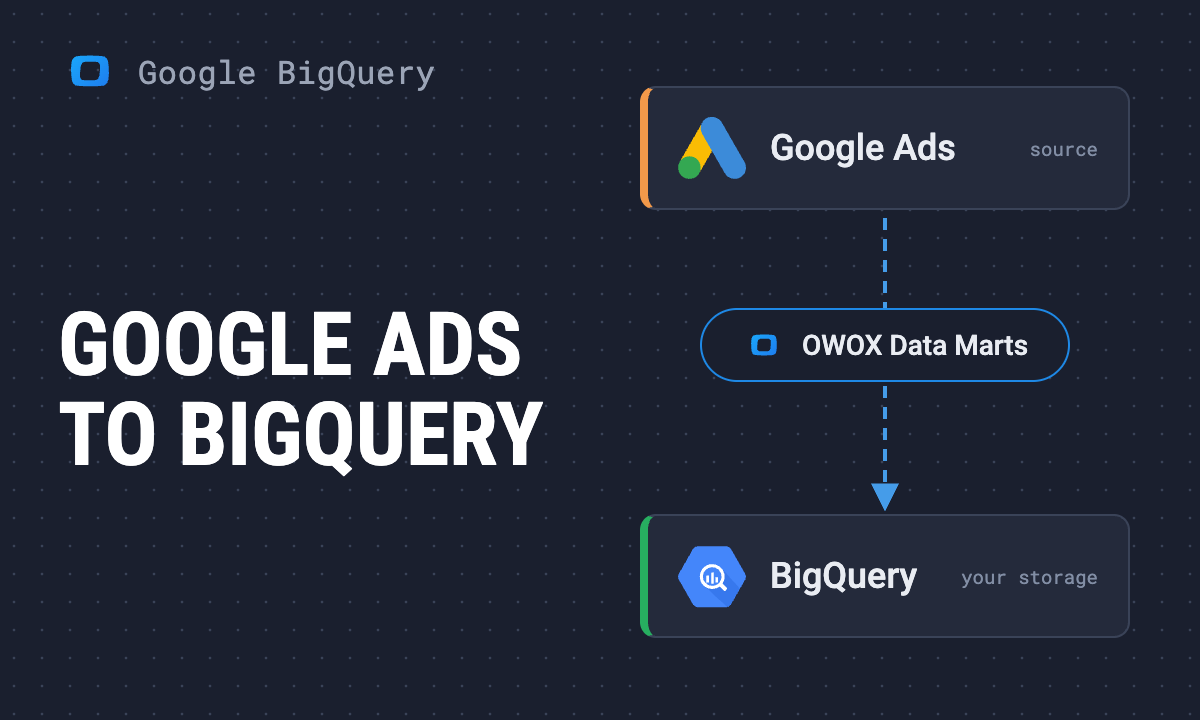 Use case · Google BigQueryGoogle Ads to BigQuery: two ways to connect them, step by step
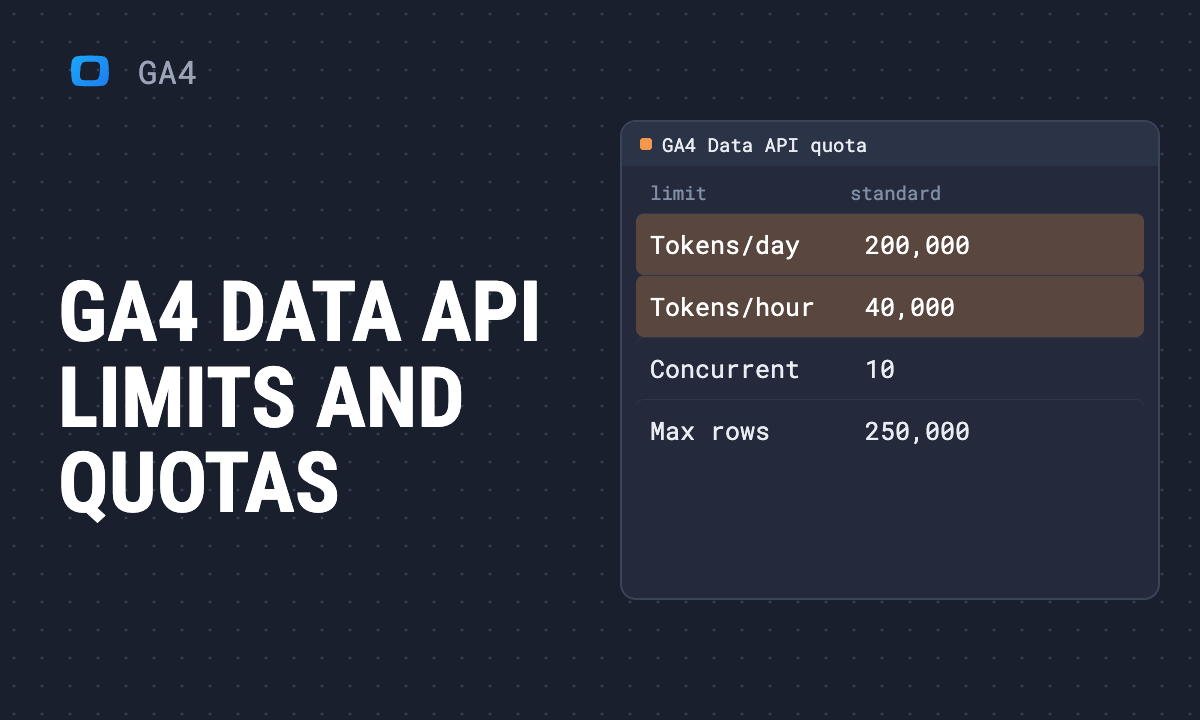 Article · GA4GA4 Data API limits and quotas, and when to use BigQuery
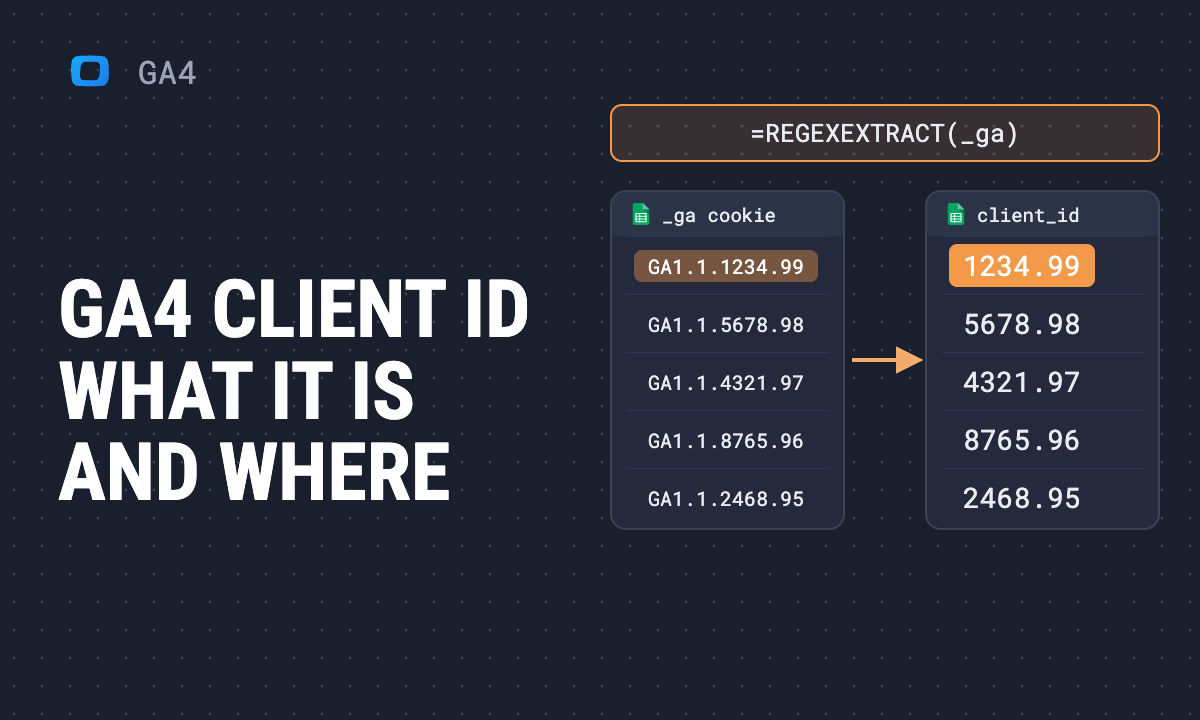 Use case · GA4Google Analytics client ID in GA4: What it is and how to get it
 Use case · Google Sheets TipsGA4 reports in Google Sheets: two ways to automate them
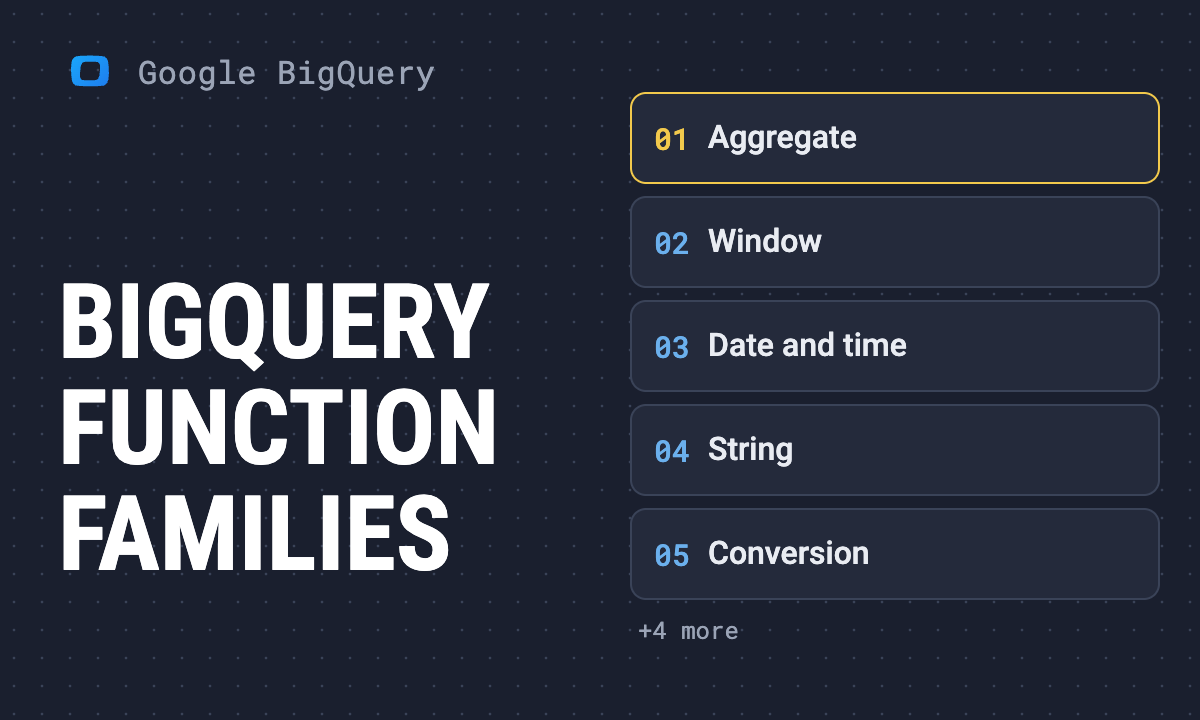 Use case · Google BigQueryBigQuery functions: a map of the main families, with examples
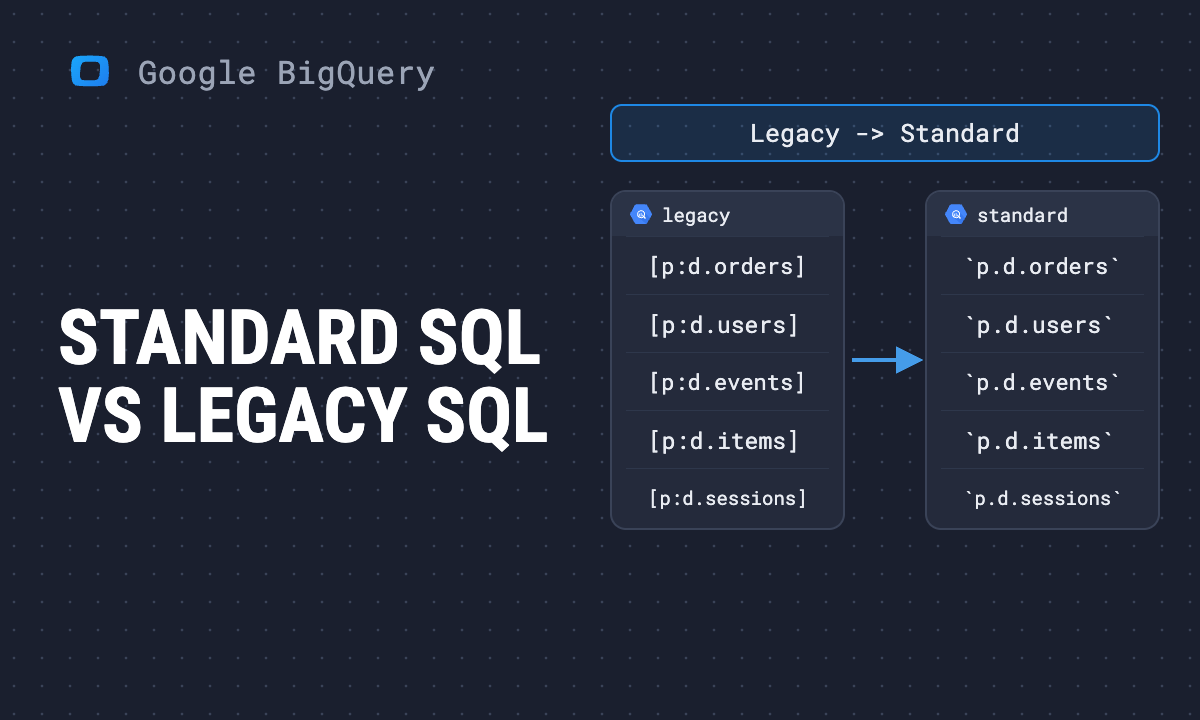 Use case · Google BigQueryBigQuery standard SQL vs legacy SQL: what changed and how to switch
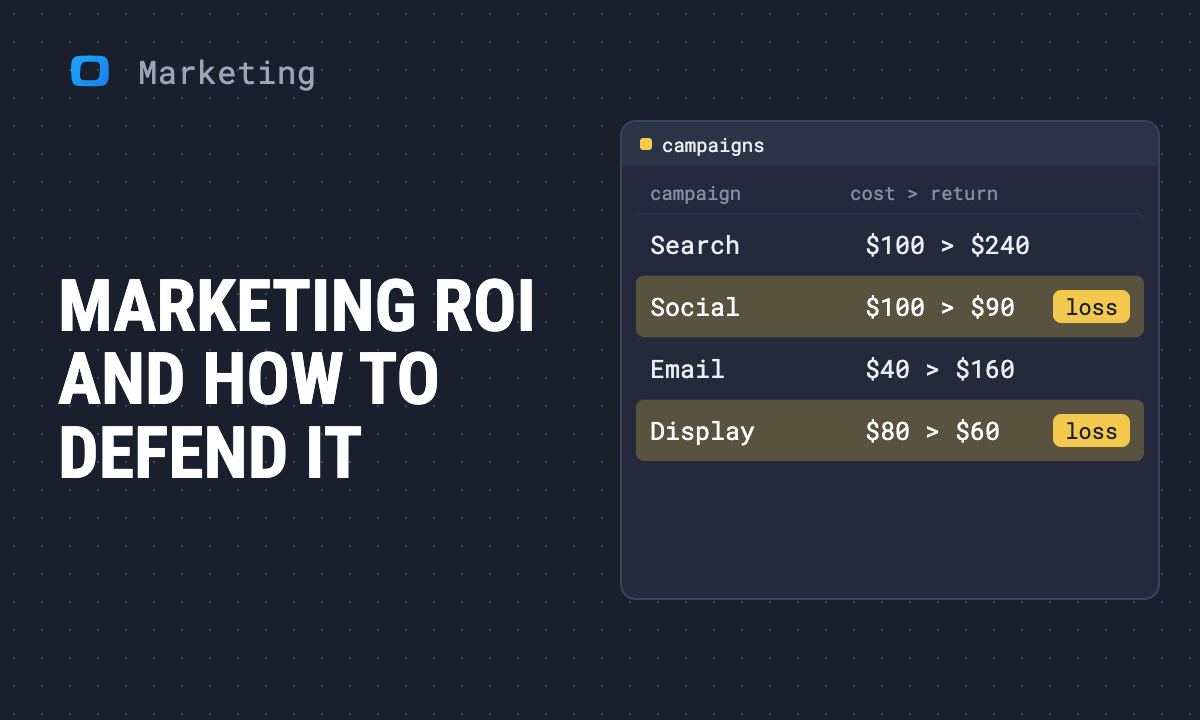 Article · Marketing StrategyHow to calculate marketing ROI, and defend the number
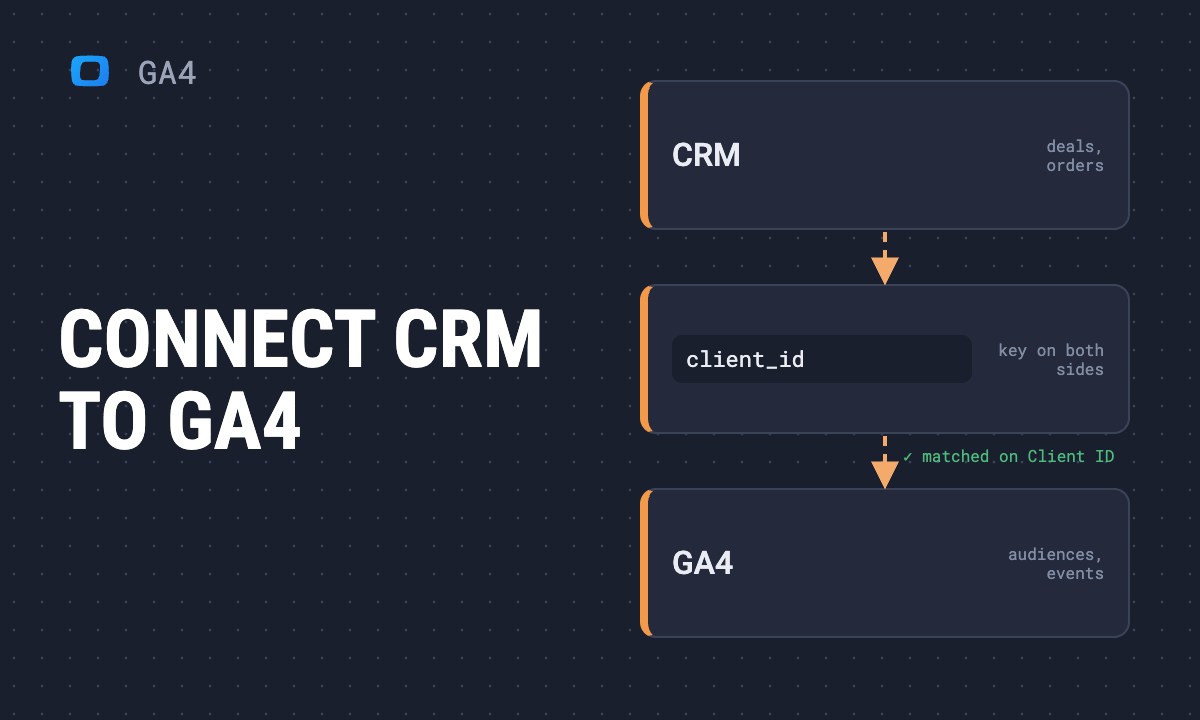 Article · GA4How to connect your CRM with Google Analytics 4
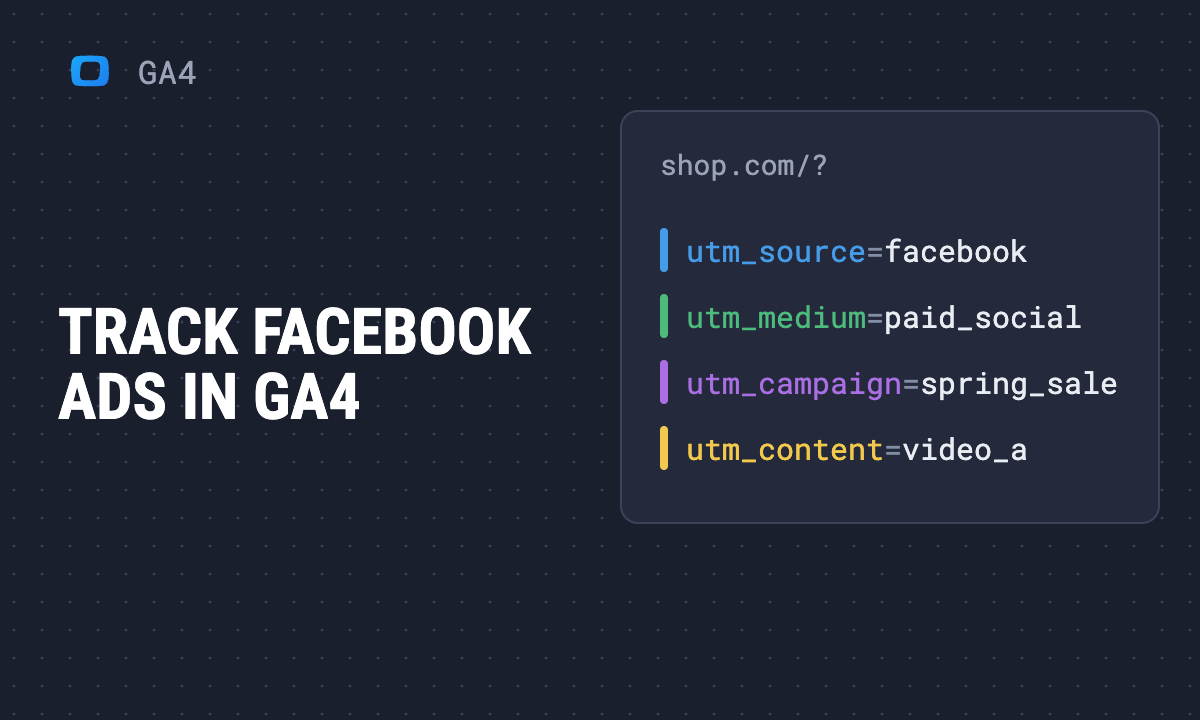 Use case · GA4How to track Facebook Ads in Google Analytics 4
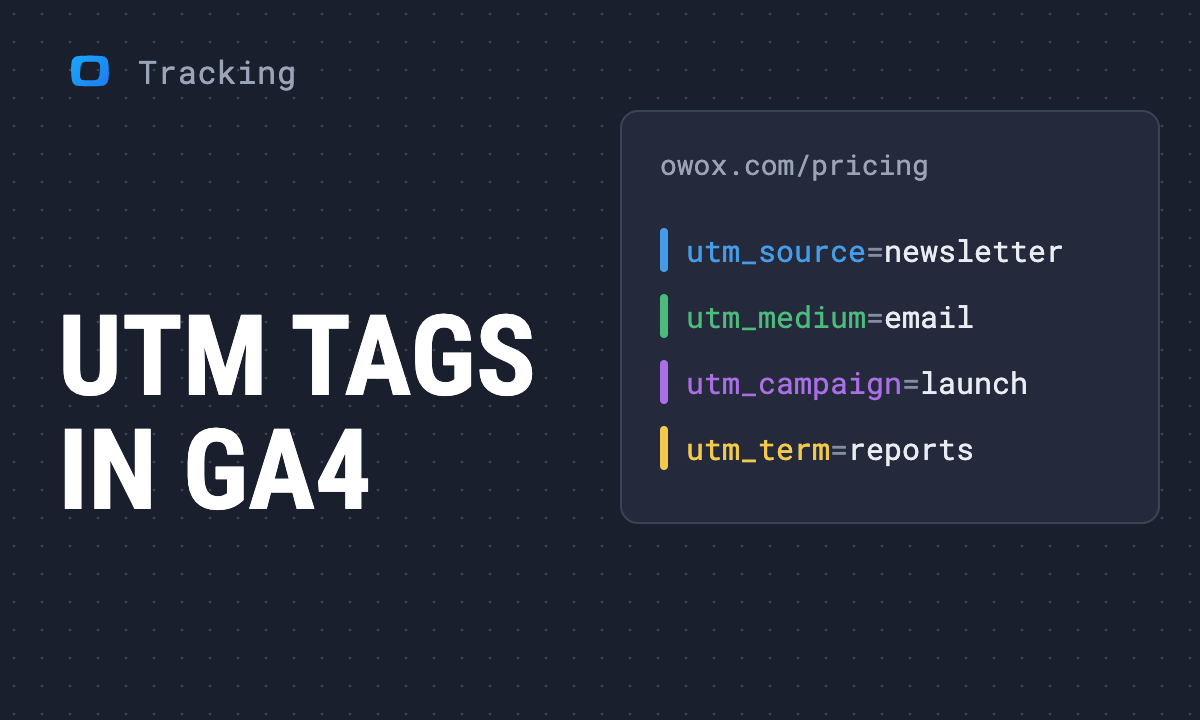 Article · Data TrackingUTM tags and UTM parameters explained: how to use them in GA4
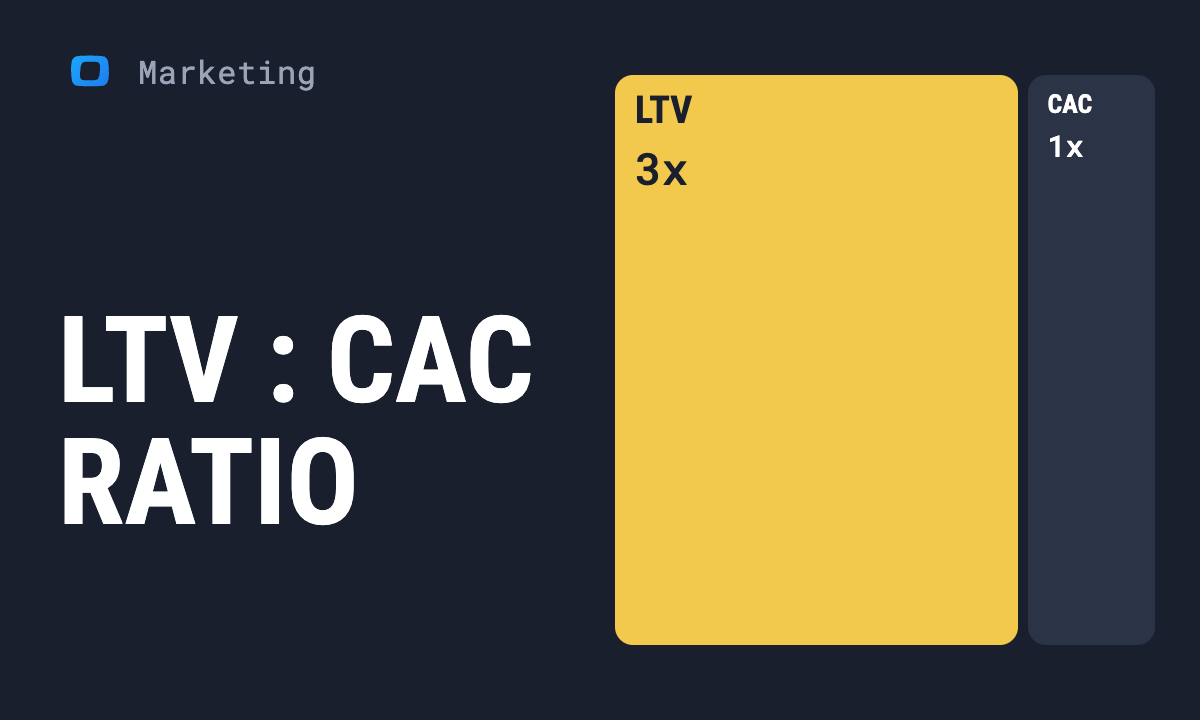 Article · Marketing StrategyLTV:CAC ratio: formula, benchmarks and what the number tells you
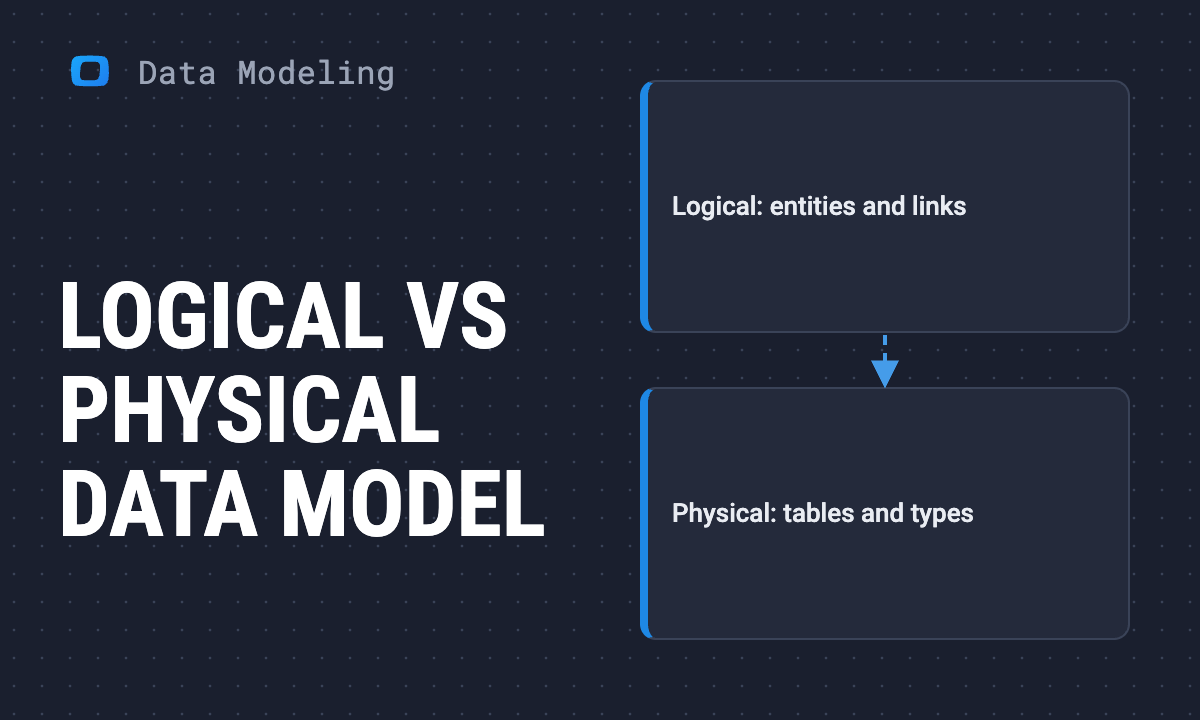 Article · Data ModelingLogical vs physical data models: the main differences explained
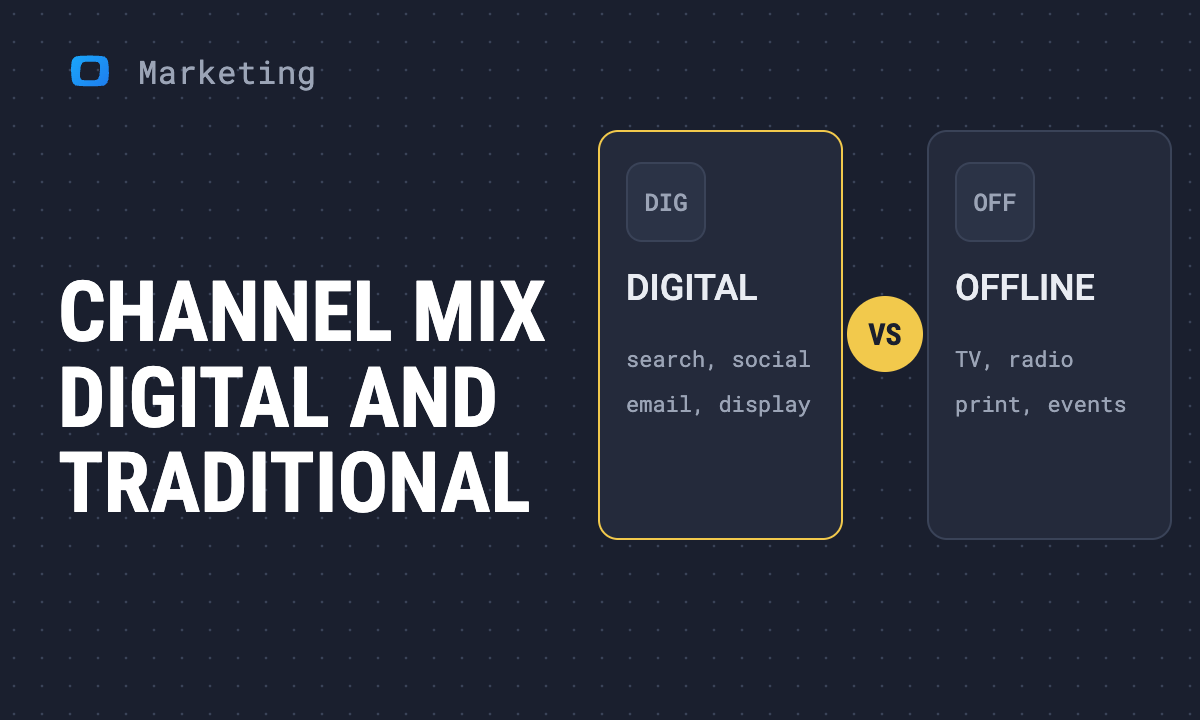 Article · Marketing StrategyChannel mix in marketing: what it is and how to build yours
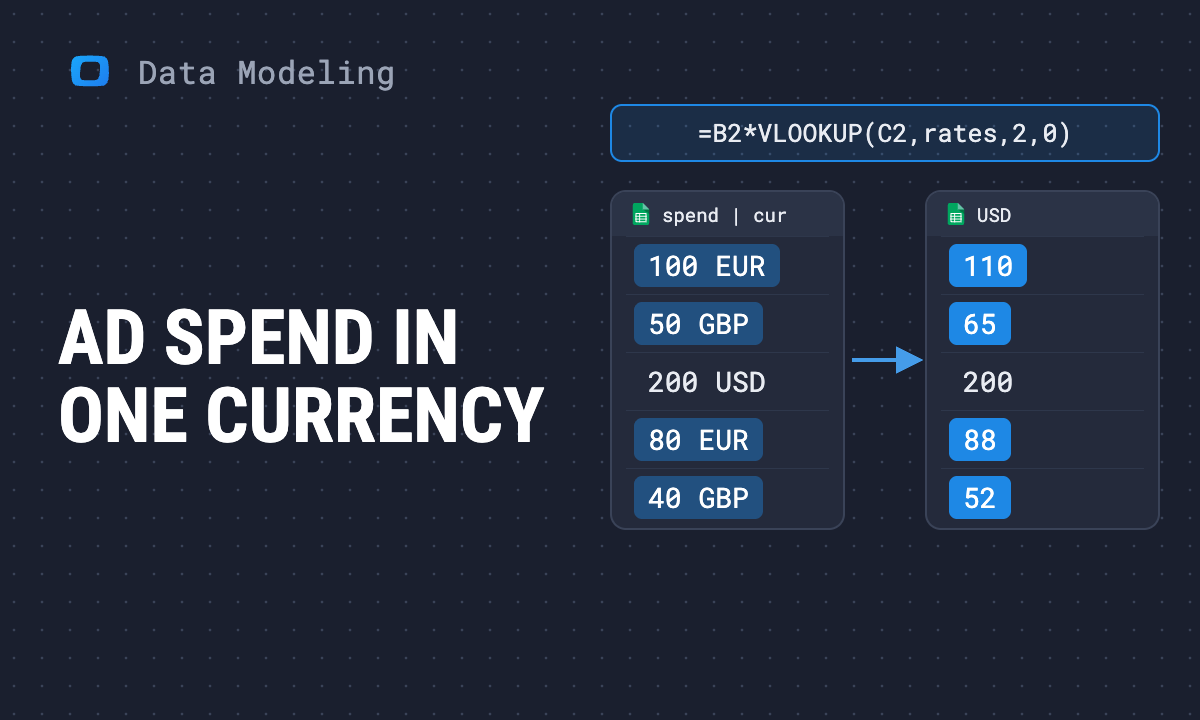 Article · Data ModelingHow to normalize ad spend across currencies in Google Sheets
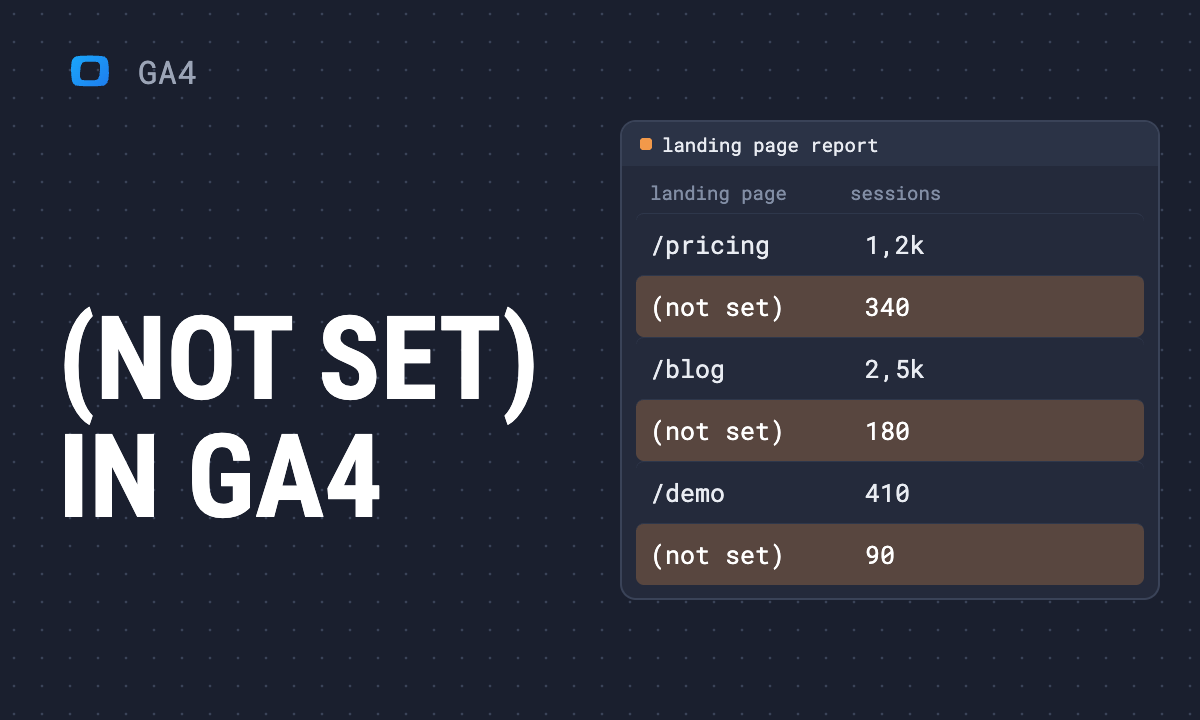 Use case · GA4What (not set) means in Google Analytics 4 and how to fix it
 Article · Data ModelingObject-oriented data models: definition, example, pros and cons
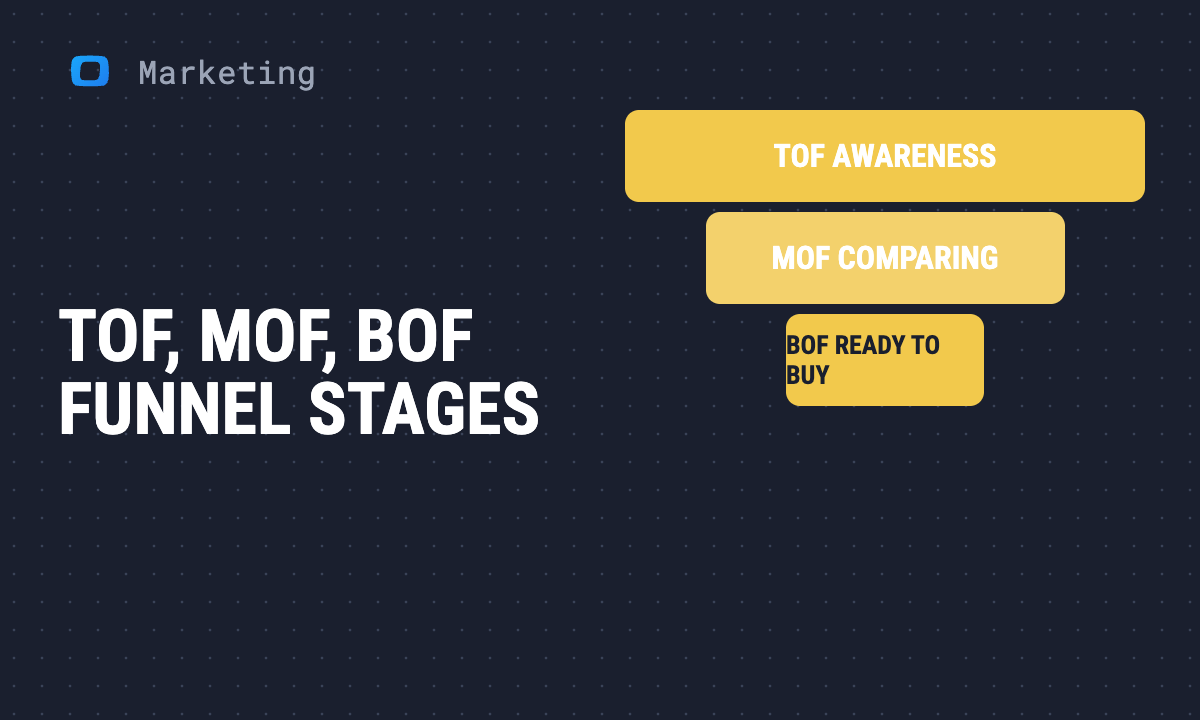 Article · Marketing StrategyTOF, MOF, BOF: marketing funnel stages and metrics explained
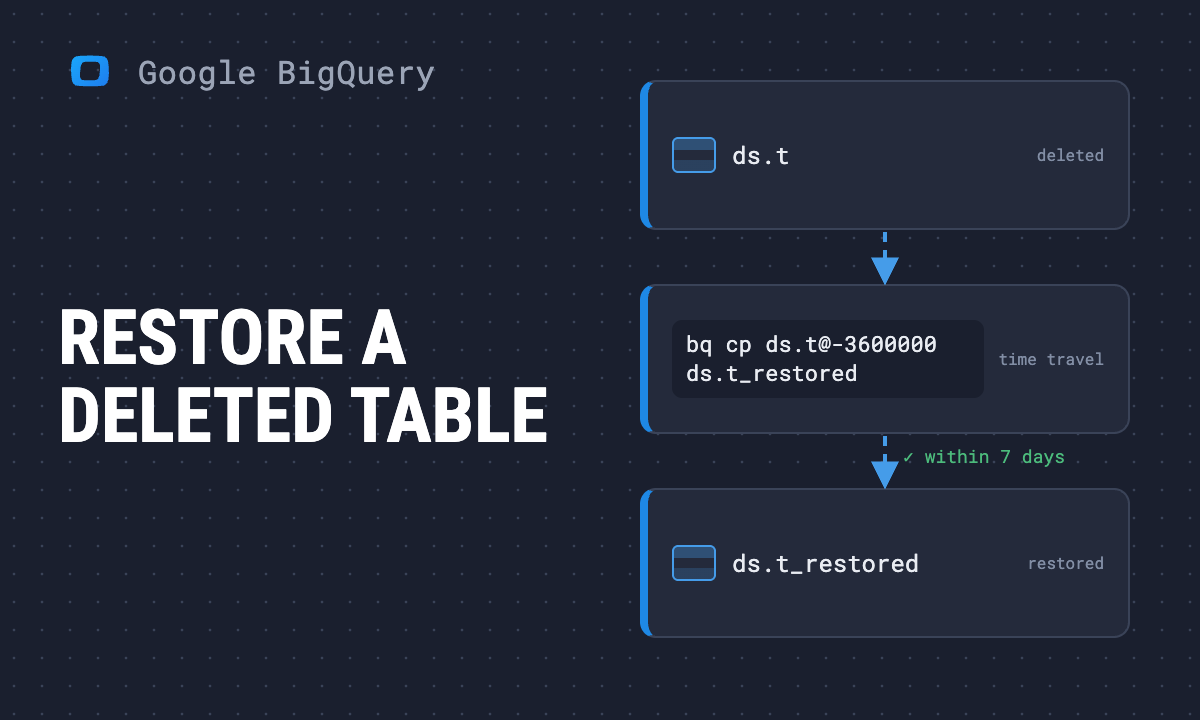 Use case · Google BigQueryHow to restore a deleted table in BigQuery, and back up your data
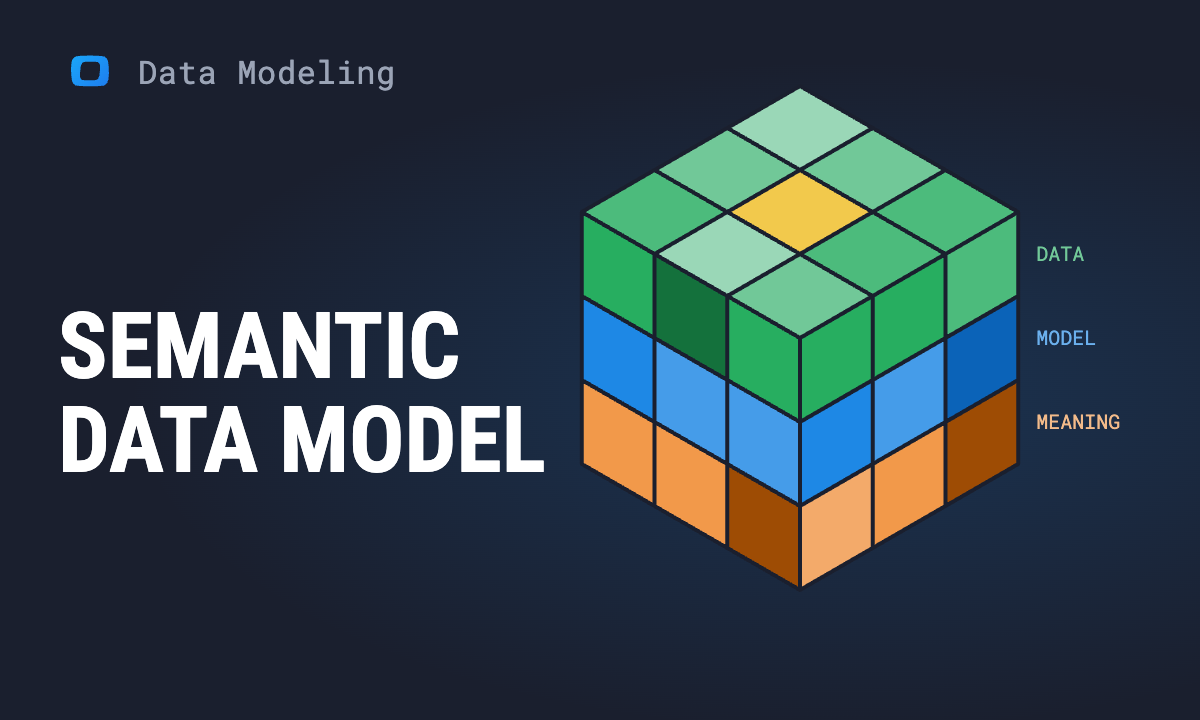 Article · Data ModelingWhat is a semantic data model?
 Article · Marketing StrategySemrush vs Similarweb: which is more accurate? A test on 787 websites
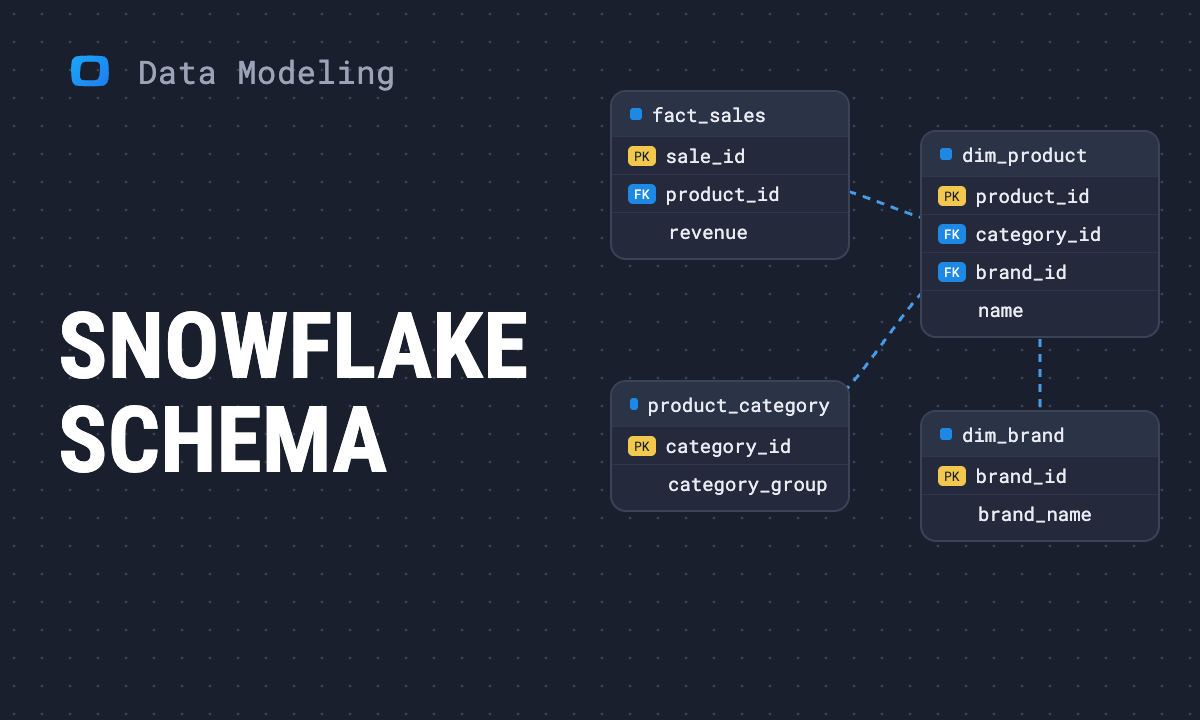 Article · Data ModelingSnowflake schema in data modeling: definition, diagram and example
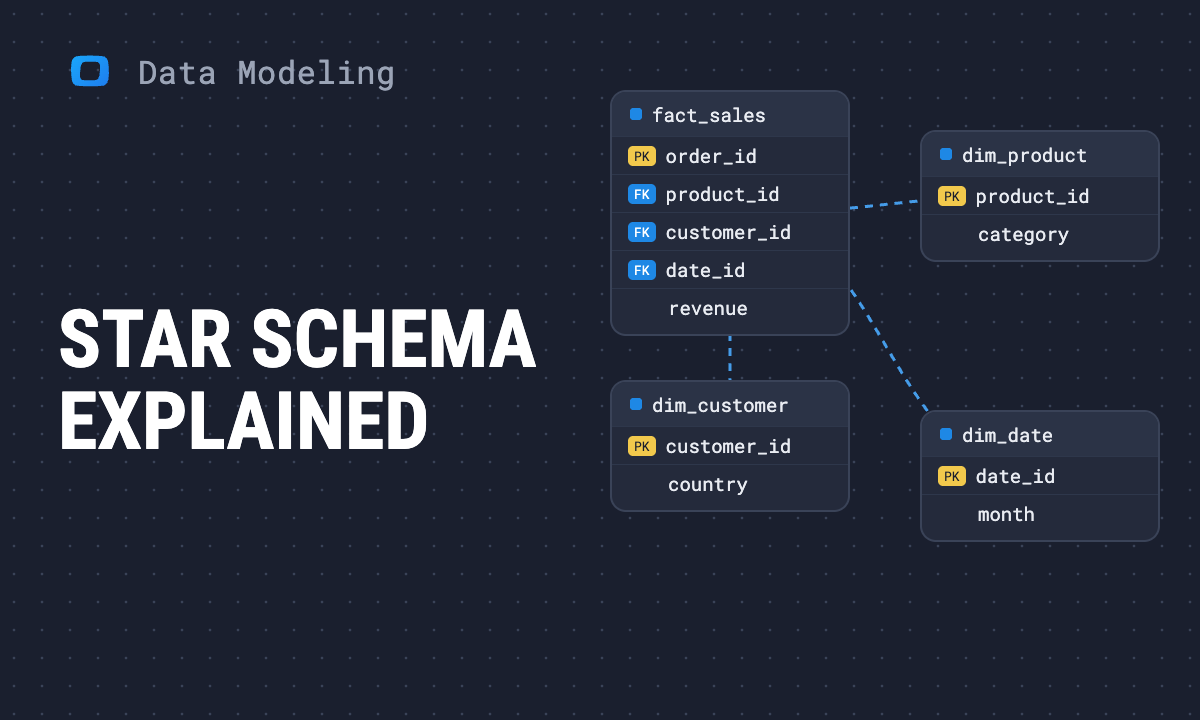 Article · Data ModelingUnderstanding star schema: definition, diagram and a SQL example
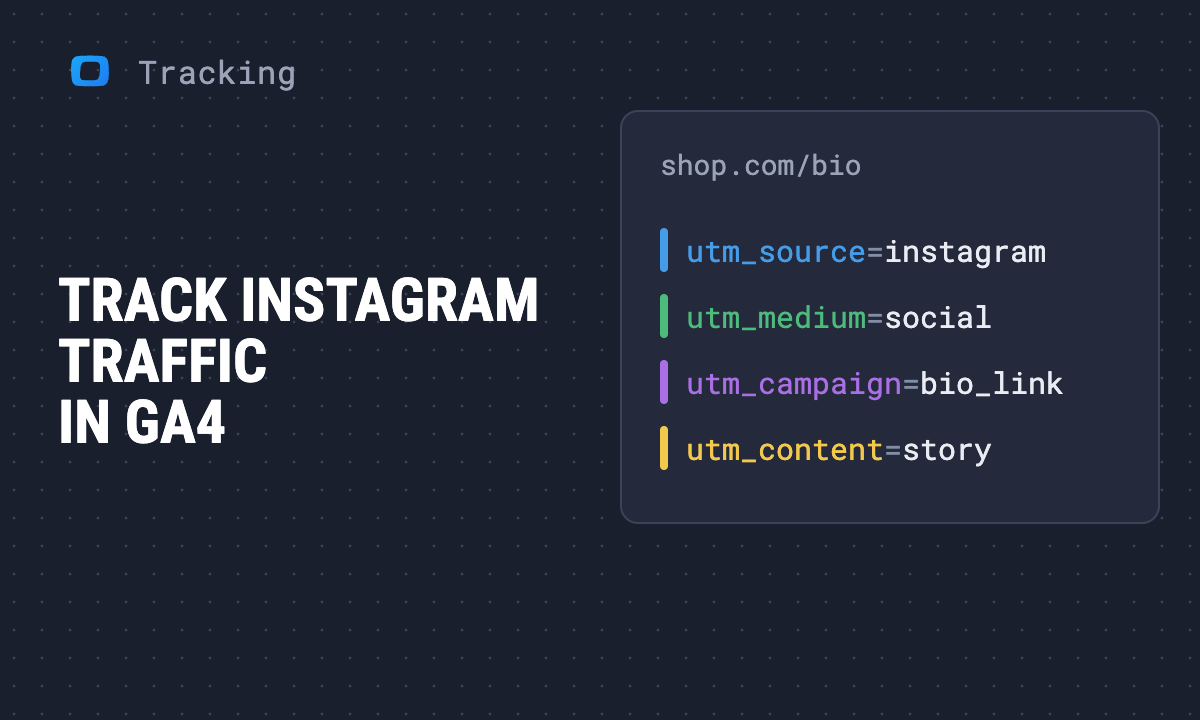 Article · Data TrackingHow to track Instagram traffic in Google Analytics 4
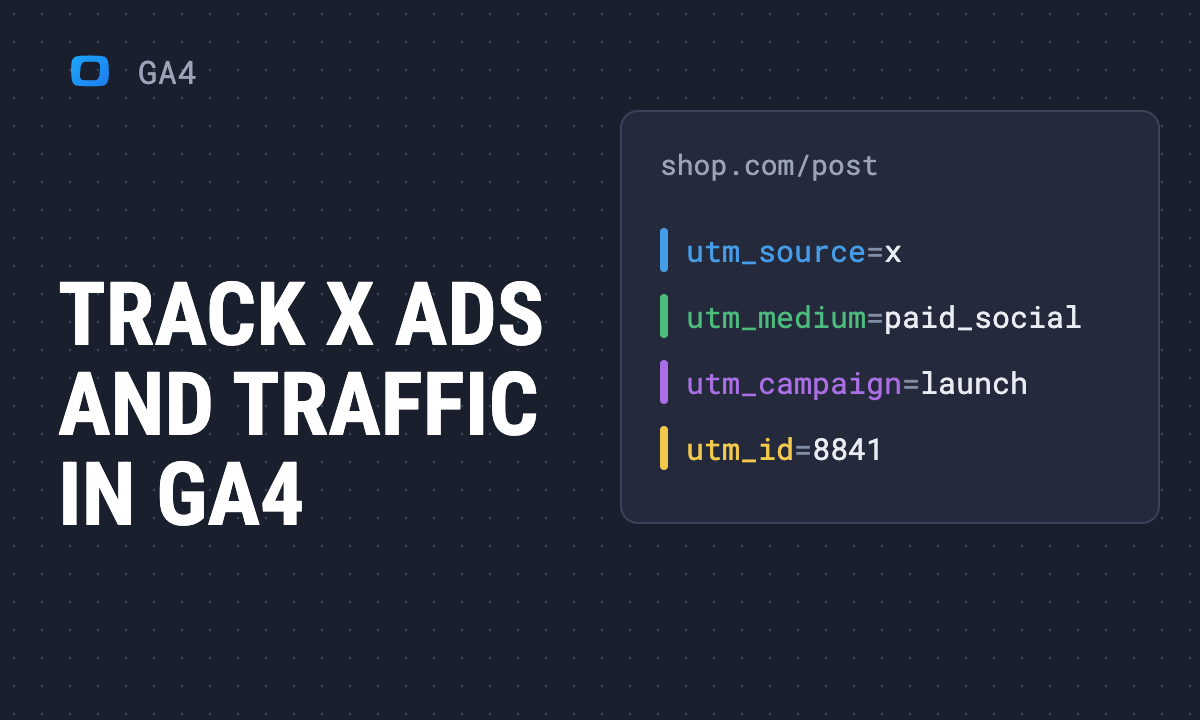 Article · GA4How to track X (Twitter) traffic and X Ads in Google Analytics 4
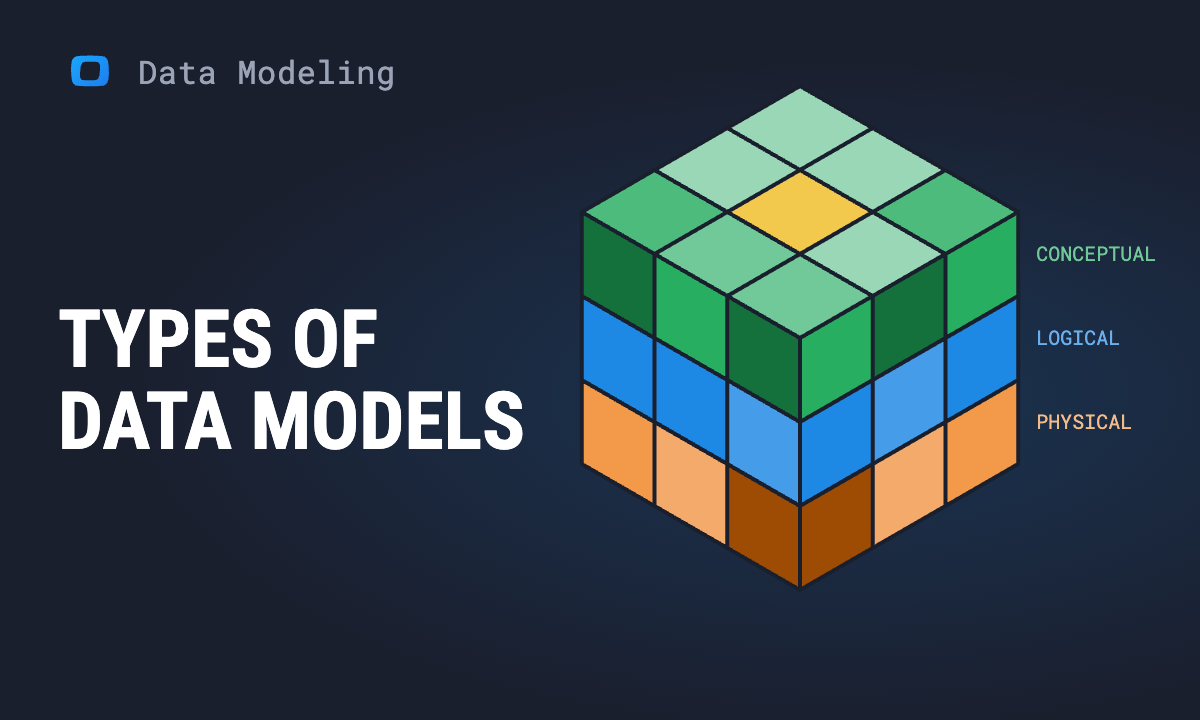 Article · Data ModelingTypes of data models and data modeling techniques in DBMS
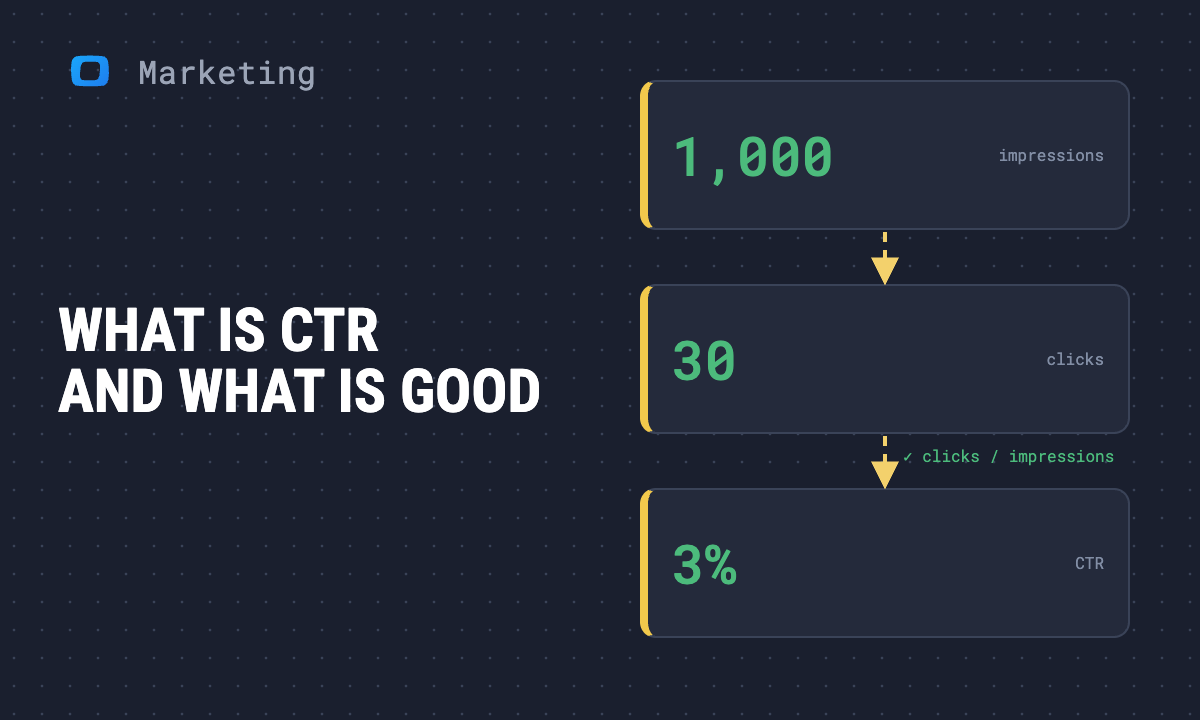 Article · Marketing StrategyWhat is CTR, and what is a good click-through rate?
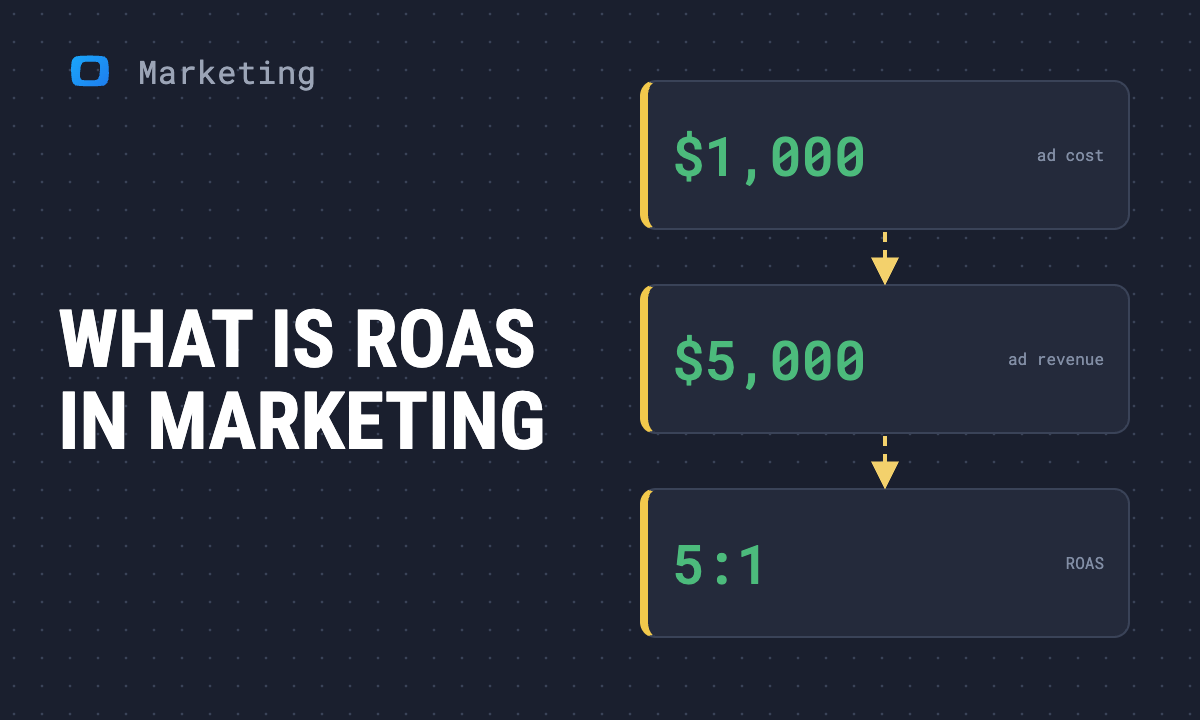 Article · Marketing StrategyWhat is ROAS in marketing? Formula, examples and what counts as good
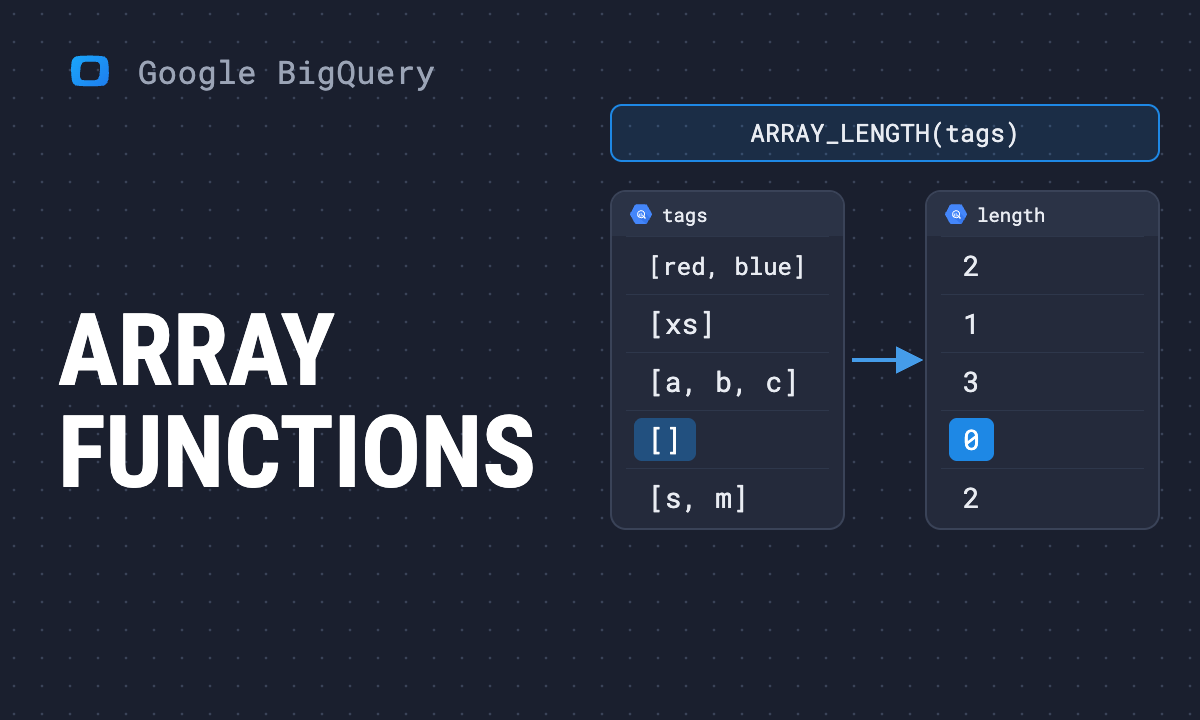 Article · Google BigQueryBigQuery array functions: syntax and tested examples
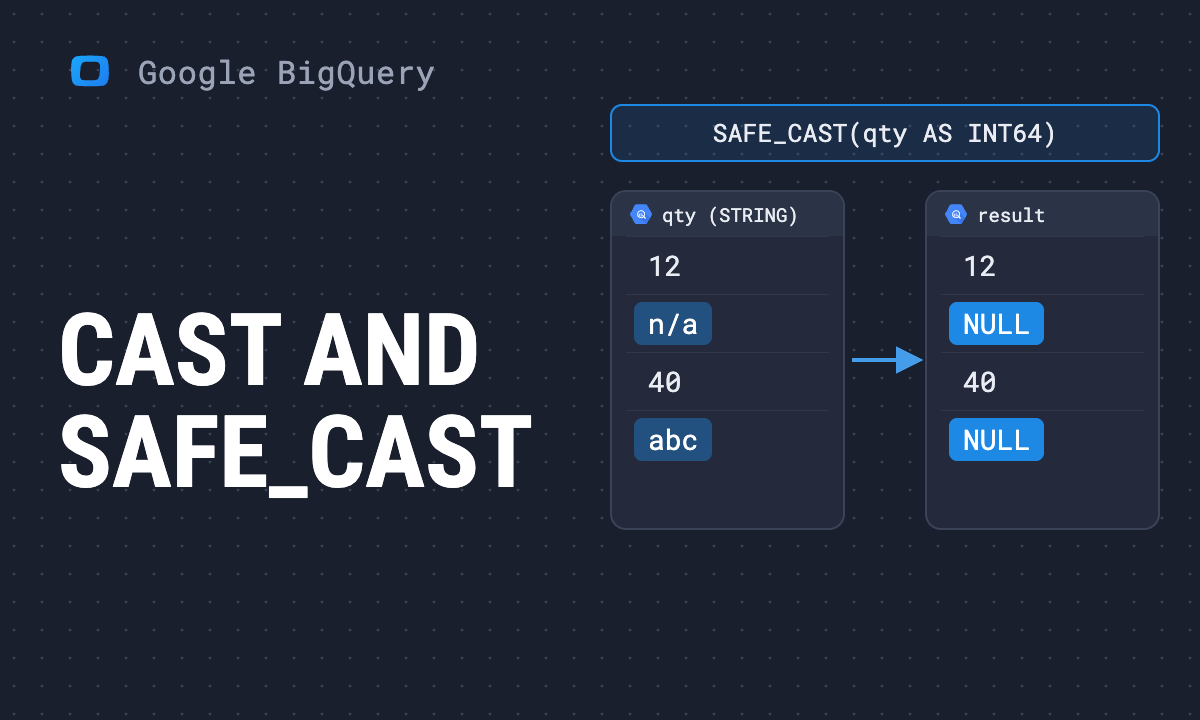 Article · Google BigQueryBigQuery CAST and SAFE_CAST: convert data types without errors
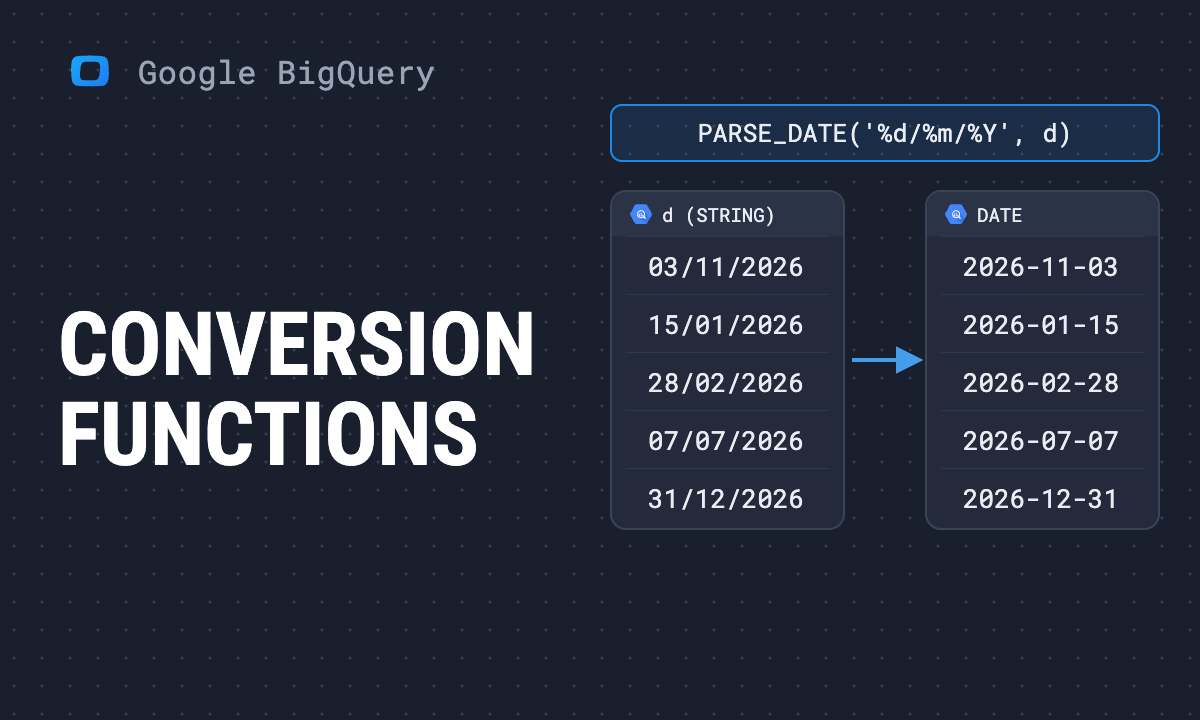 Article · Google BigQueryBigQuery conversion functions: every type-to-type conversion
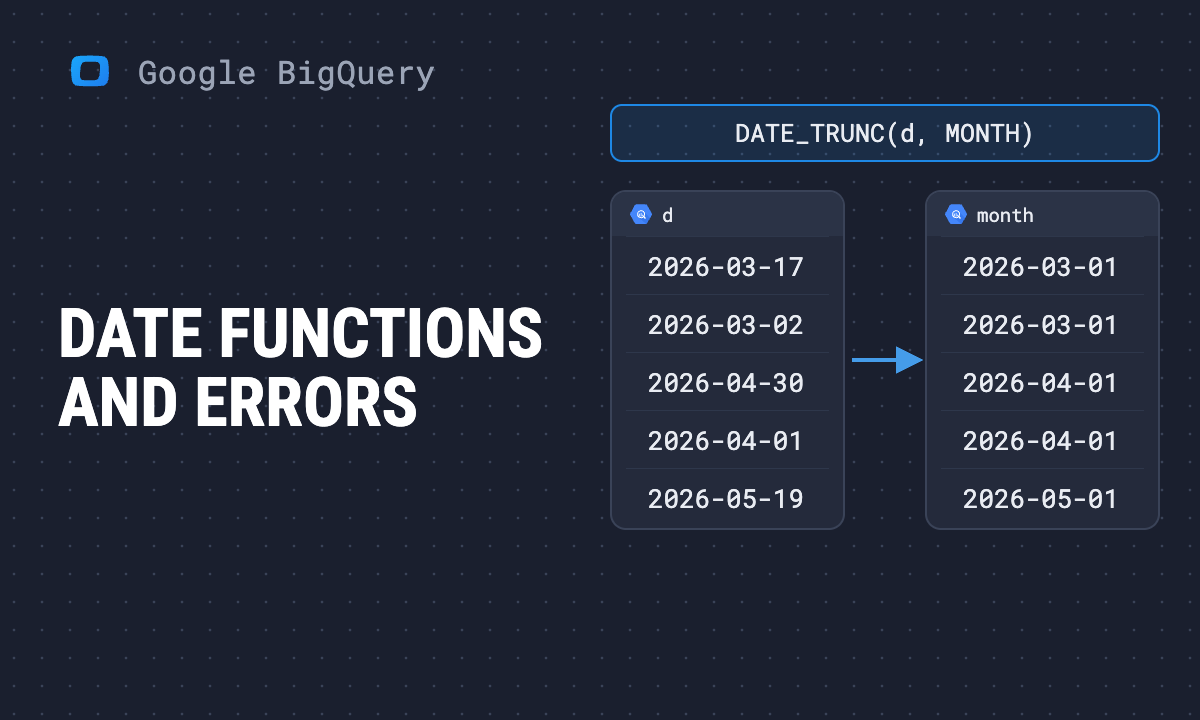 Article · Google BigQueryBigQuery date functions: syntax, examples and common errors
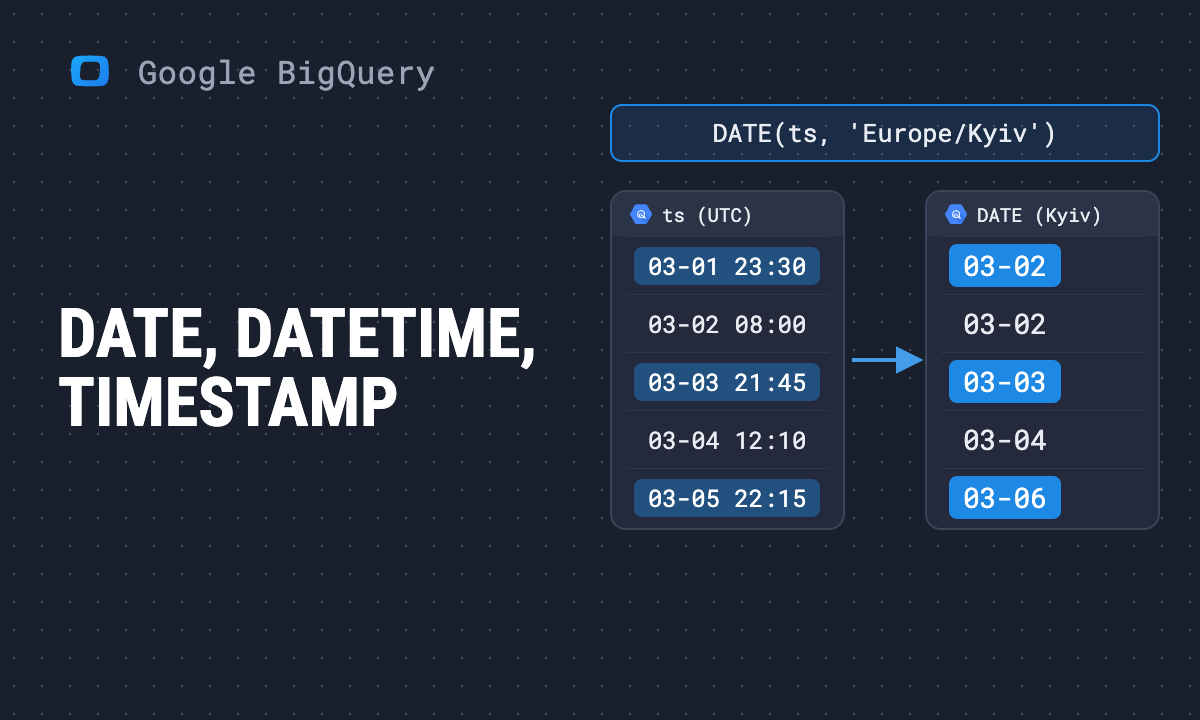 Article · Google BigQueryDATE vs DATETIME vs TIMESTAMP: how to choose the right SQL date type
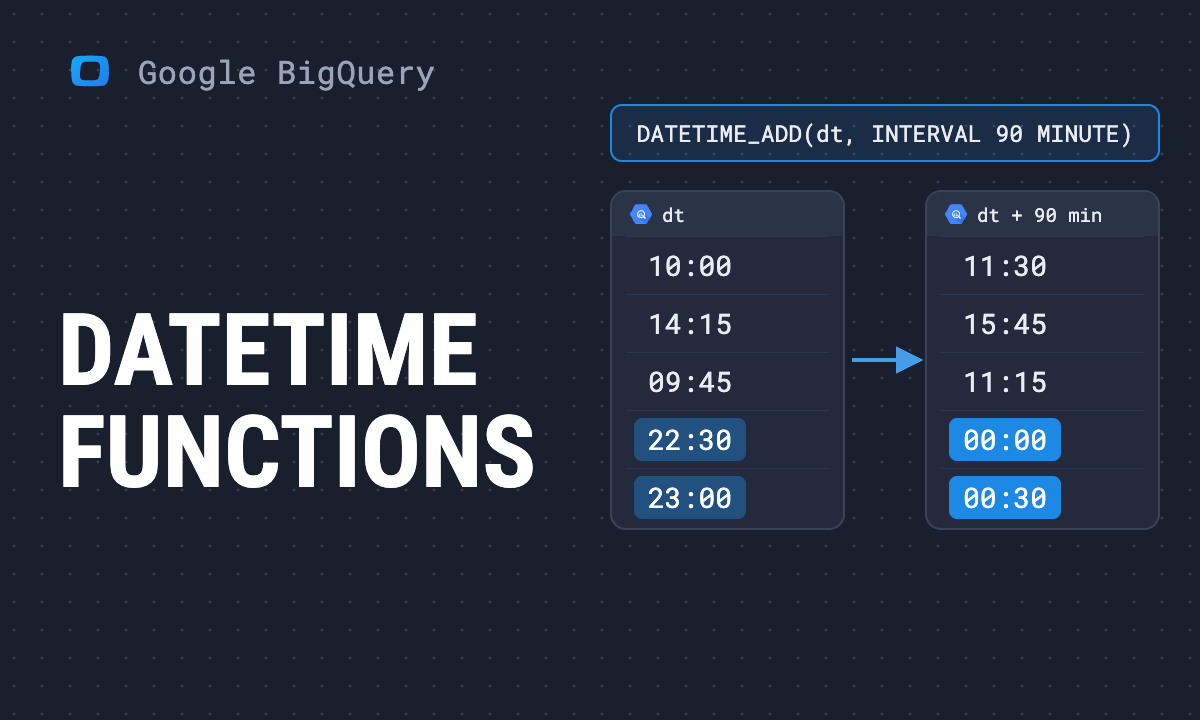 Article · Google BigQueryBigQuery datetime functions: syntax and tested examples
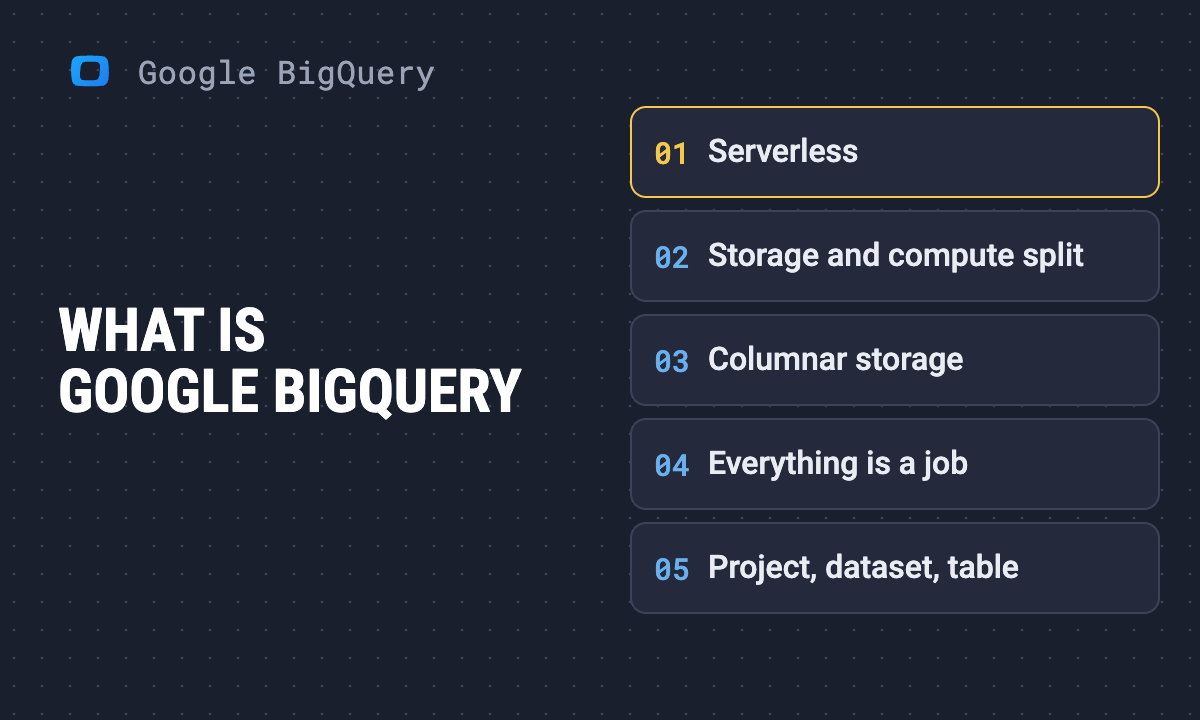 Article · Google BigQueryWhat is Google BigQuery: how it works, costs and where to start
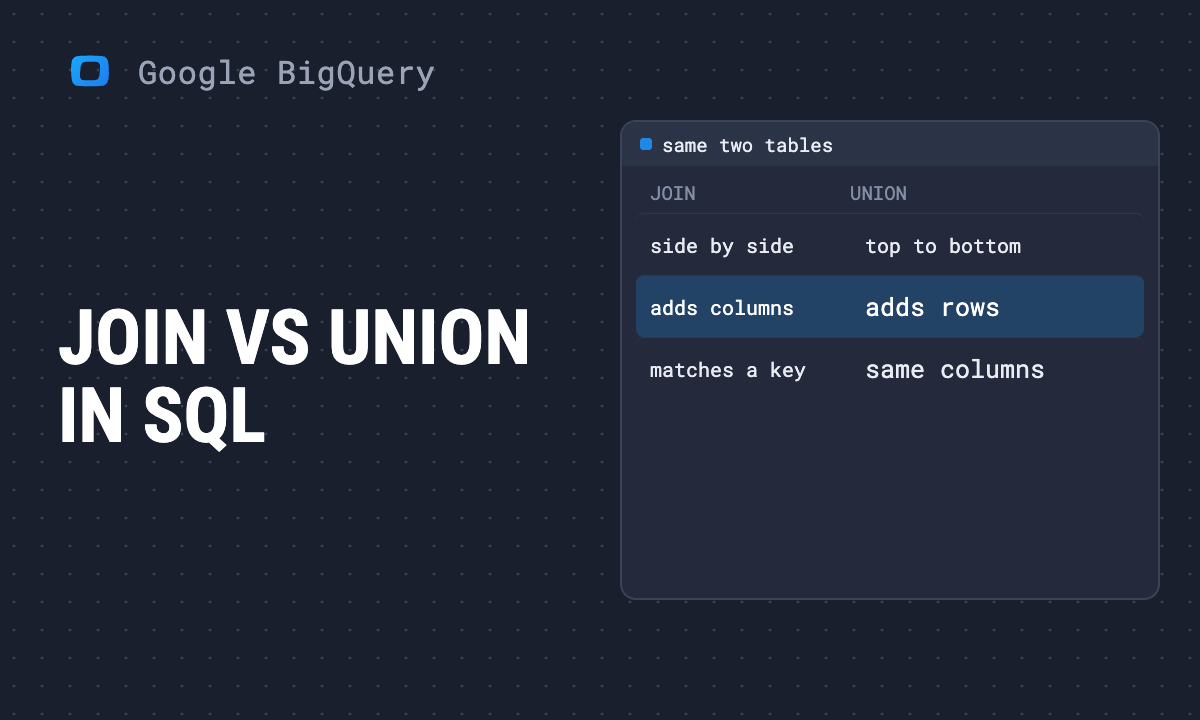 Article · Google BigQueryJOIN vs UNION in SQL: the difference, with examples
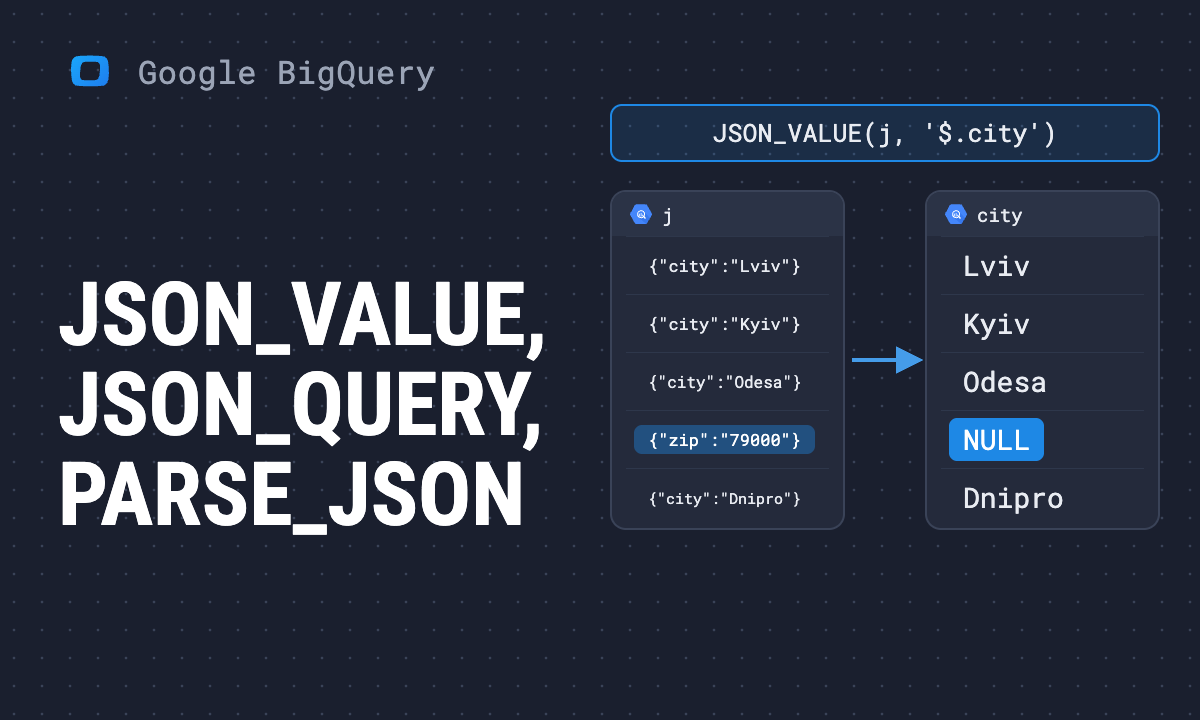 Article · Google BigQueryBigQuery JSON functions: JSON_VALUE, JSON_QUERY and PARSE_JSON explained
 Article · Google BigQueryBigQuery ML: what it is, model types and a working example
 Article · Google BigQueryBigQuery ALTER TABLE: add, rename and drop columns, change data types
 Article · Google BigQueryBigQuery partitioned tables: how to create, query and manage them
 Article · Google BigQueryBigQuery pricing: what queries and storage cost, with examples
 Article · Google BigQueryBigQuery query history: how to find, query and audit past jobs
 Article · Google BigQueryHow to connect BigQuery to Google Sheets: three ways
 Article · Google BigQueryWHERE vs HAVING vs QUALIFY: SQL filter clauses explained
 Article · Google BigQueryBigQuery timestamp functions: syntax and tested examples
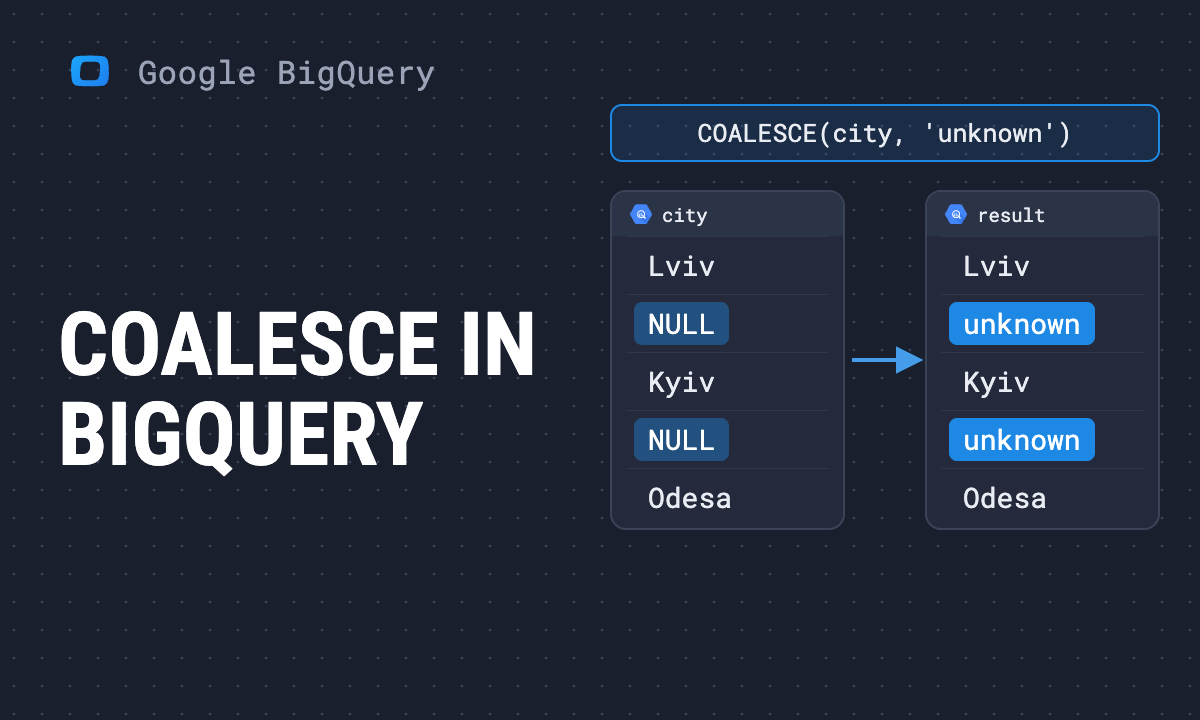 Article · Google BigQueryCOALESCE in BigQuery: syntax, examples and common mistakes
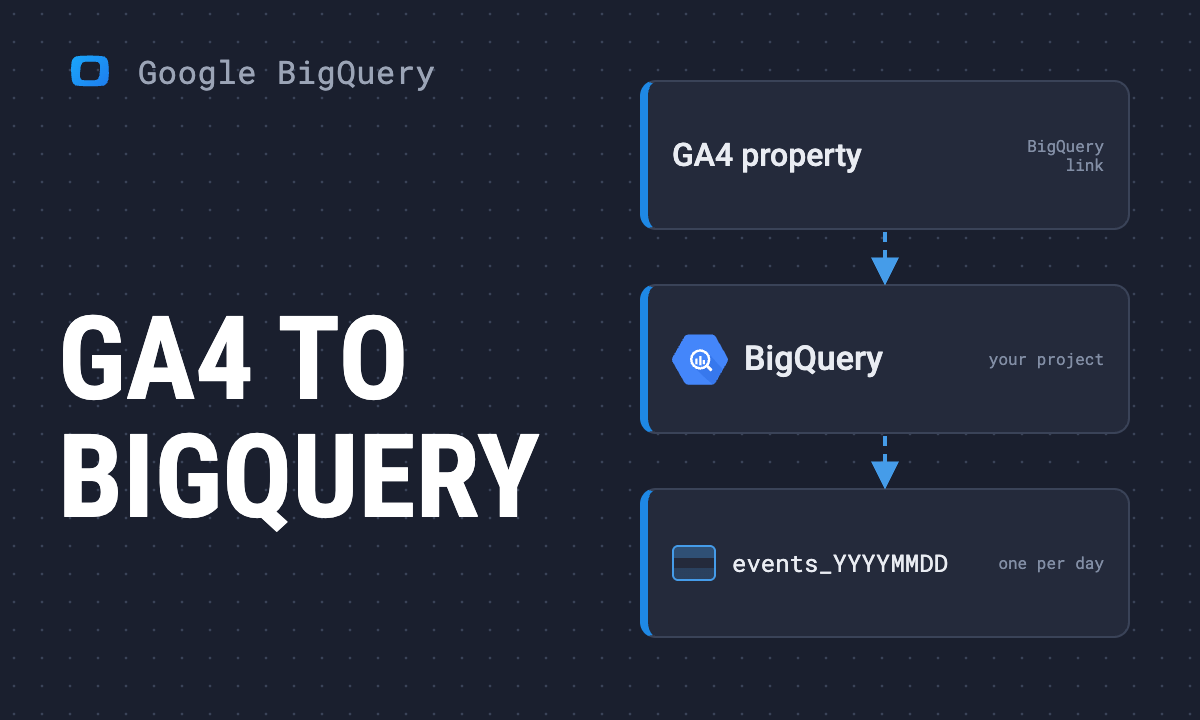 Article · Google BigQueryHow to connect GA4 to BigQuery: setup, limits and first queries
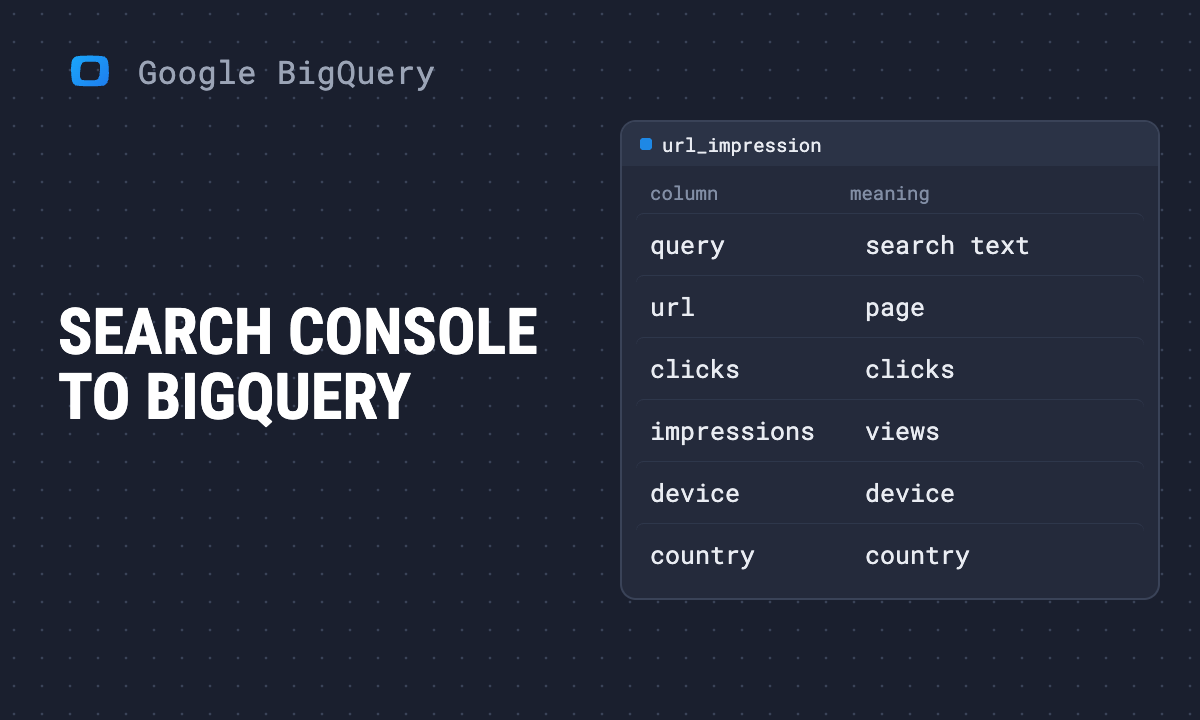 Article · Google BigQueryGoogle Search Console to BigQuery: bulk data export setup and SQL
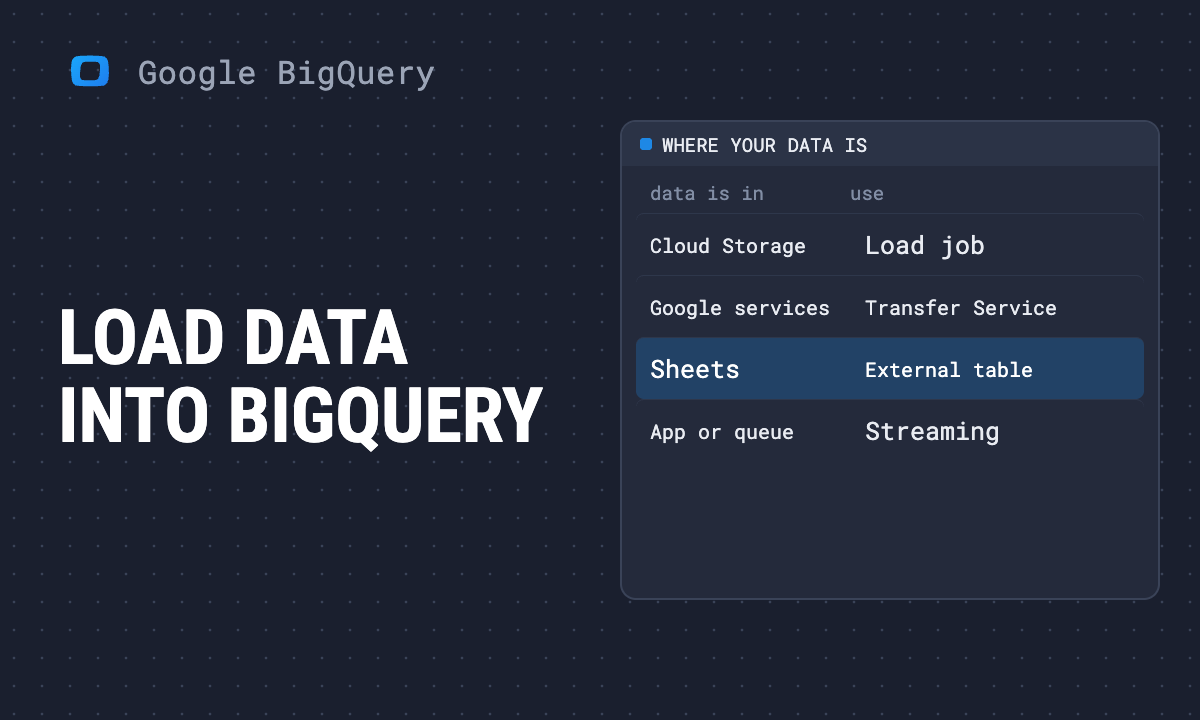 Article · Google BigQueryHow to load data into BigQuery: every method and when to use it
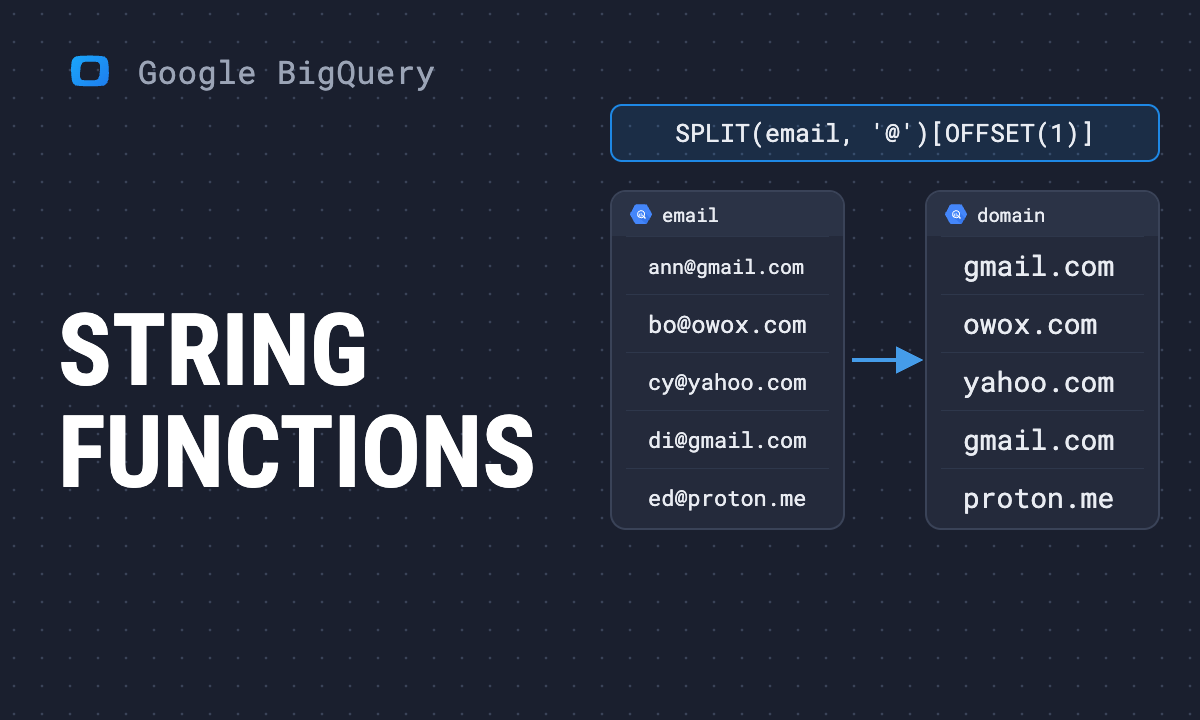 Article · Google BigQueryBigQuery string functions: syntax and tested examples
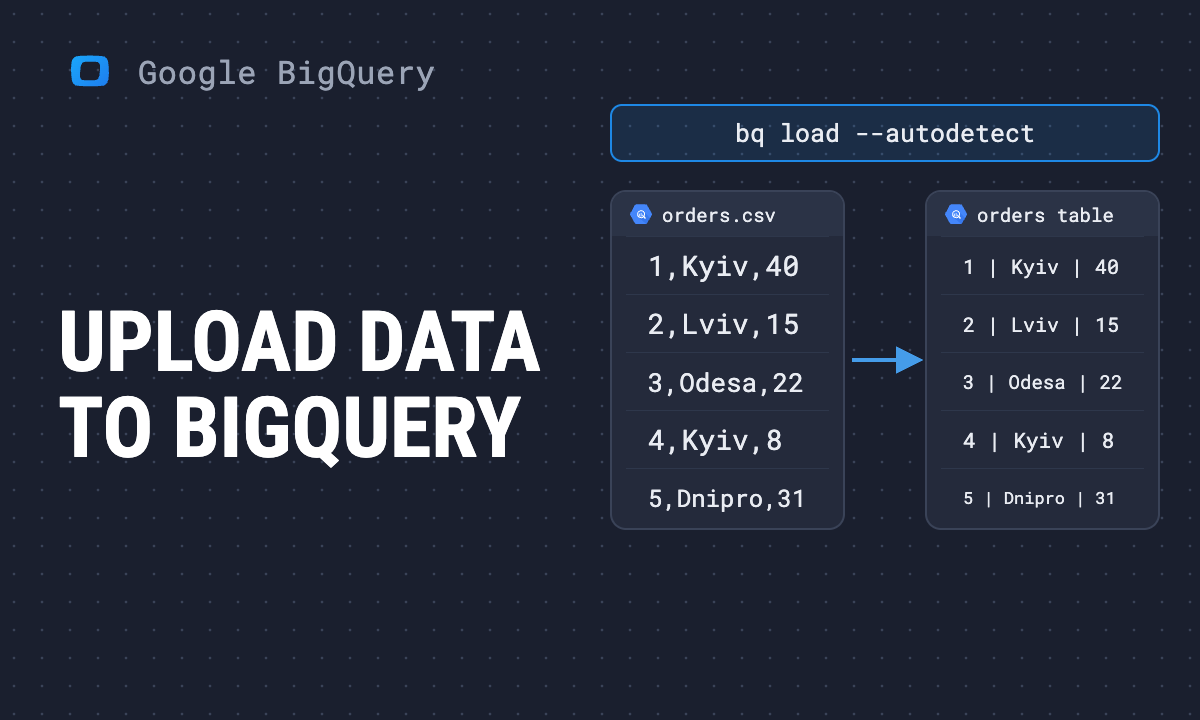 Article · Google BigQueryHow to upload data to BigQuery: CSV, Google Drive and SQL
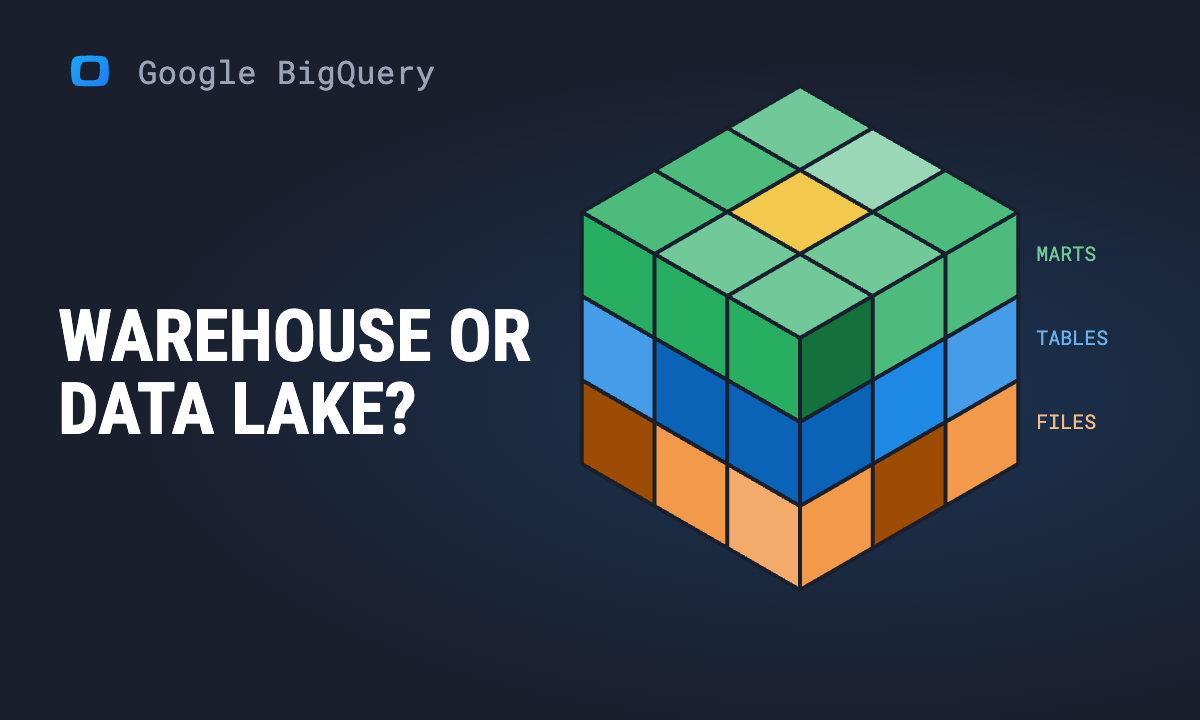 Article · Google BigQueryIs BigQuery a data warehouse or a data lake? A guide for marketing teams
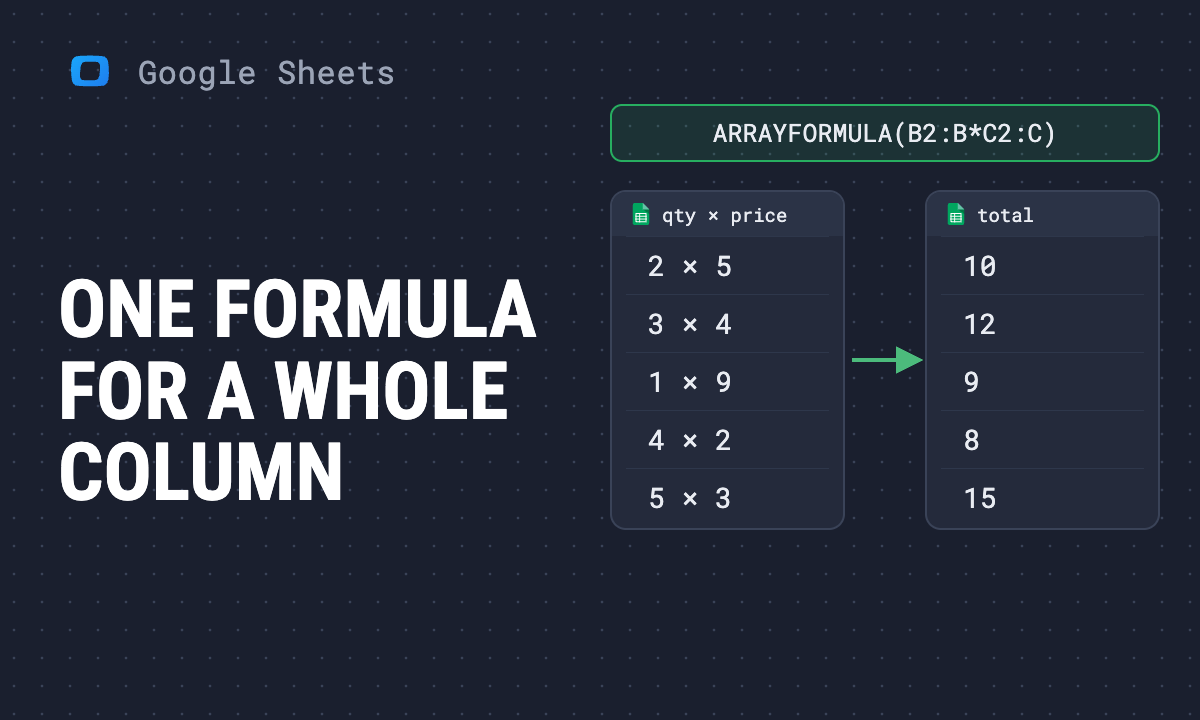 Article · Google Sheets TipsARRAYFORMULA in Google Sheets: how to use array formulas, with examples
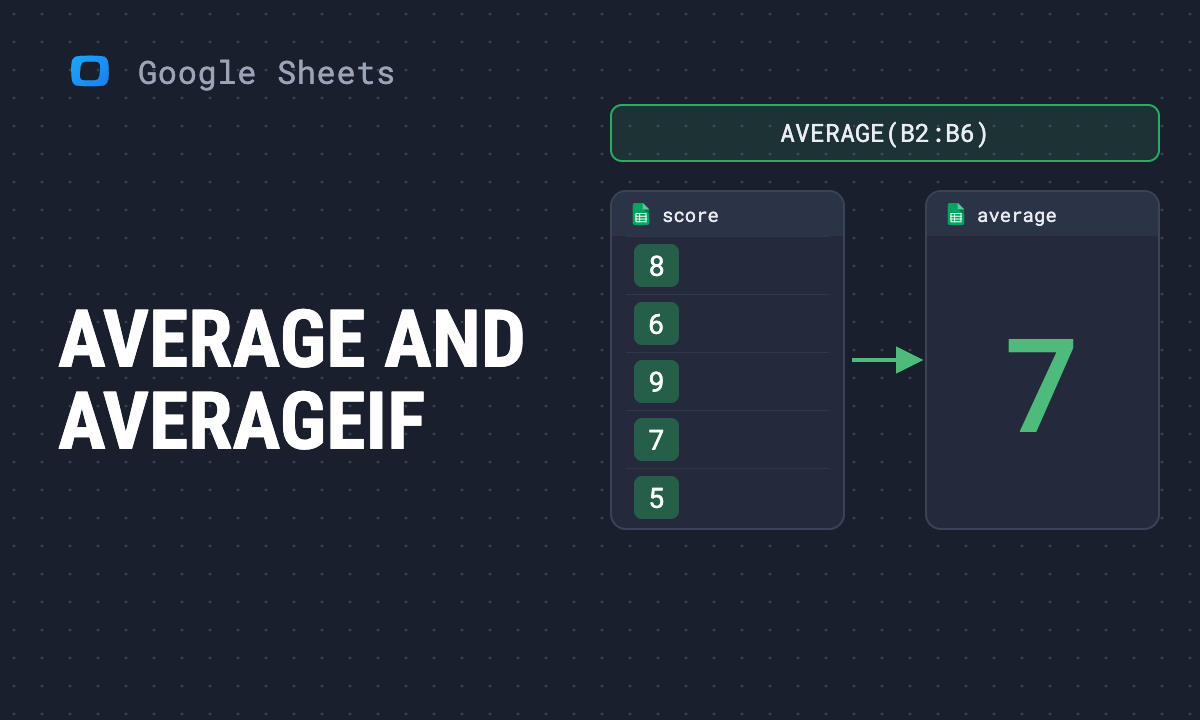 Article · Google Sheets TipsHow to calculate an average in Google Sheets: AVERAGE, AVERAGEIF and AVERAGEIFS
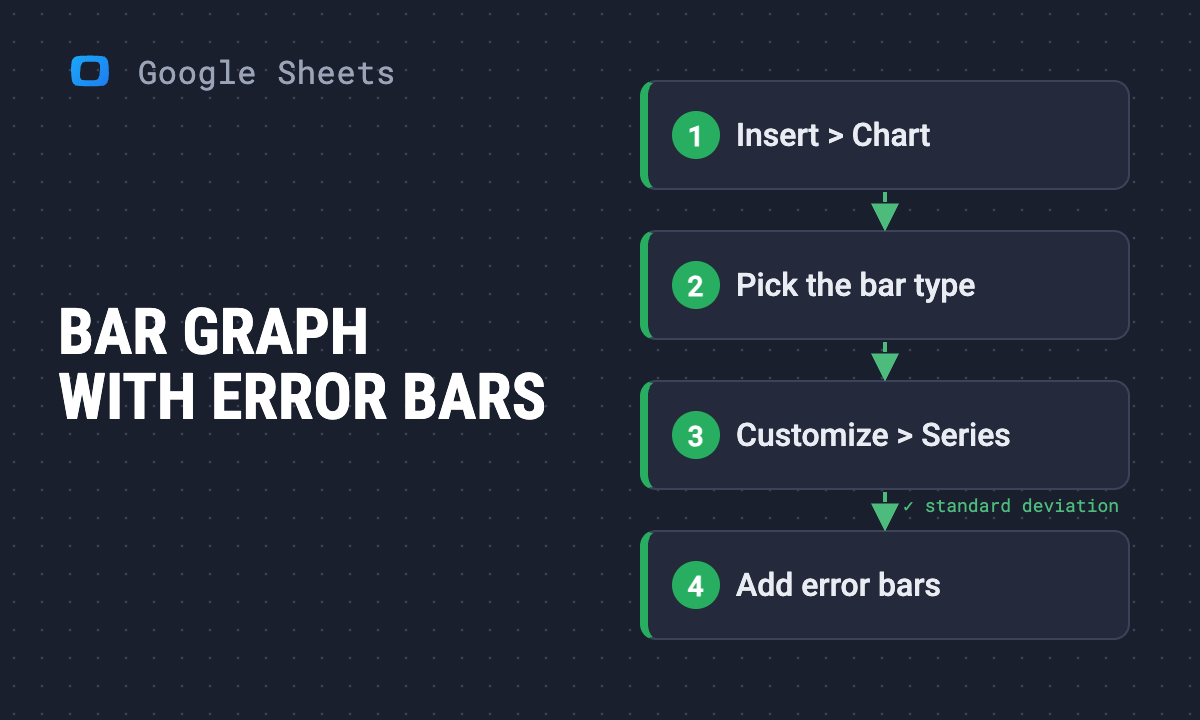 Article · Google Sheets TipsHow to make a bar graph in Google Sheets, with error bars
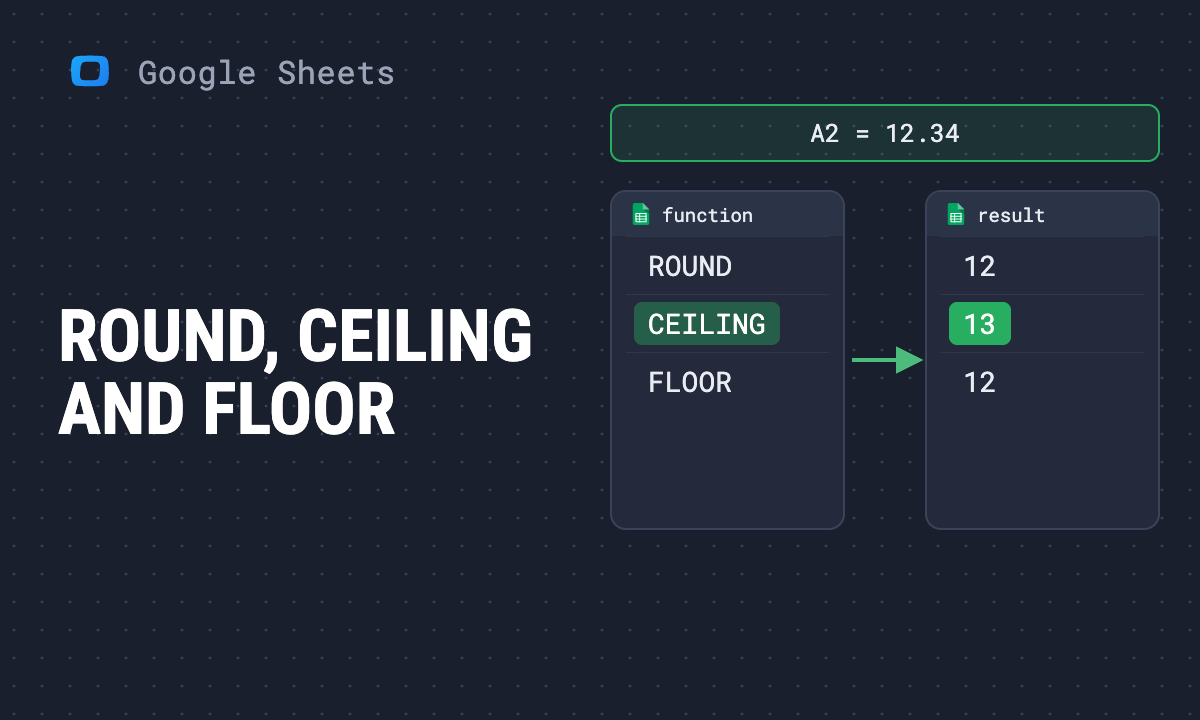 Article · Google Sheets TipsROUND, CEILING and FLOOR in Google Sheets: which rounding function to use
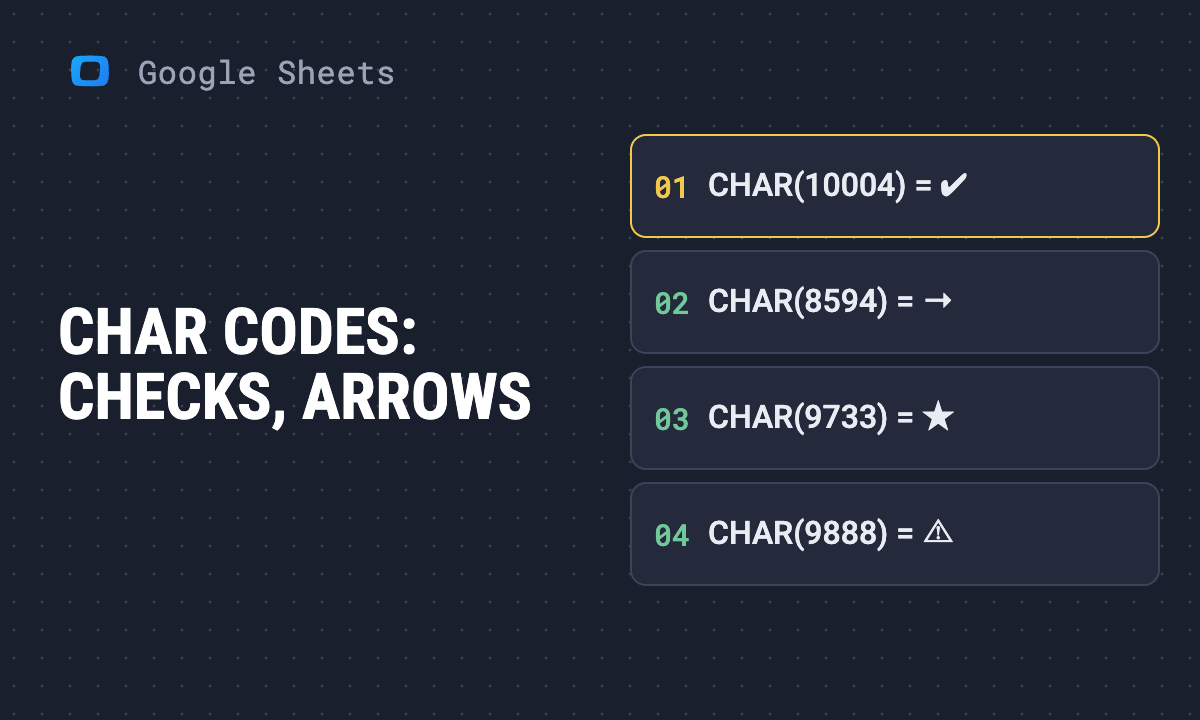 Article · Google Sheets TipsCHAR function in Google Sheets: list of codes and examples
 Article · Google Sheets TipsHow to make a chart in Google Sheets: types and settings
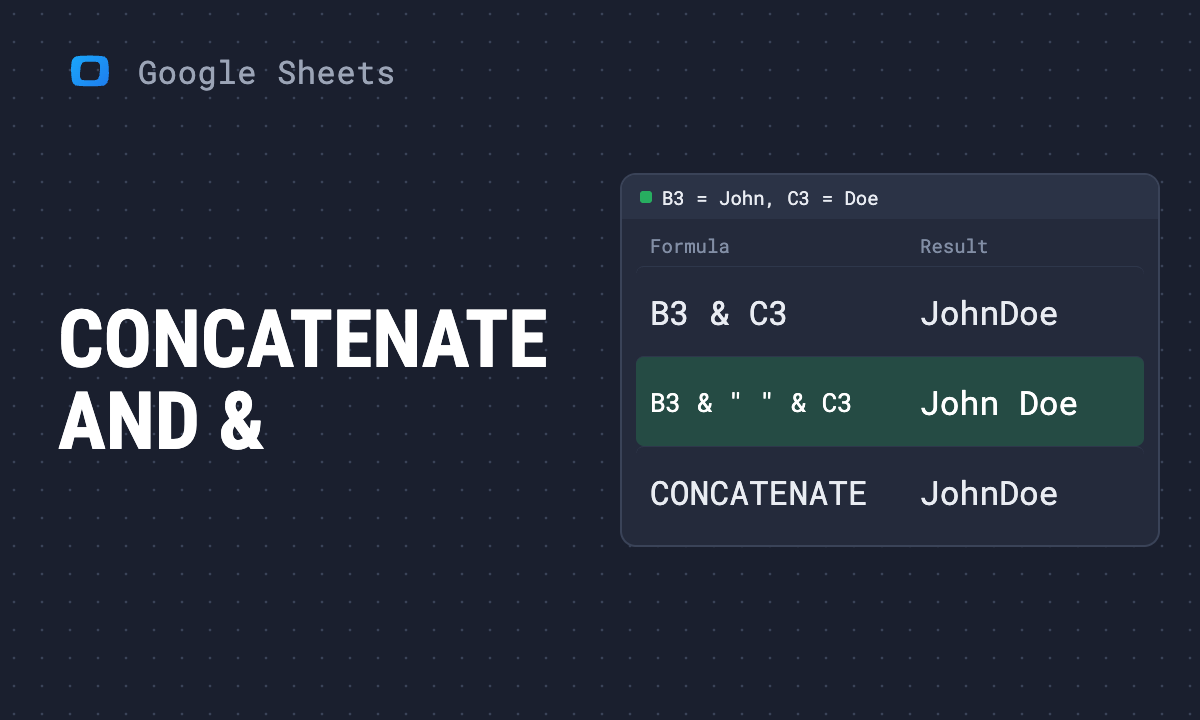 Article · Google Sheets TipsCONCATENATE and & in Google Sheets: combine text from cells
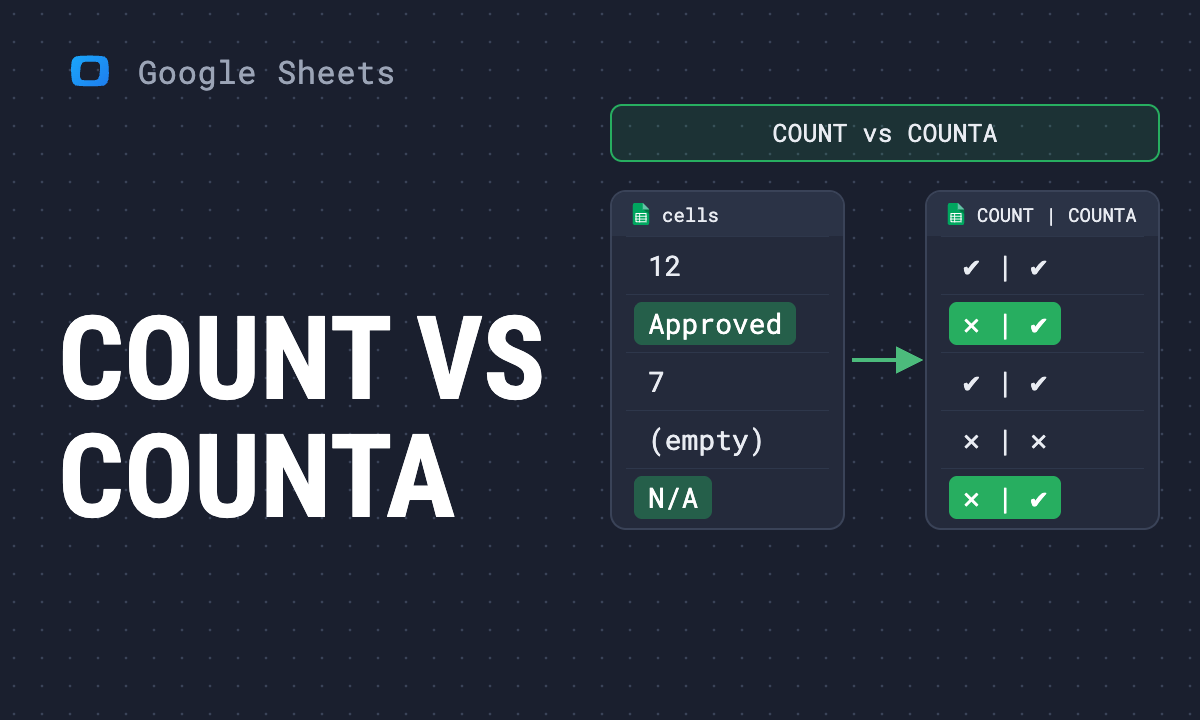 Article · Google Sheets TipsCOUNT and COUNTA in Google Sheets: what each one counts, with examples
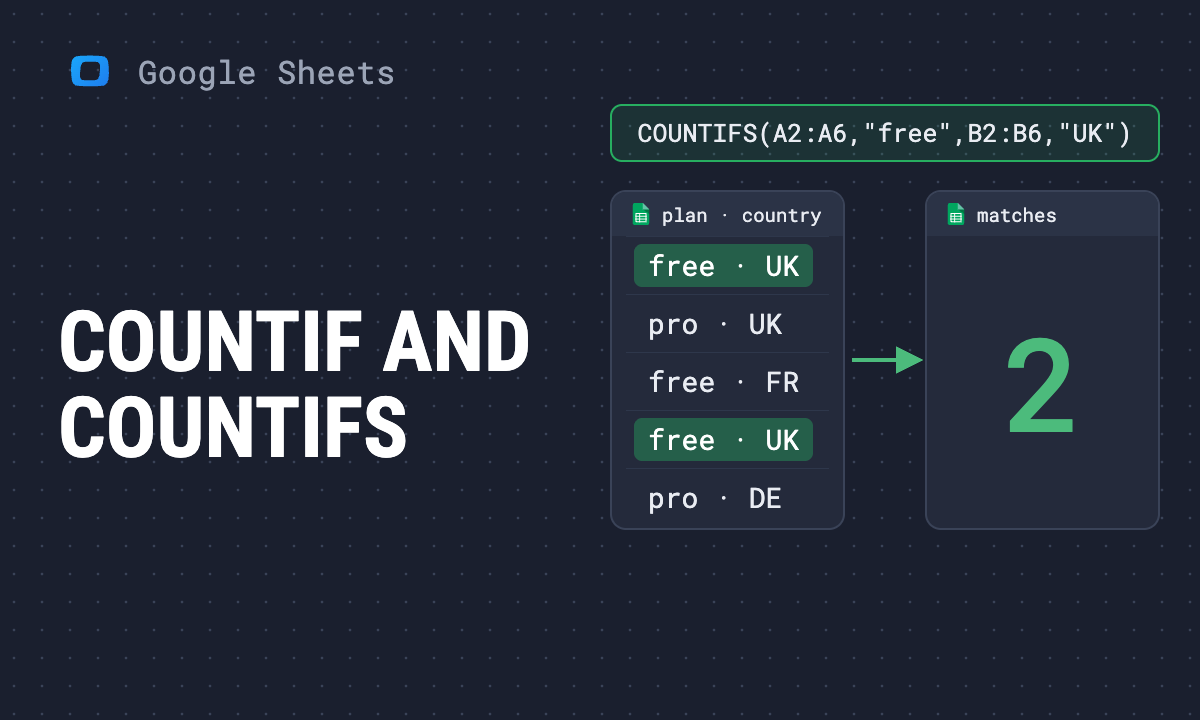 Article · Google Sheets TipsCOUNTIF and COUNTIFS in Google Sheets: criteria and examples
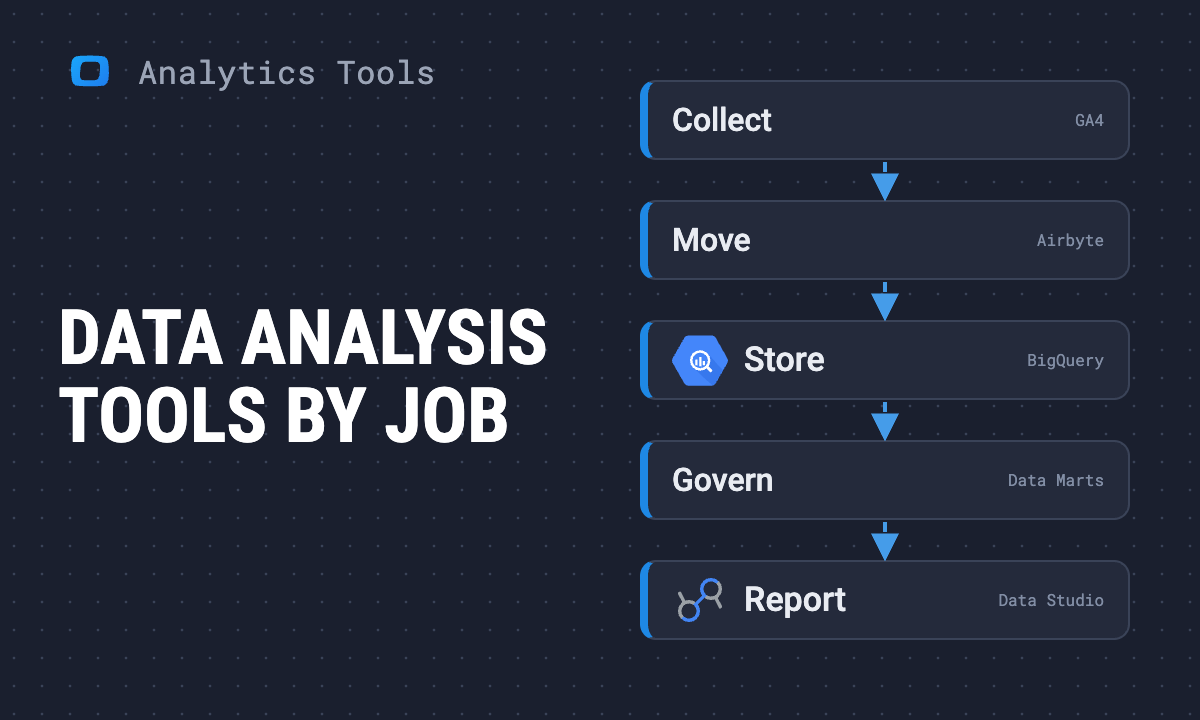 Article · Analytics ToolsData analysis tools in 2026: 19 tools by the job they do
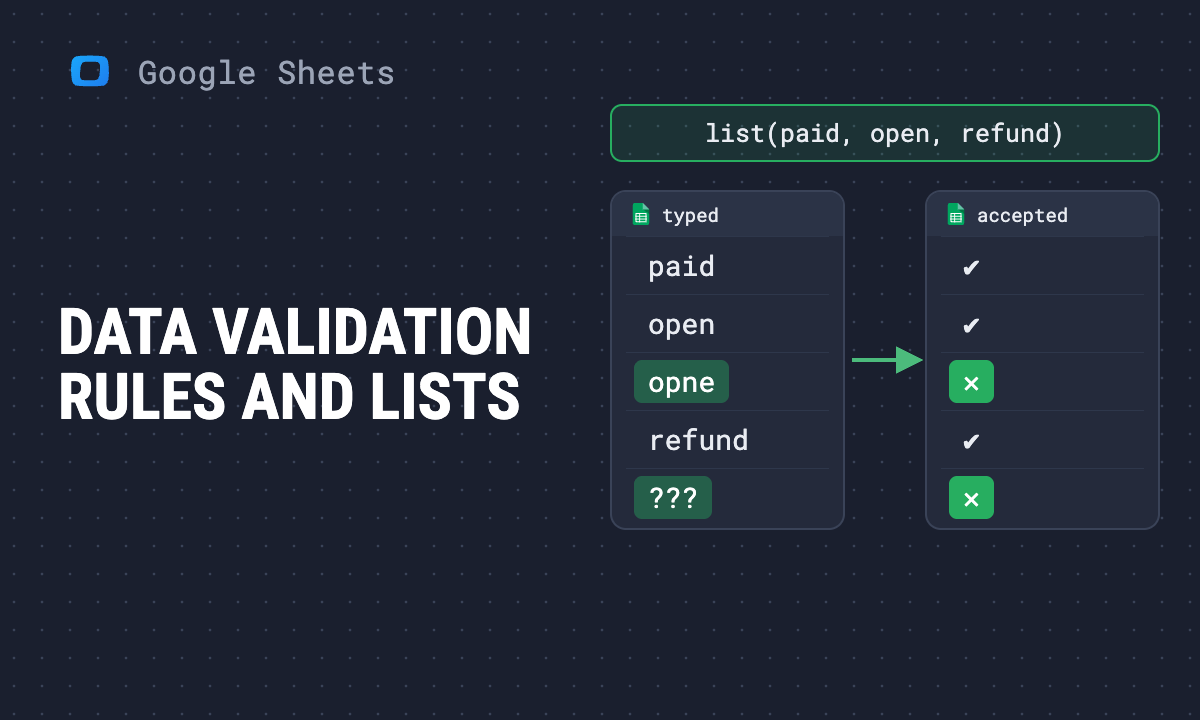 Article · Google Sheets TipsData validation in Google Sheets: rules, drop-down lists and custom formulas
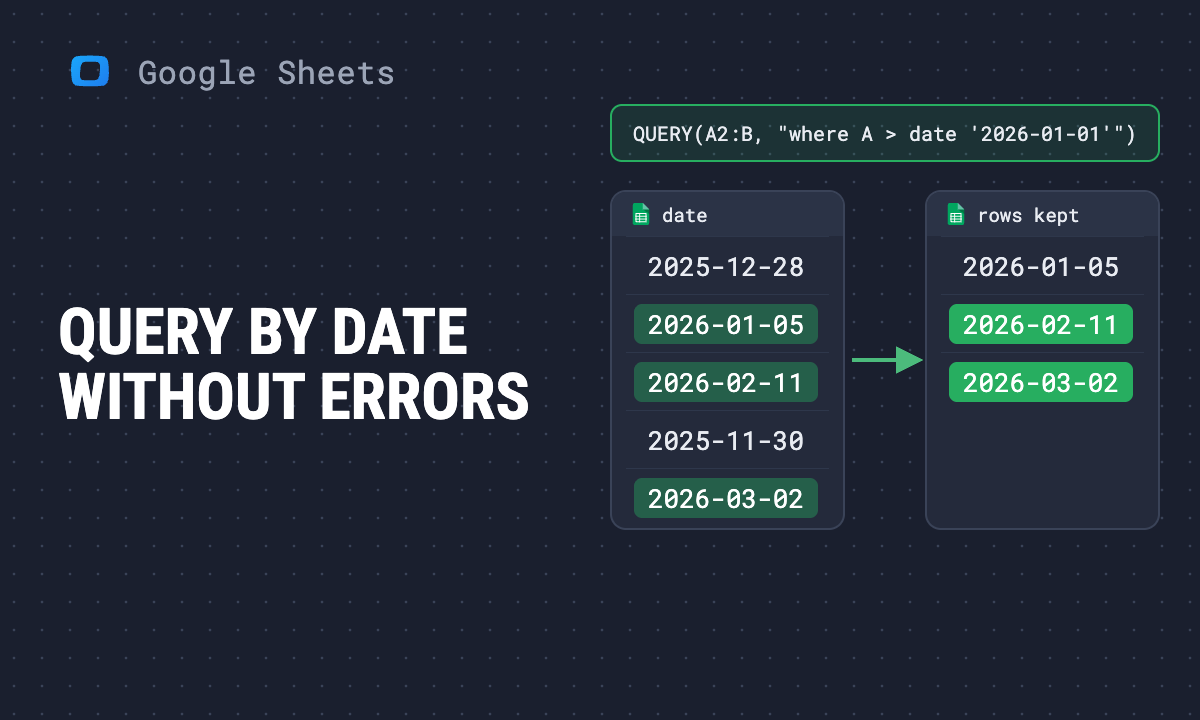 Article · Google Sheets TipsHow to filter by date with QUERY in Google Sheets
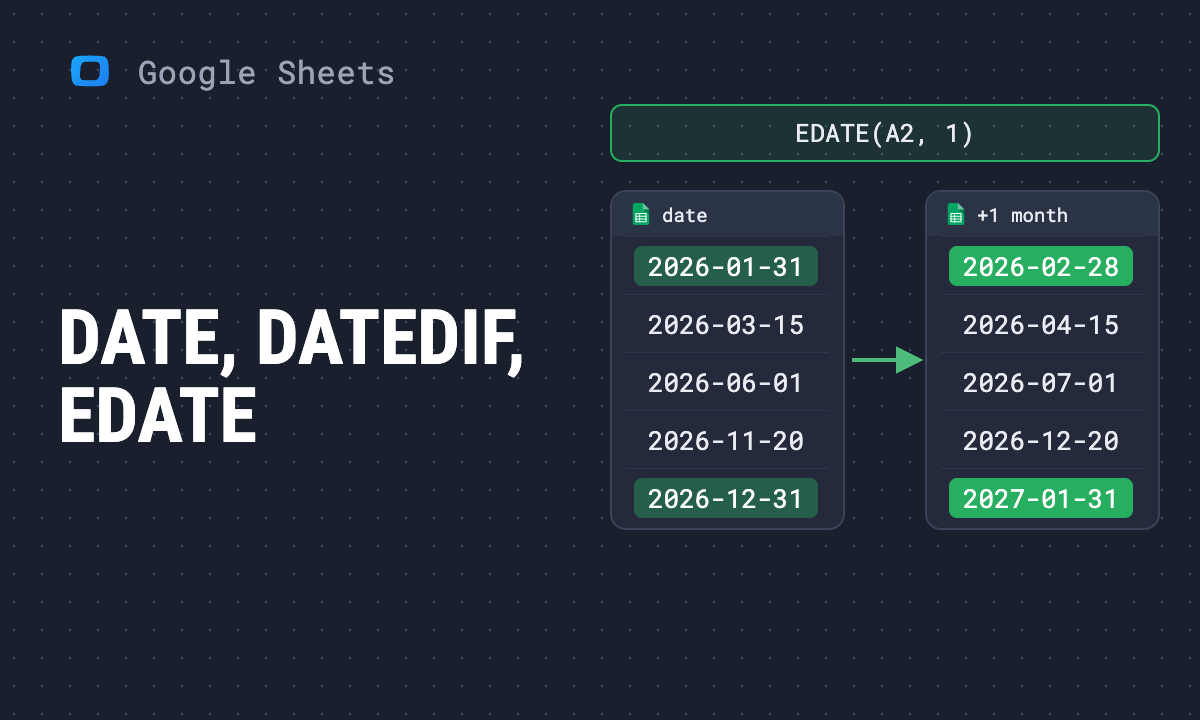 Article · Google Sheets TipsDate functions in Google Sheets: DATE, DATEVALUE, DATEDIF, EDATE and EPOCHTODATE
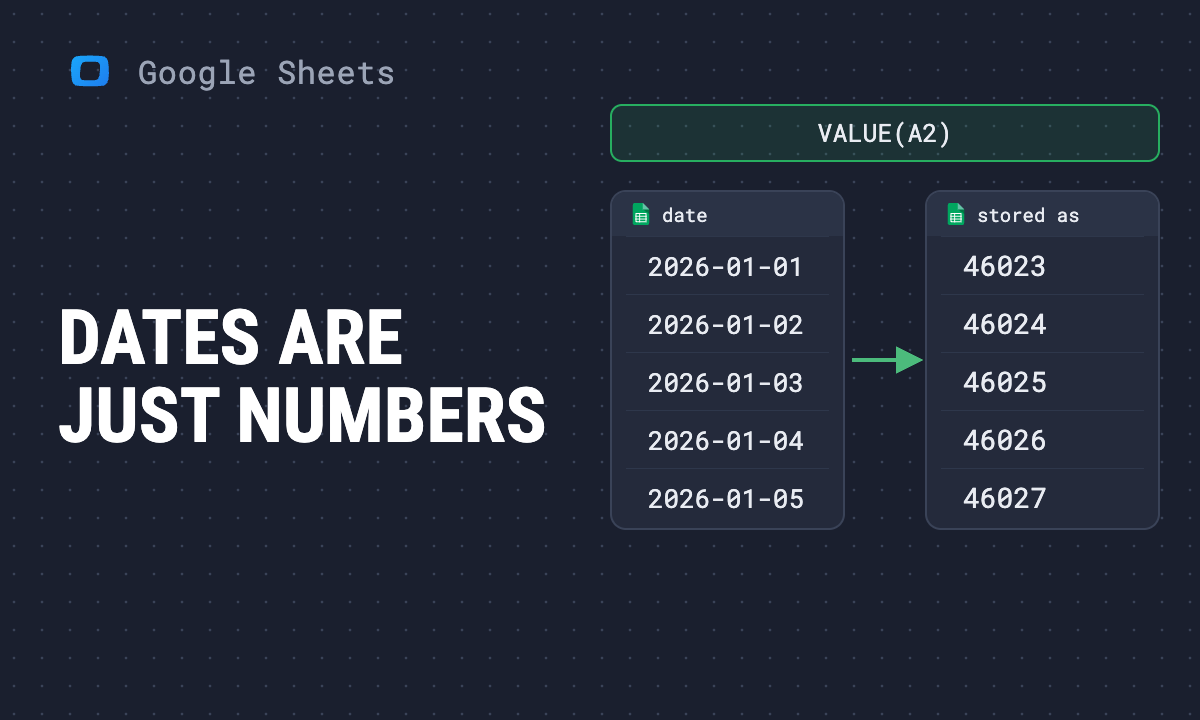 Article · Google Sheets TipsDates and times in Google Sheets: how they work, with formulas
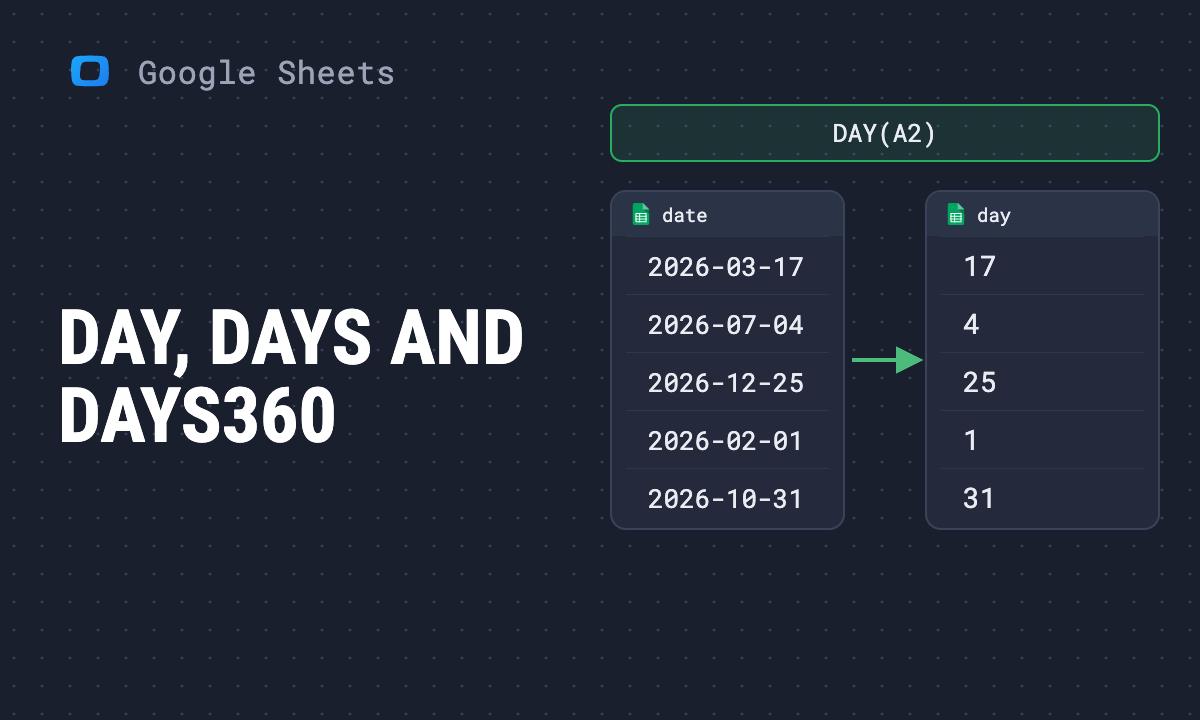 Article · Google Sheets TipsDAY, DAYS and DAYS360 in Google Sheets: formulas and examples
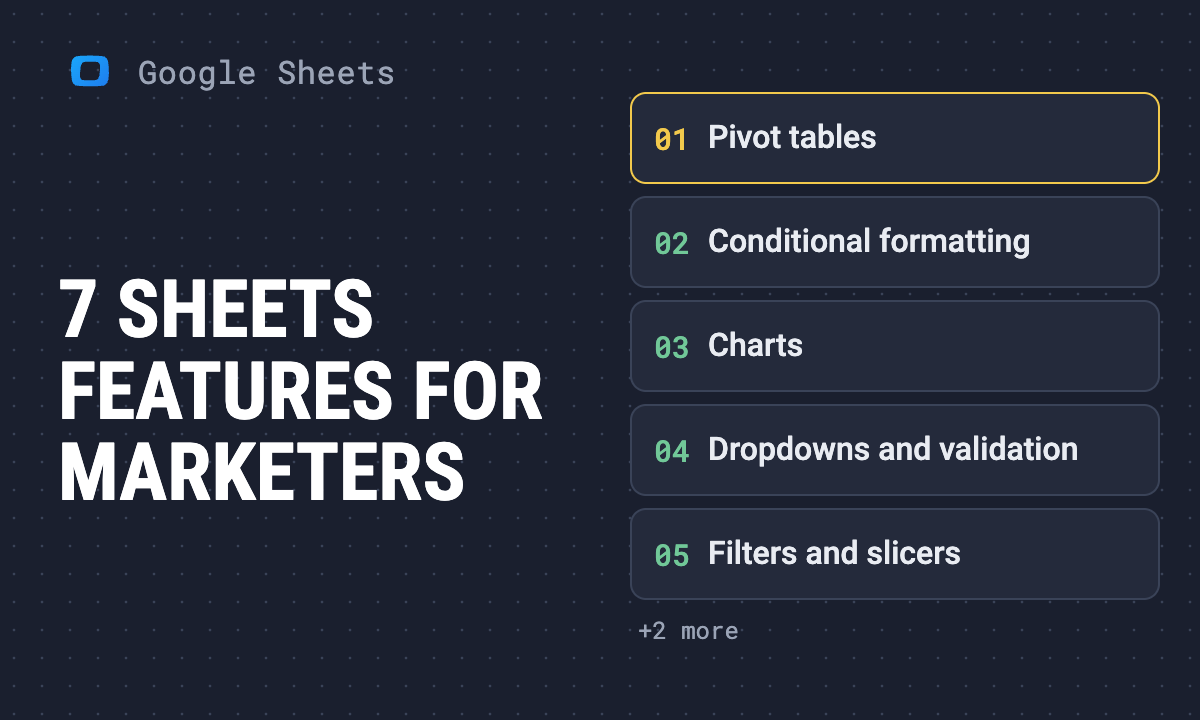 Article · Google Sheets Tips7 Google Sheets features every marketer should know
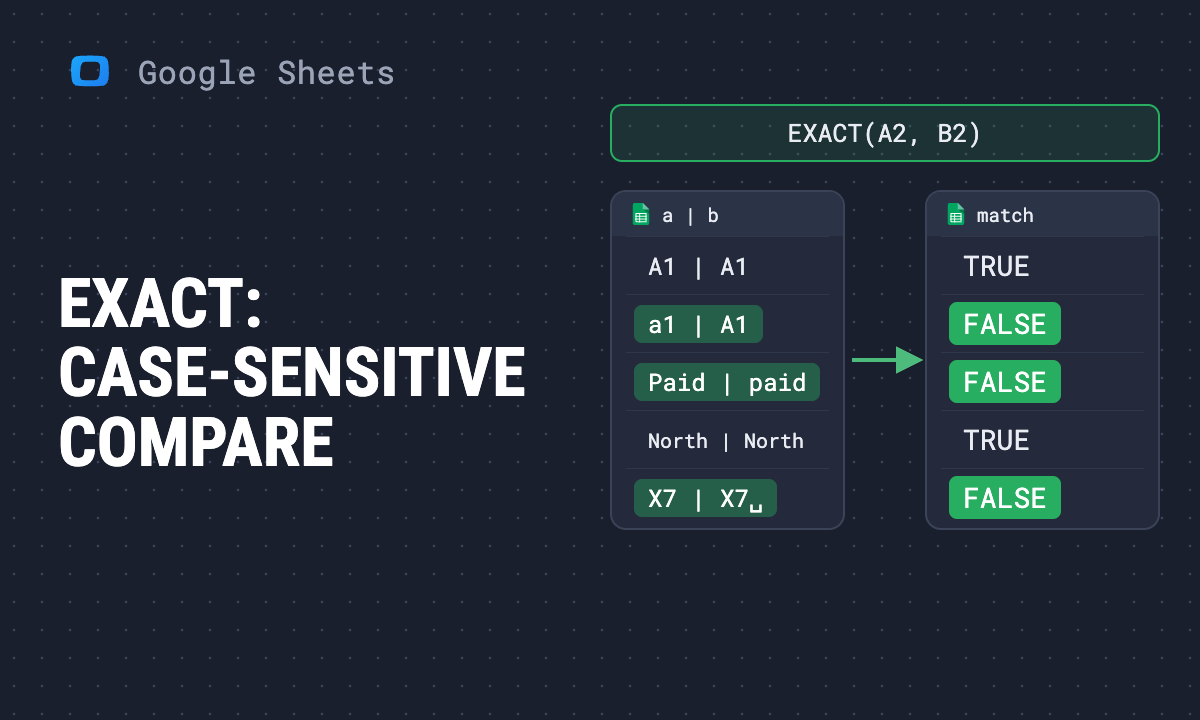 Article · Google Sheets TipsEXACT function in Google Sheets: case-sensitive comparison, lookup and count
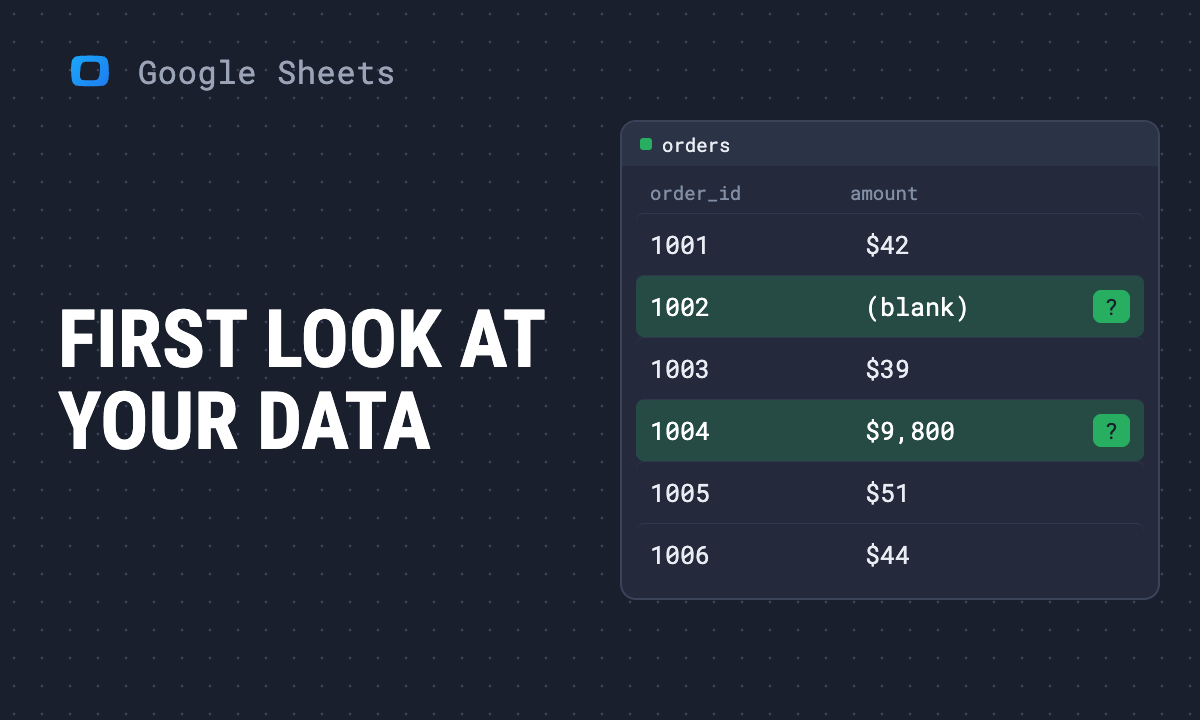 Article · Google Sheets TipsExploratory data analysis in Google Sheets: a step-by-step guide
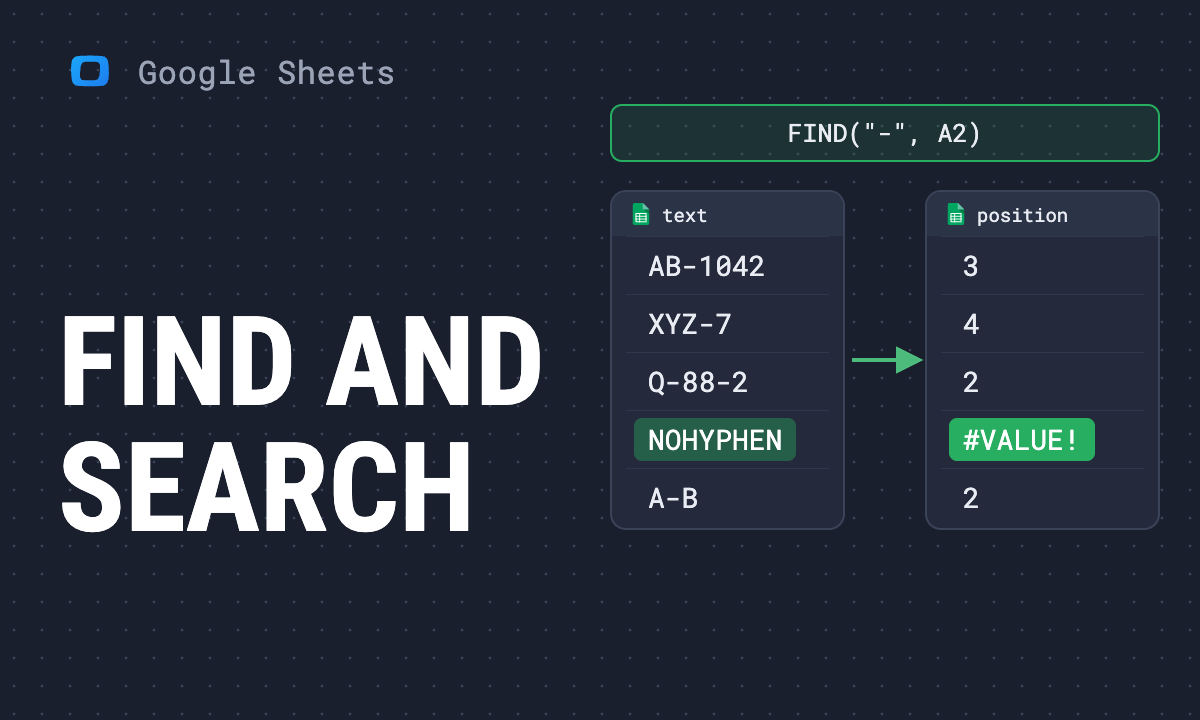 Article · Google Sheets TipsFIND and SEARCH functions in Google Sheets: differences, formulas and examples
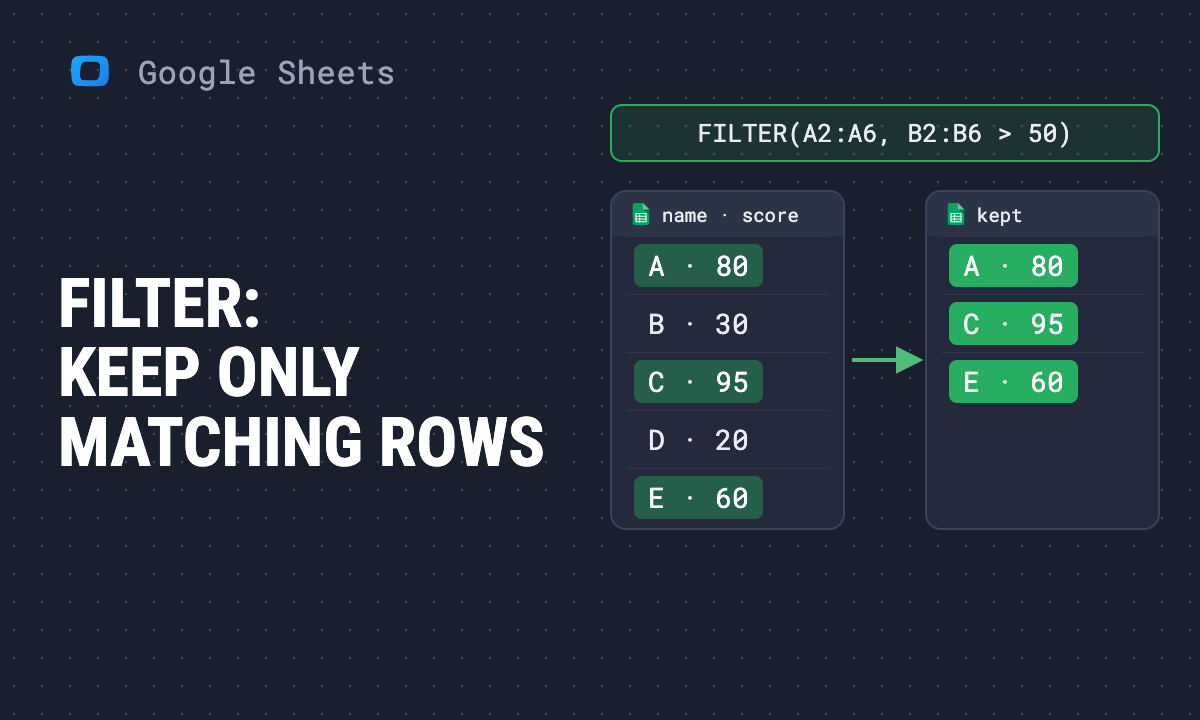 Article · Google Sheets TipsFILTER function in Google Sheets: formula, conditions and examples
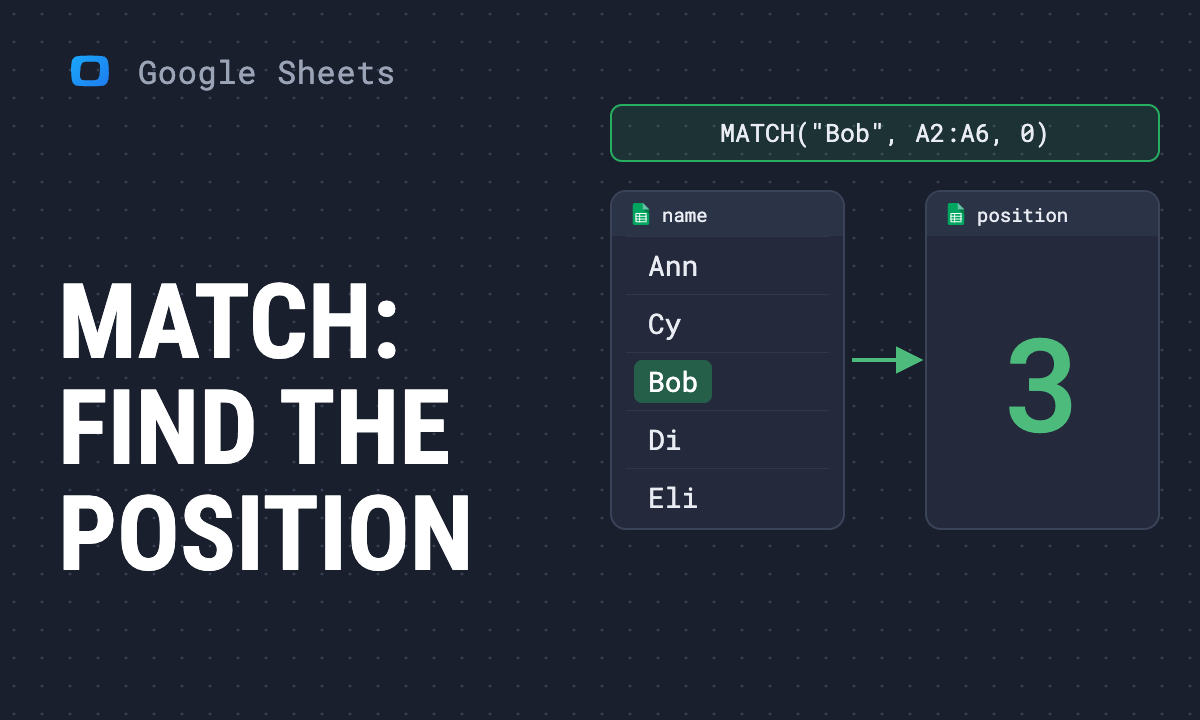 Article · Google Sheets TipsMATCH function in Google Sheets: find the position of a value
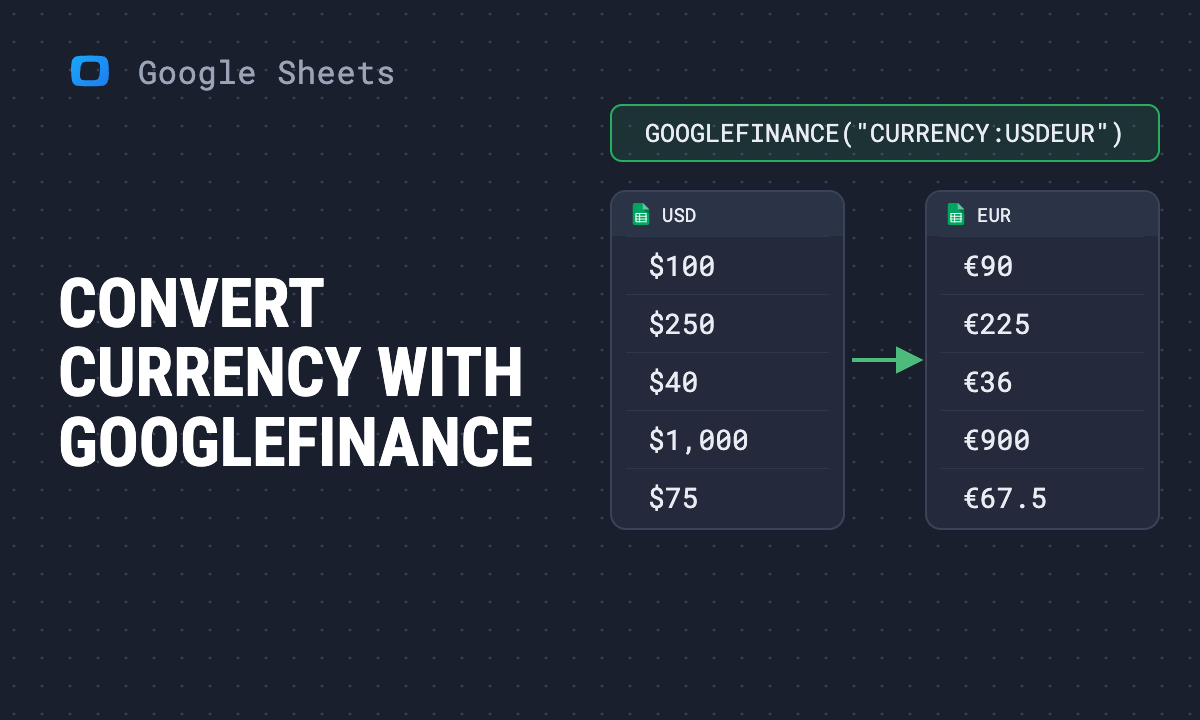 Article · Google Sheets TipsHow to convert currency in Google Sheets using GOOGLEFINANCE
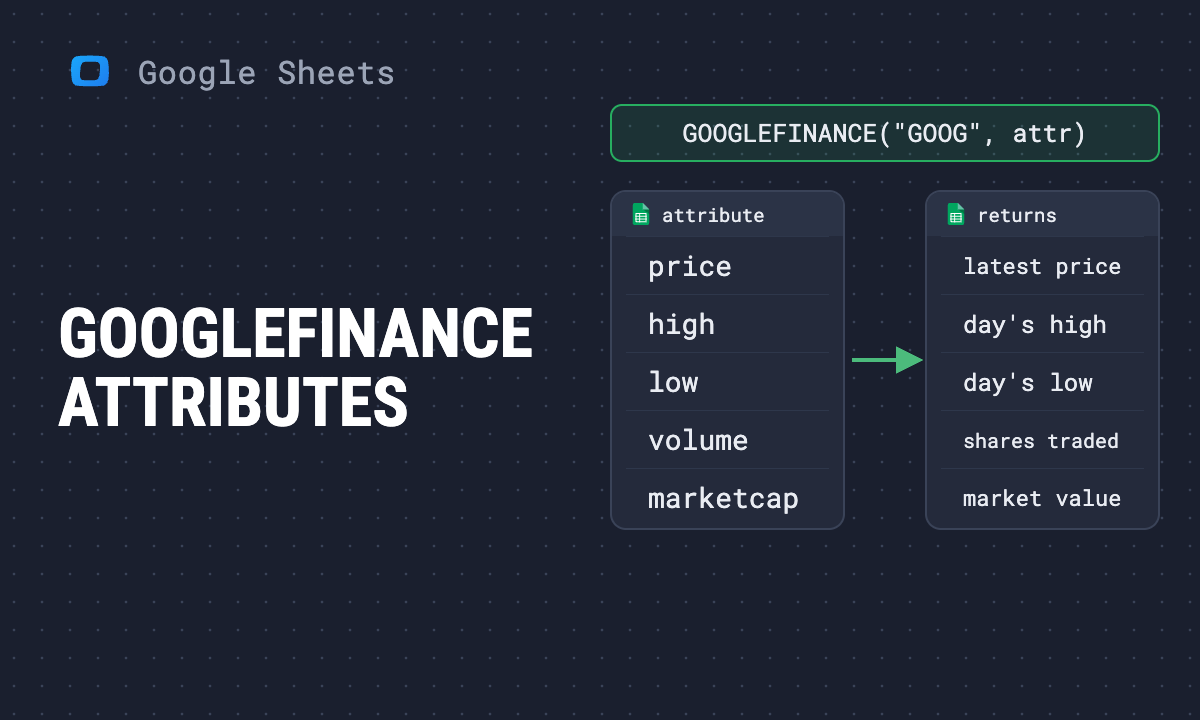 Article · Google Sheets TipsGOOGLEFINANCE function in Google Sheets: syntax, attributes list and examples
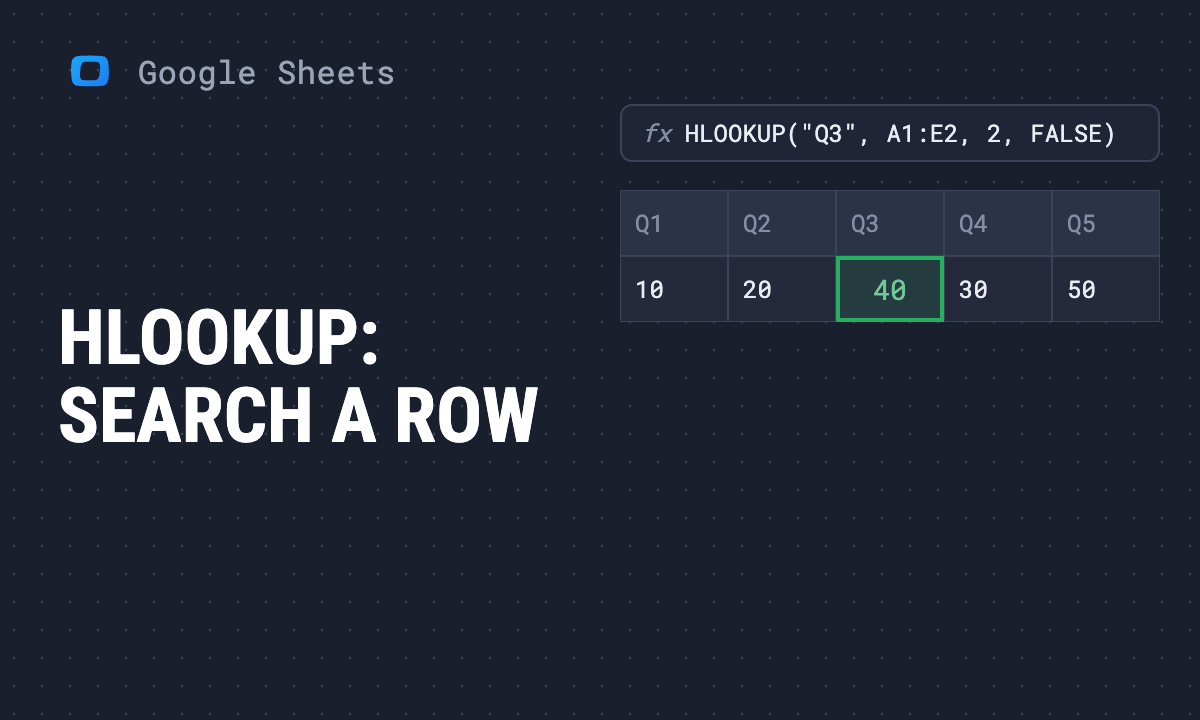 Article · Google Sheets TipsHLOOKUP in Google Sheets: syntax, examples and errors
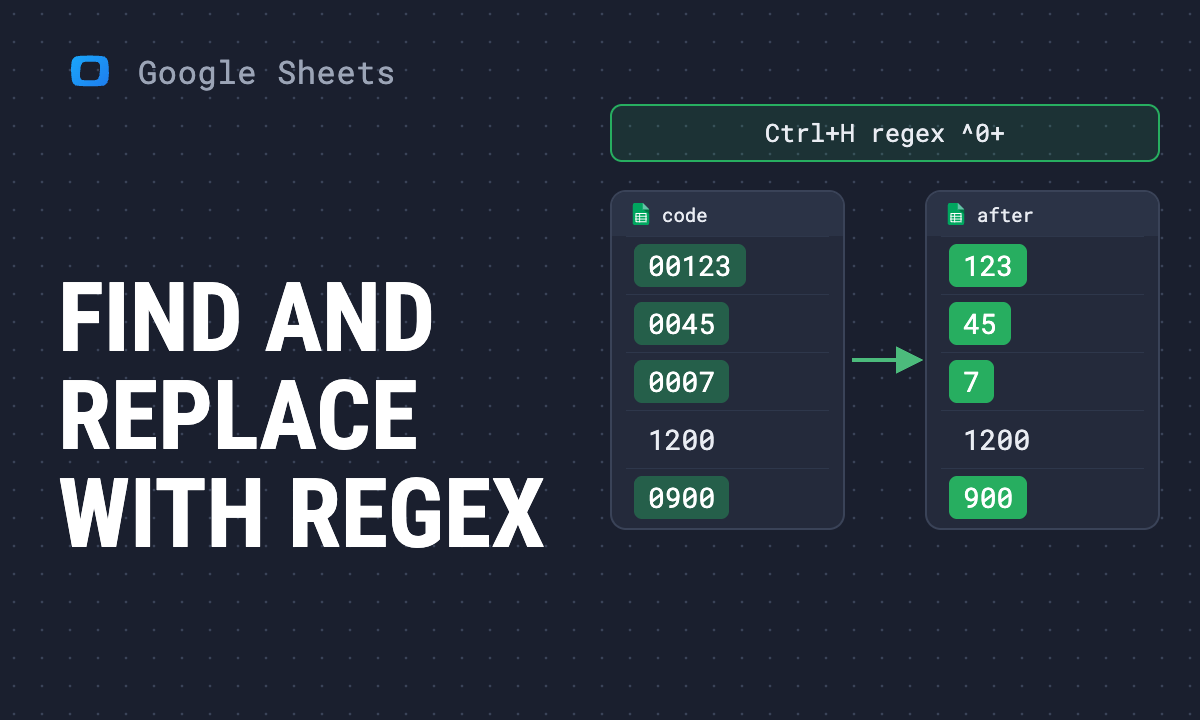 Article · Google Sheets TipsFind and replace in Google Sheets: options, regex and examples
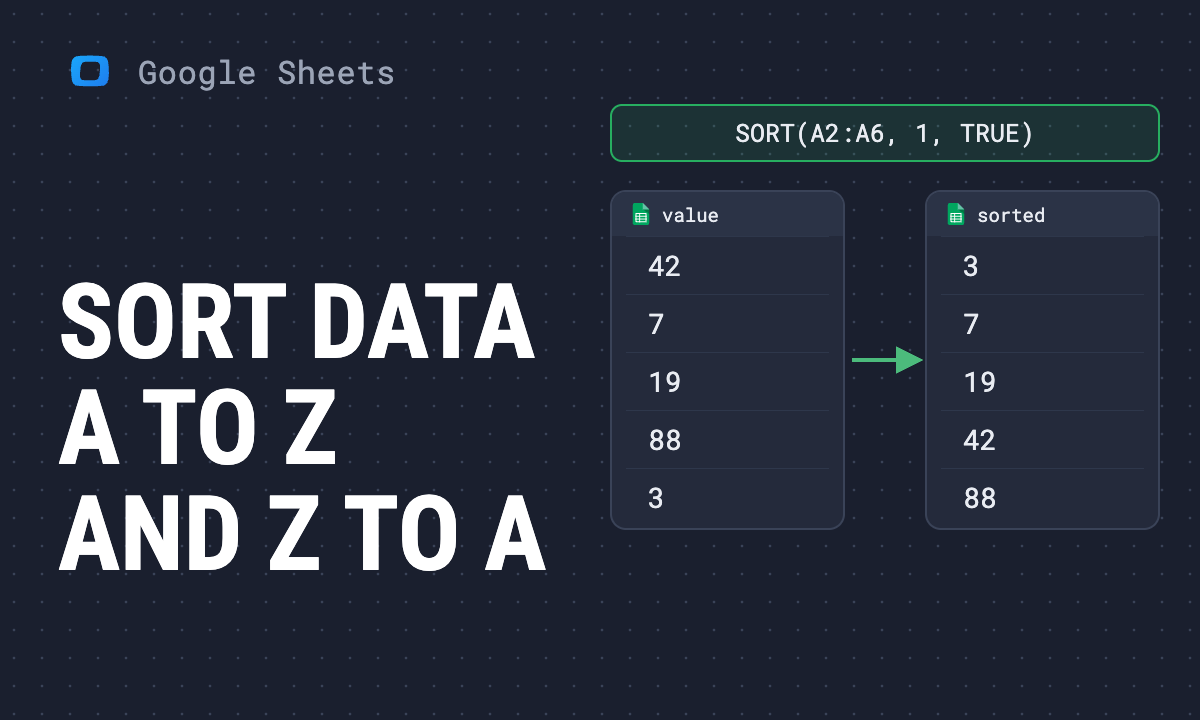 Article · Google Sheets TipsHow to sort data in Google Sheets: by column, by multiple columns, by date and by color
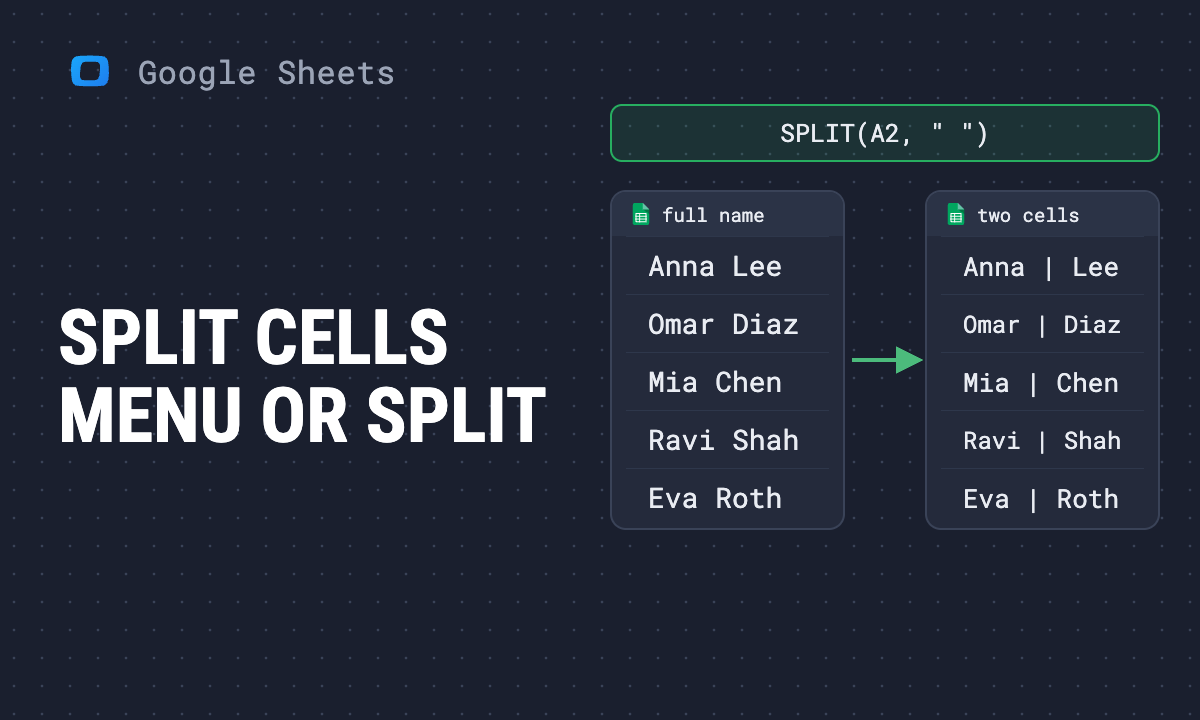 Article · Google Sheets TipsHow to split cells in Google Sheets: Split text to columns and the SPLIT function
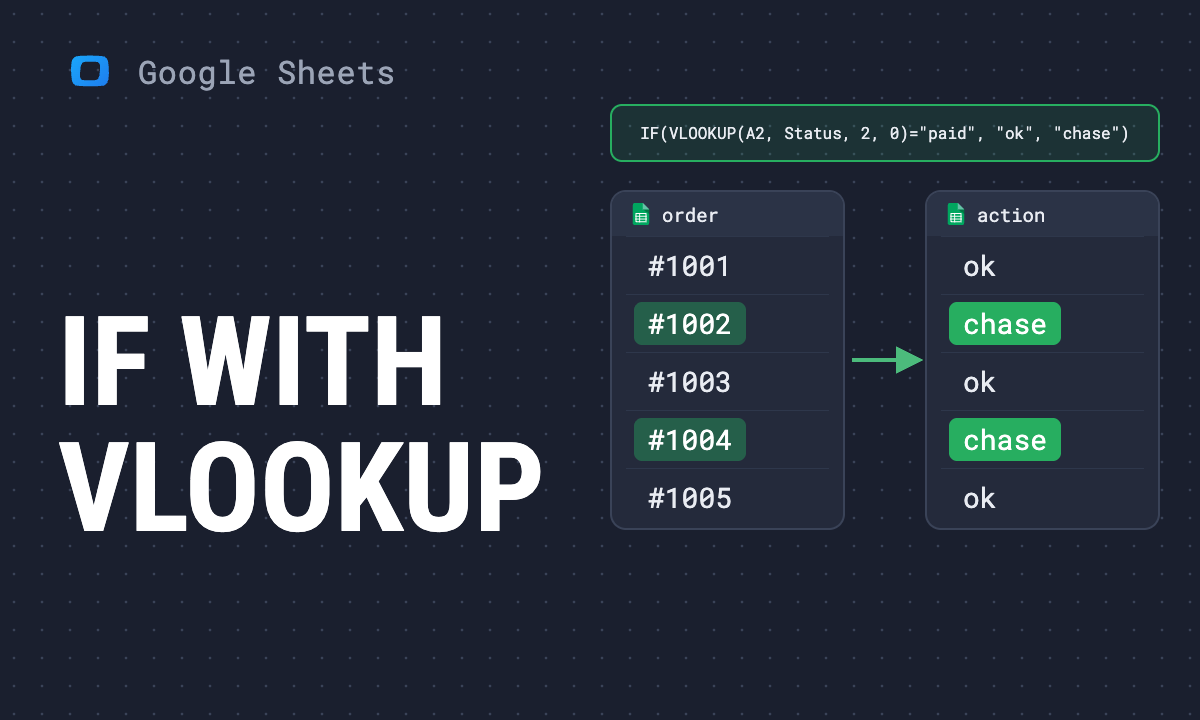 Article · Google Sheets TipsHow to use VLOOKUP with an IF statement in Google Sheets
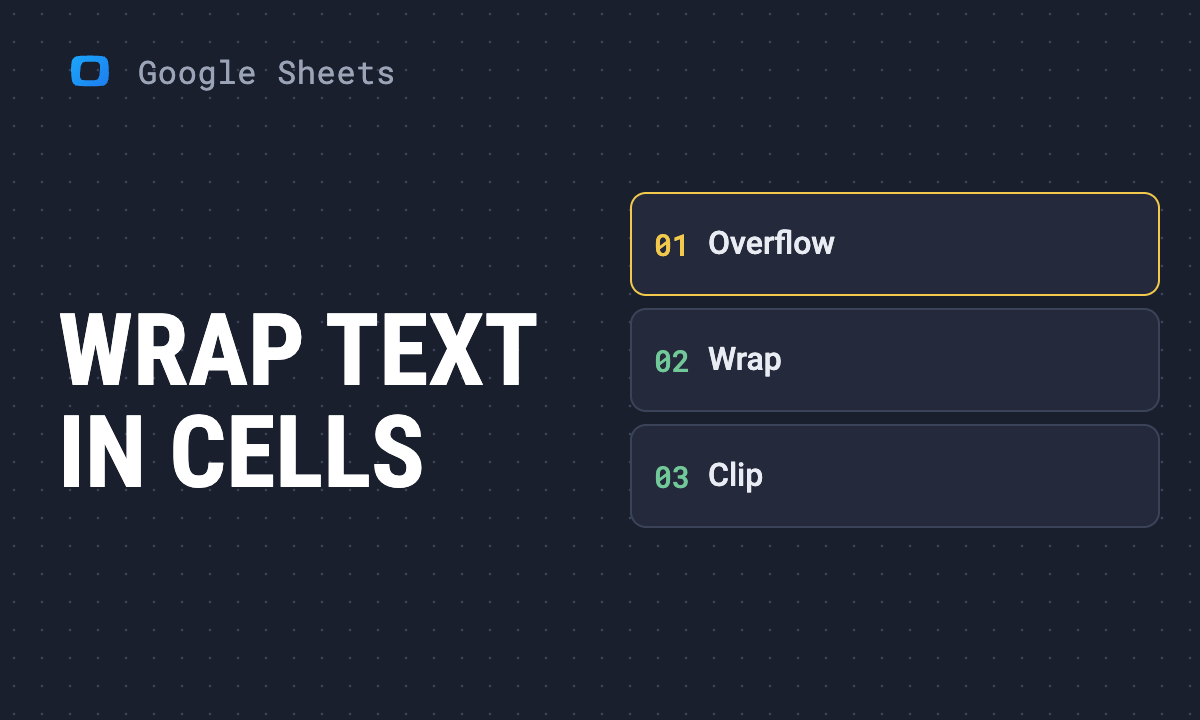 Article · Google Sheets TipsHow to wrap text in Google Sheets: menu, toolbar, line breaks and fixes
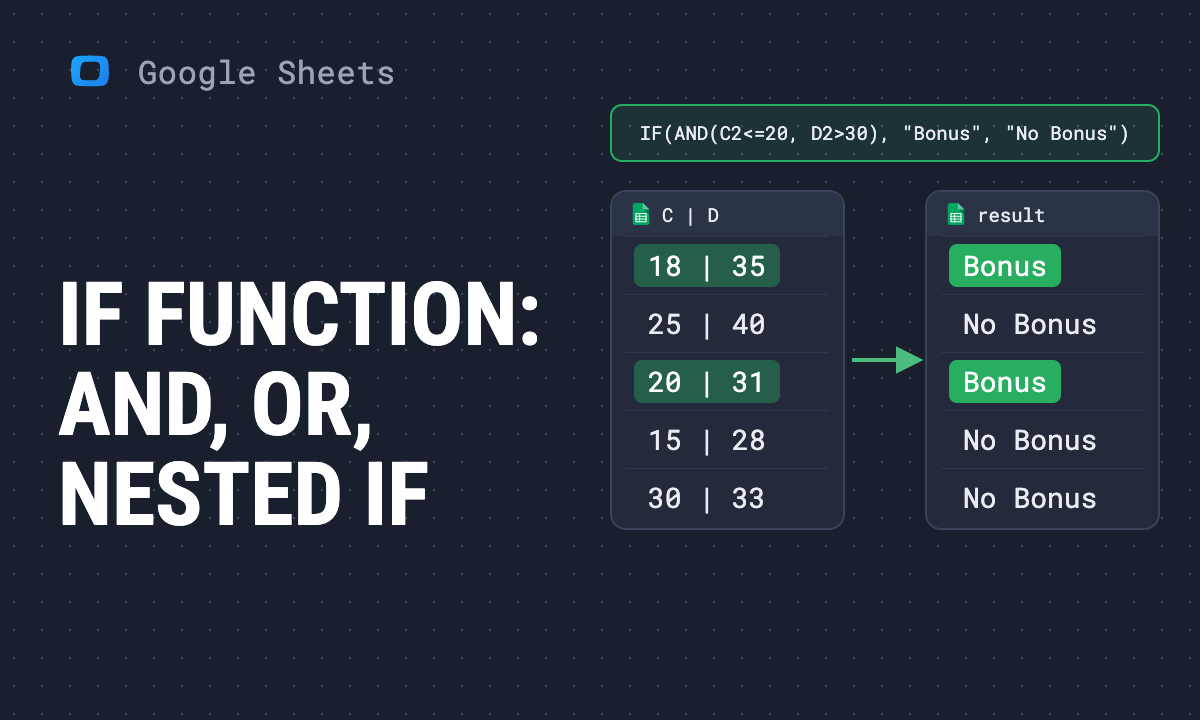 Article · Google Sheets TipsIF function in Google Sheets: formula, IF with AND and OR, nested IF
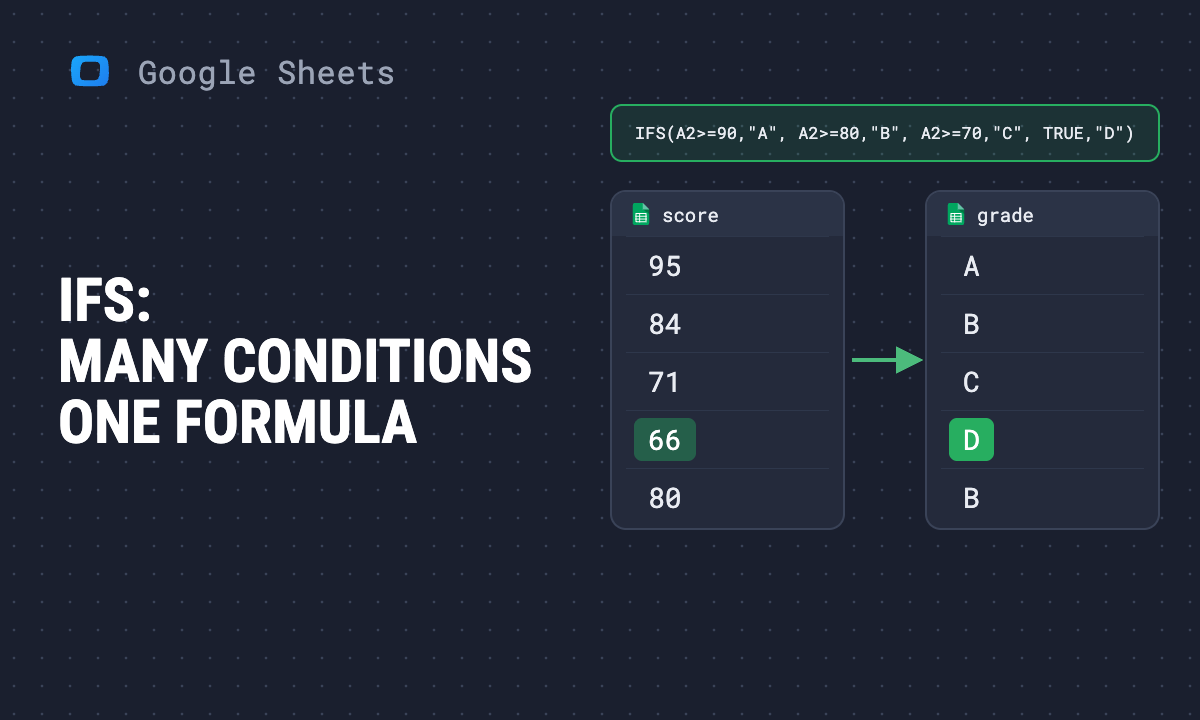 Article · Google Sheets TipsIFS function in Google Sheets: several conditions in one formula
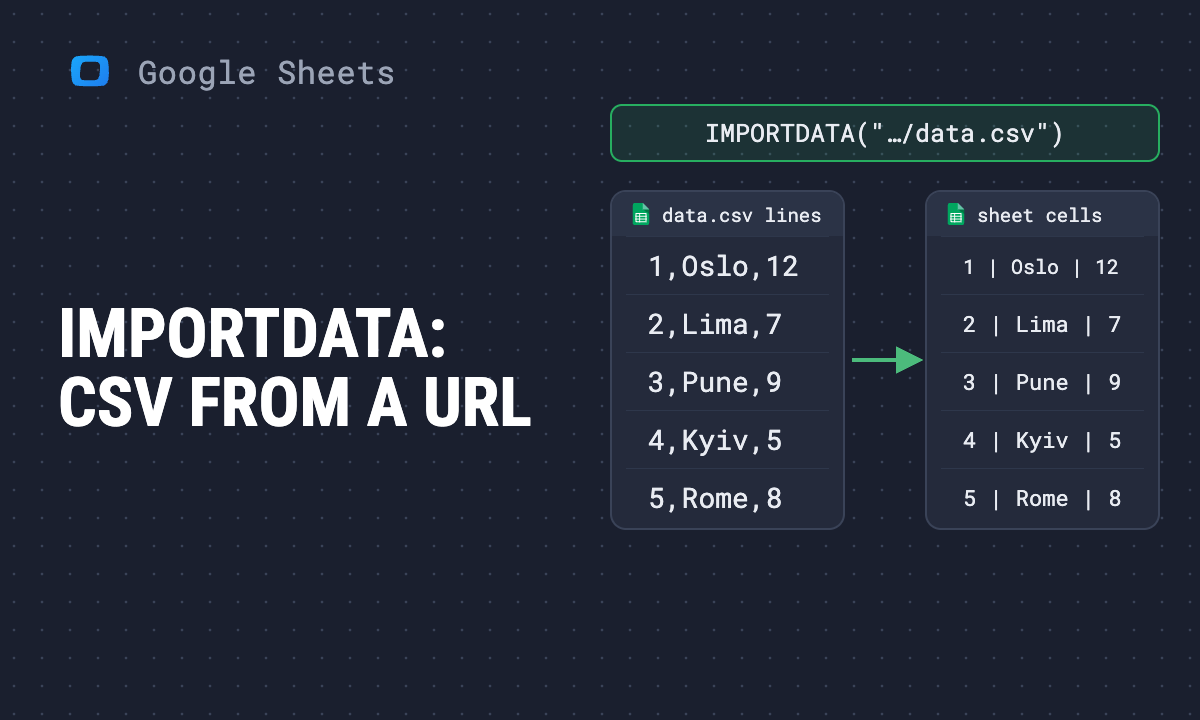 Article · Google Sheets TipsIMPORTDATA function in Google Sheets: import a CSV or TSV file from a URL
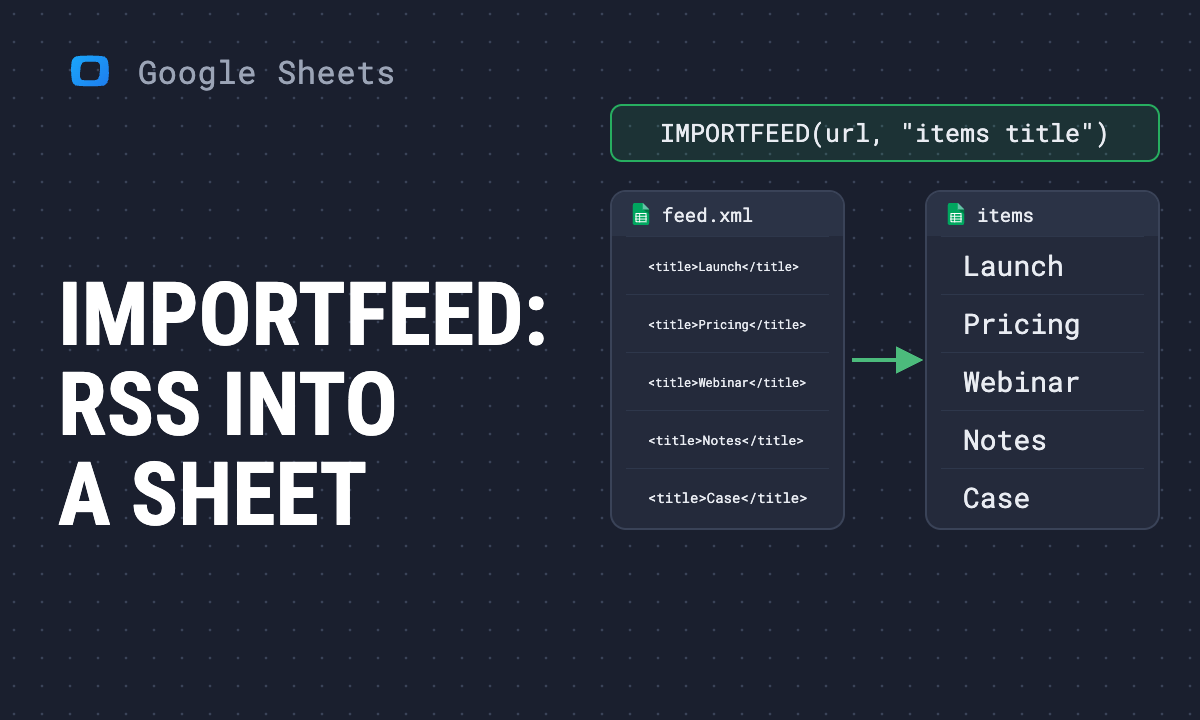 Article · Google Sheets TipsIMPORTFEED function in Google Sheets: import an RSS or Atom feed
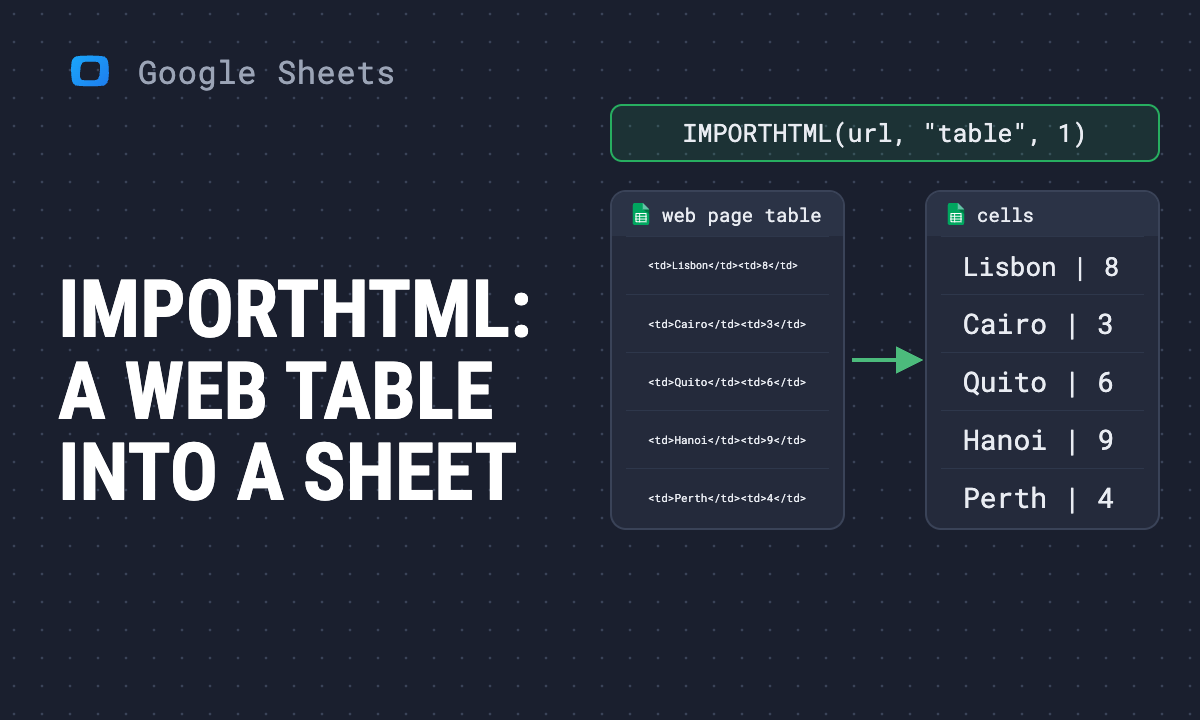 Article · Google Sheets TipsIMPORTHTML function in Google Sheets: import a table or a list from a web page
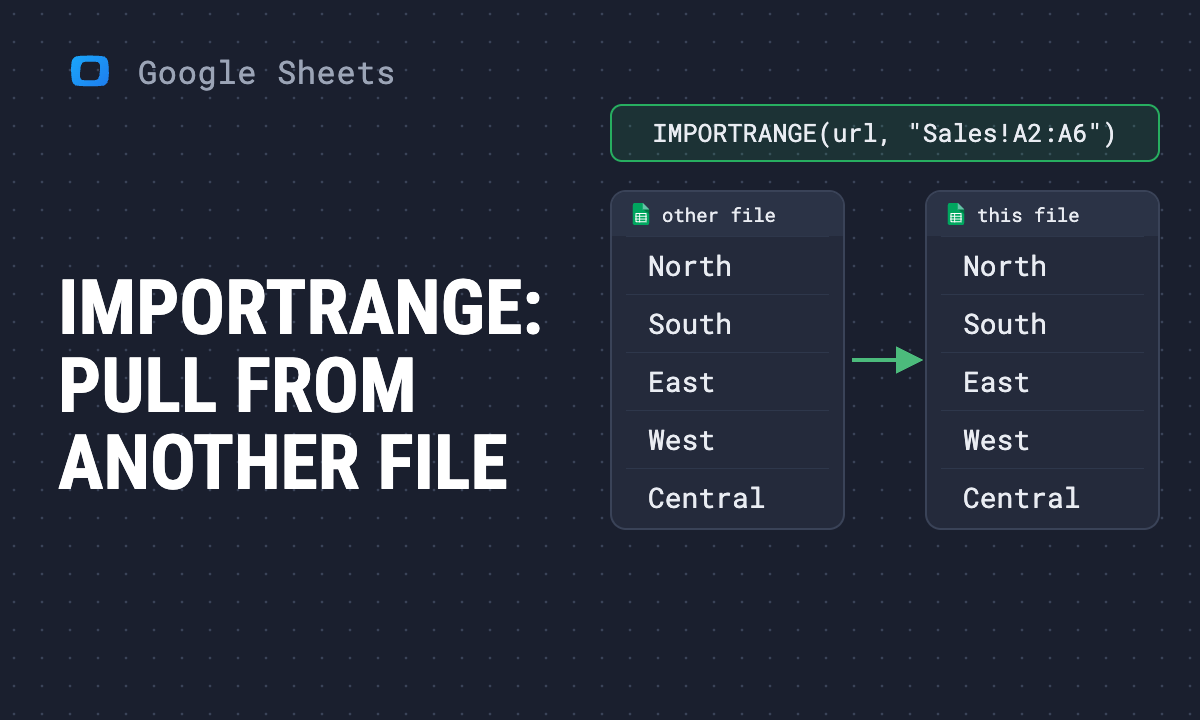 Article · Google Sheets TipsIMPORTRANGE in Google Sheets: formula, multiple ranges, examples and errors
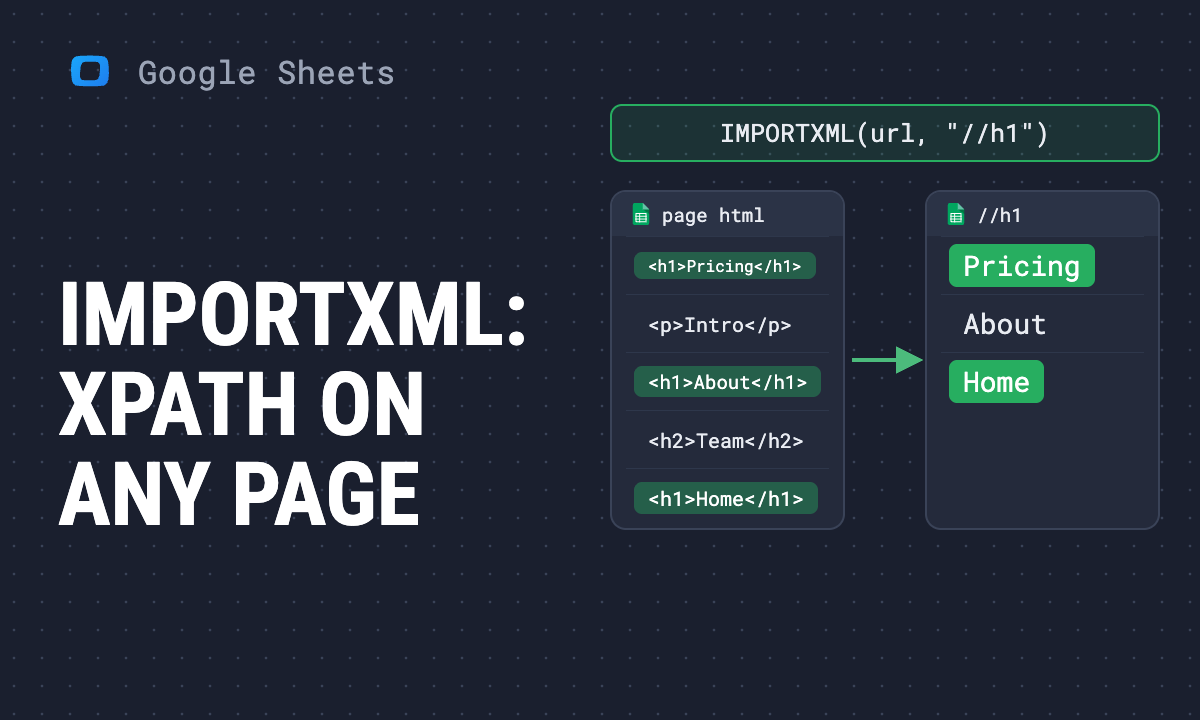 Article · Google Sheets TipsIMPORTXML in Google Sheets: syntax, XPath examples and errors
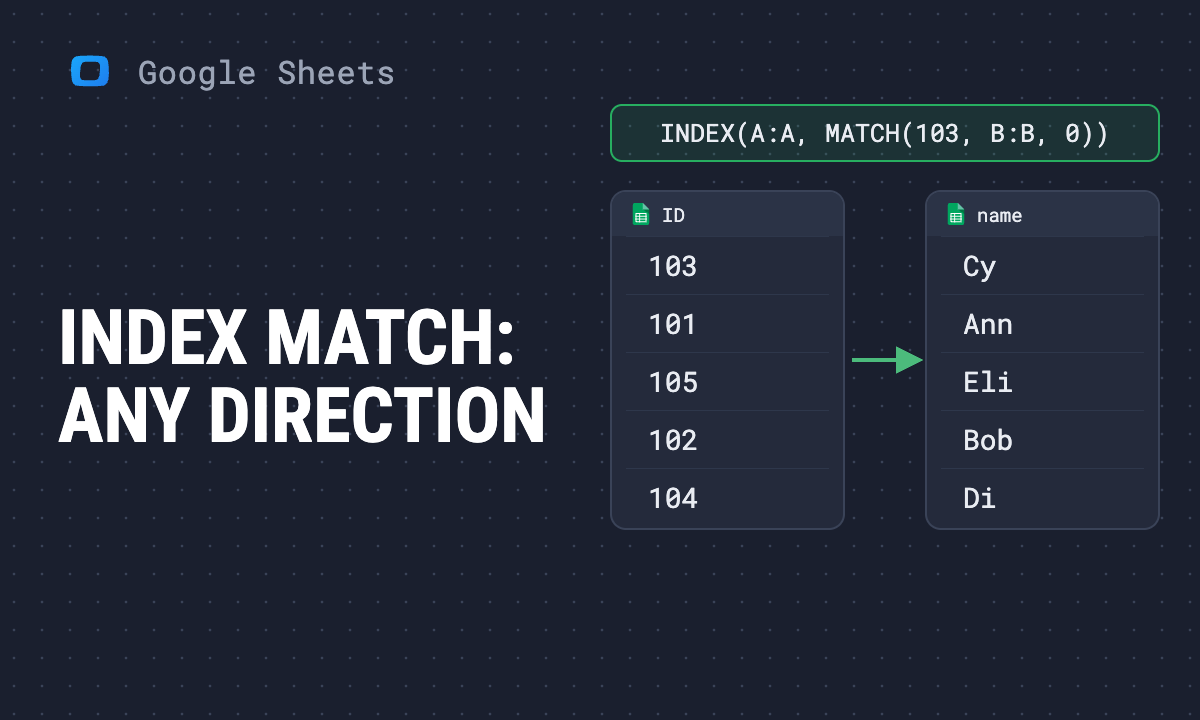 Article · Google Sheets TipsHow to use INDEX MATCH in Google Sheets: formula, examples and errors
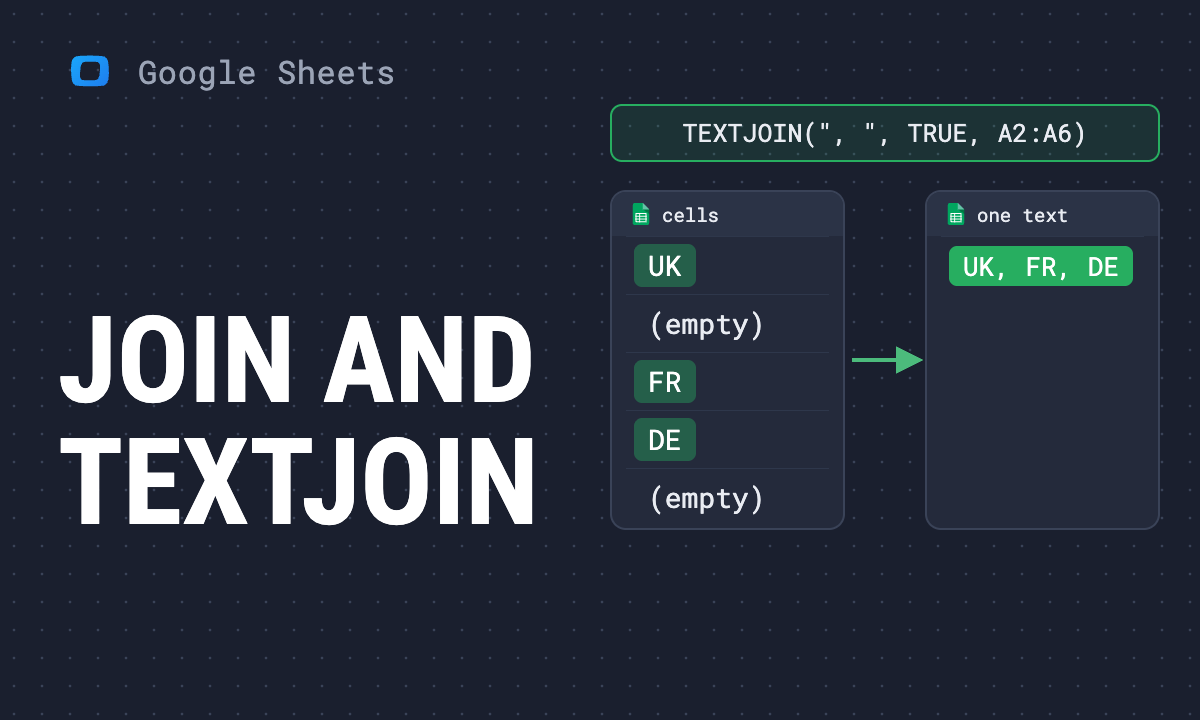 Article · Google Sheets TipsJOIN and TEXTJOIN in Google Sheets: join a range into one cell
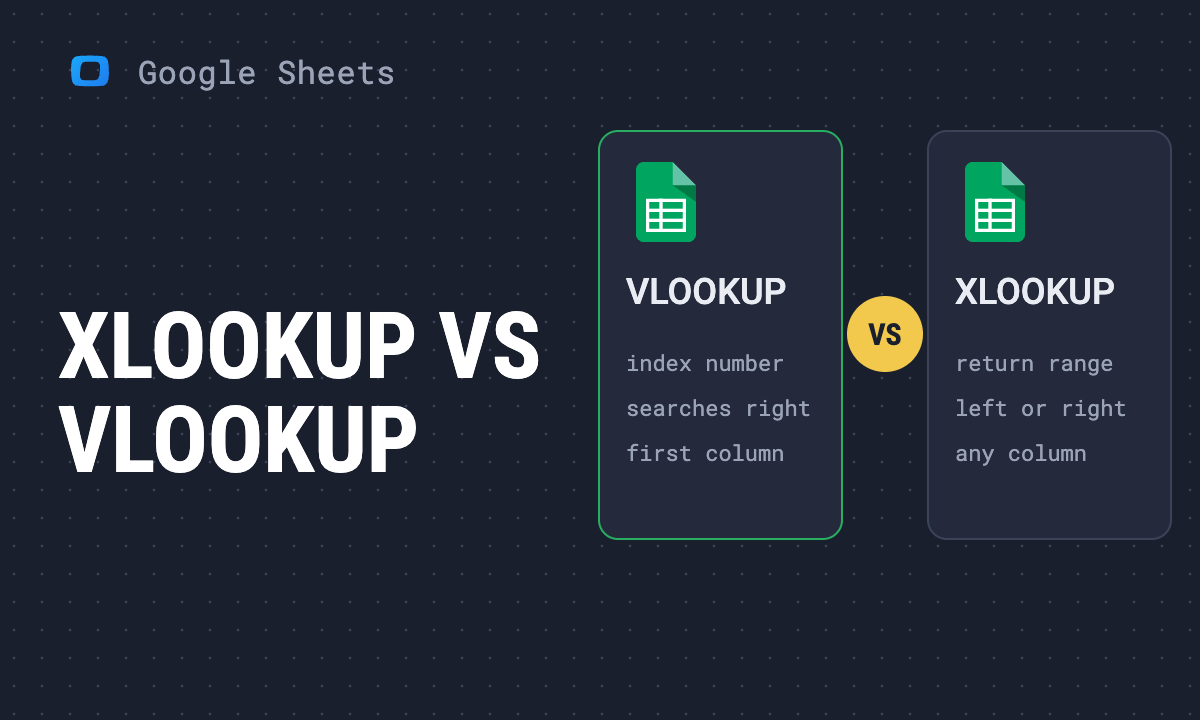 Article · Google Sheets TipsXLOOKUP vs VLOOKUP in Google Sheets: the key differences
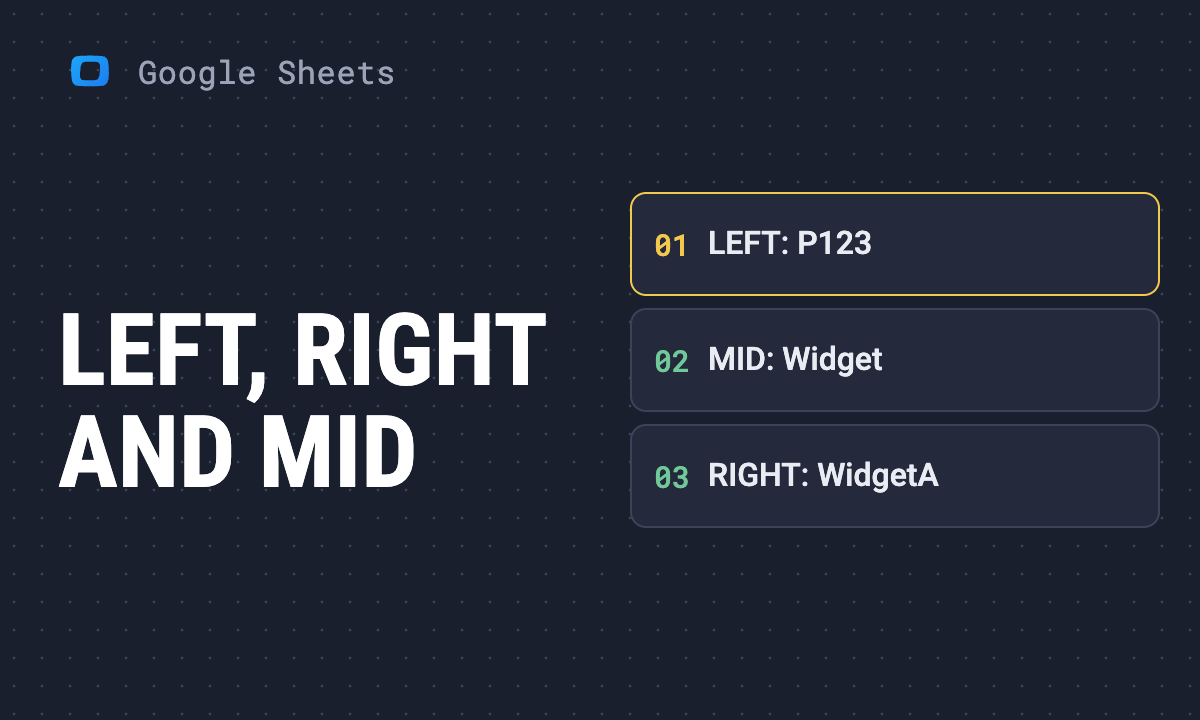 Article · Google Sheets TipsLEFT, RIGHT and MID in Google Sheets: extract part of a text
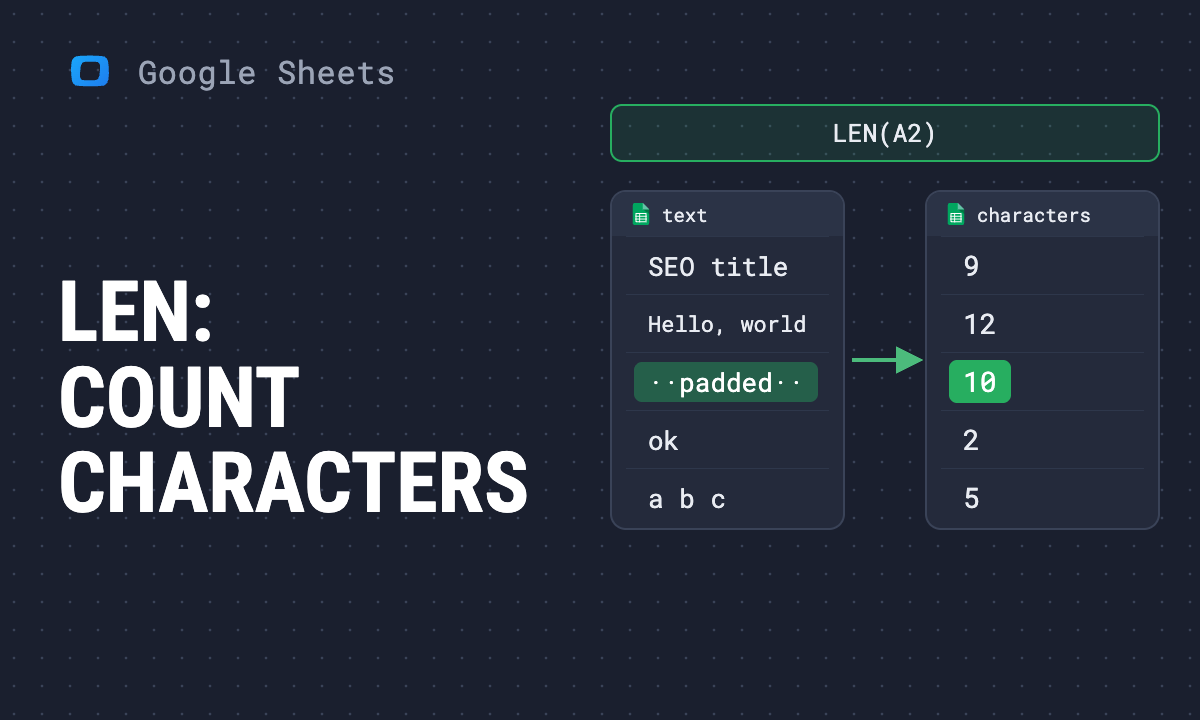 Article · Google Sheets TipsLEN function in Google Sheets: count characters in a cell
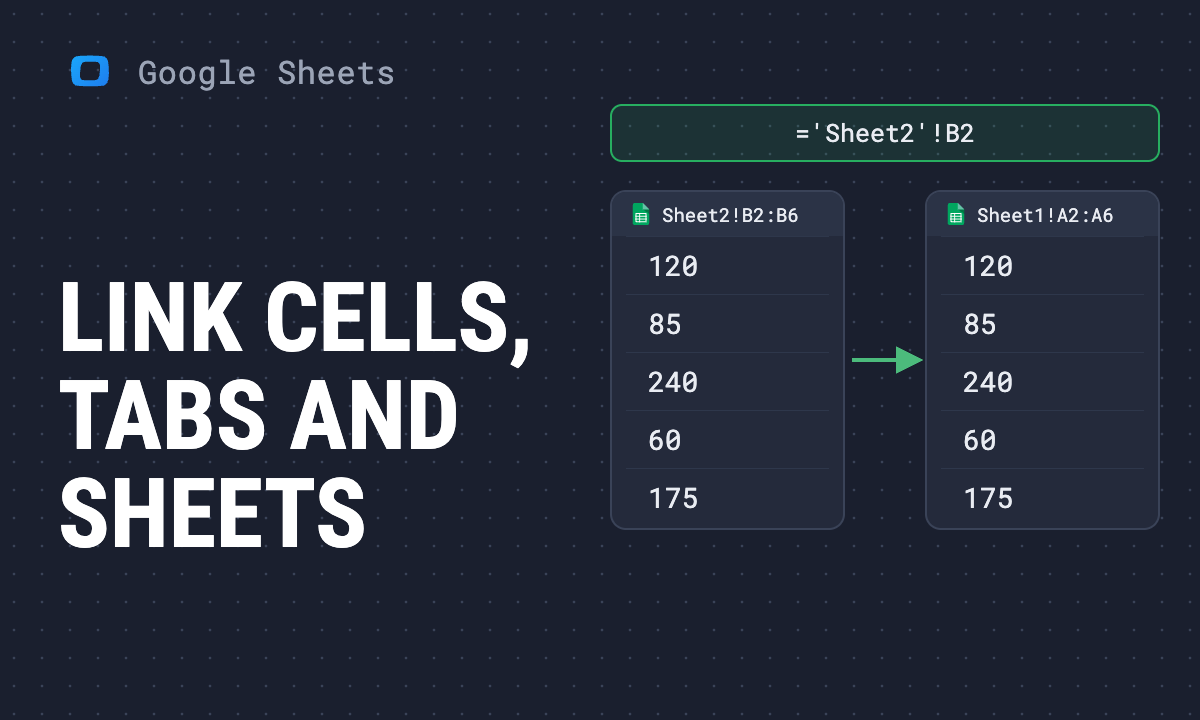 Article · Google Sheets TipsHow to link cells, tabs and spreadsheets in Google Sheets
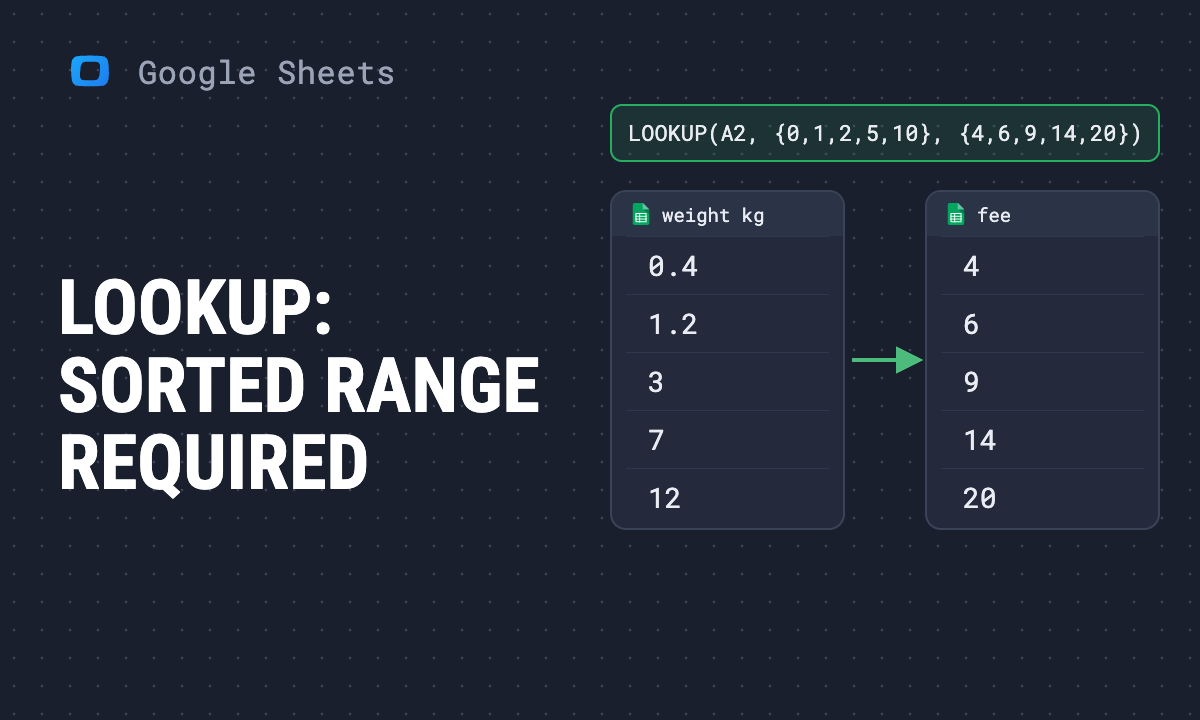 Article · Google Sheets TipsLOOKUP function in Google Sheets: syntax, examples and when to use another lookup
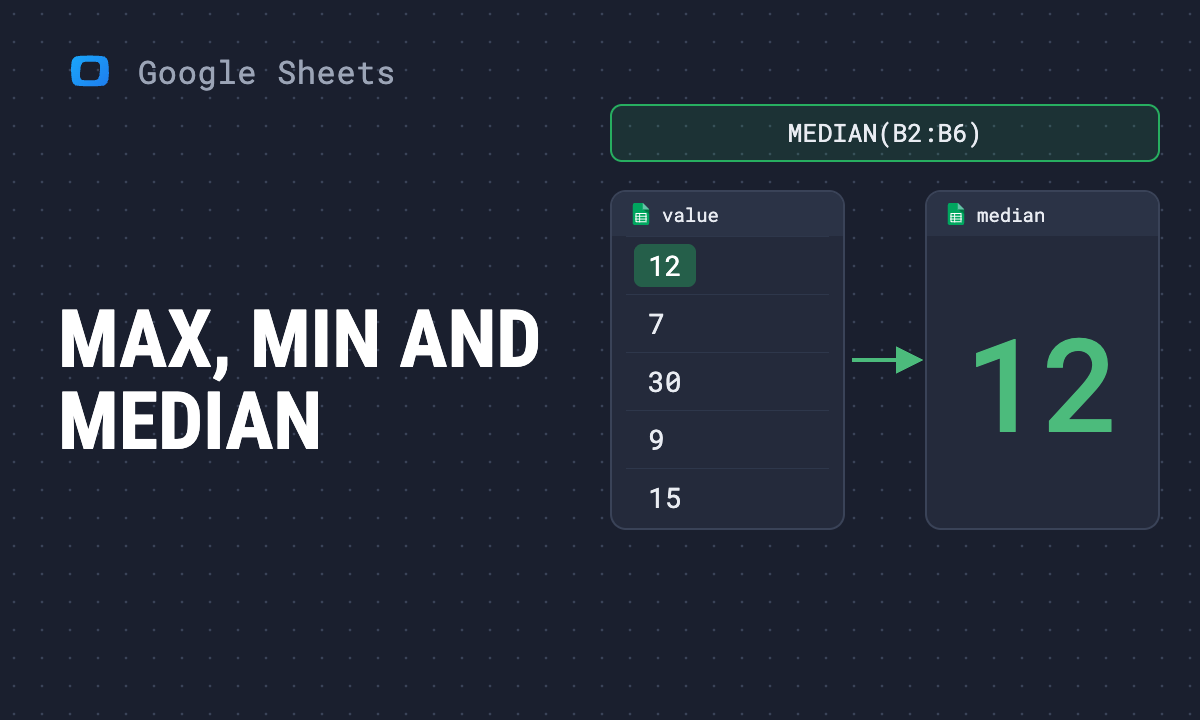 Article · Google Sheets TipsMAX, MIN and MEDIAN in Google Sheets: formulas and examples
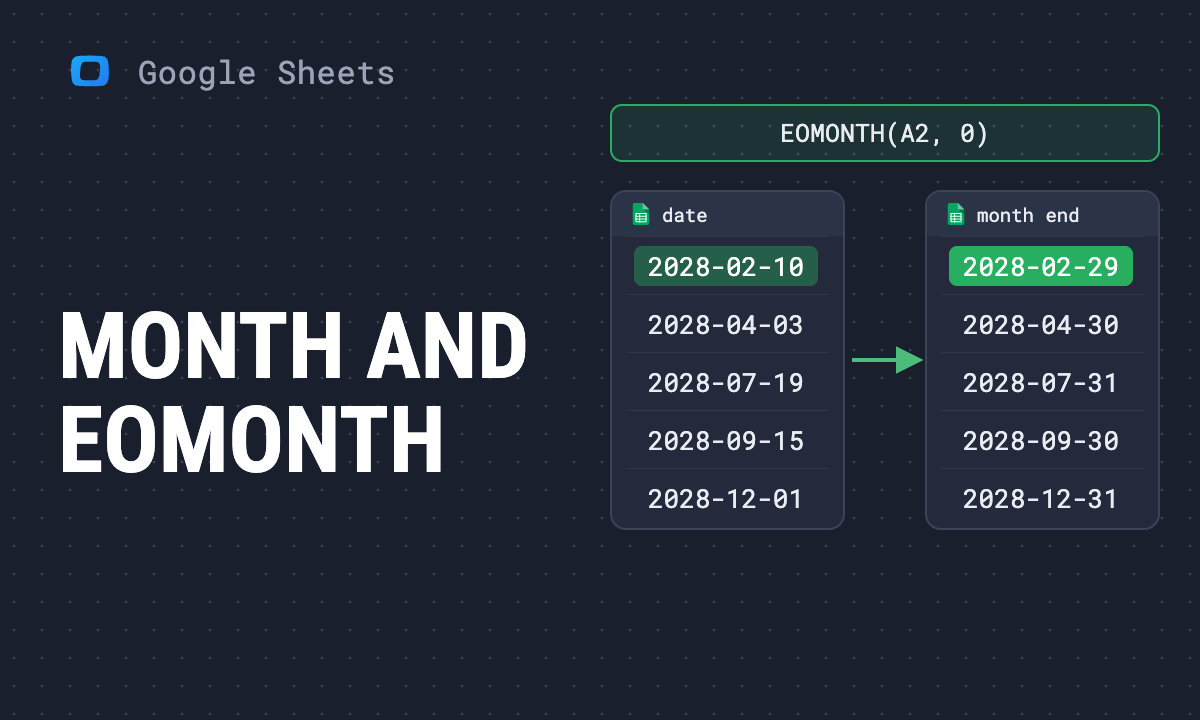 Article · Google Sheets TipsMONTH and EOMONTH functions in Google Sheets: formulas and examples
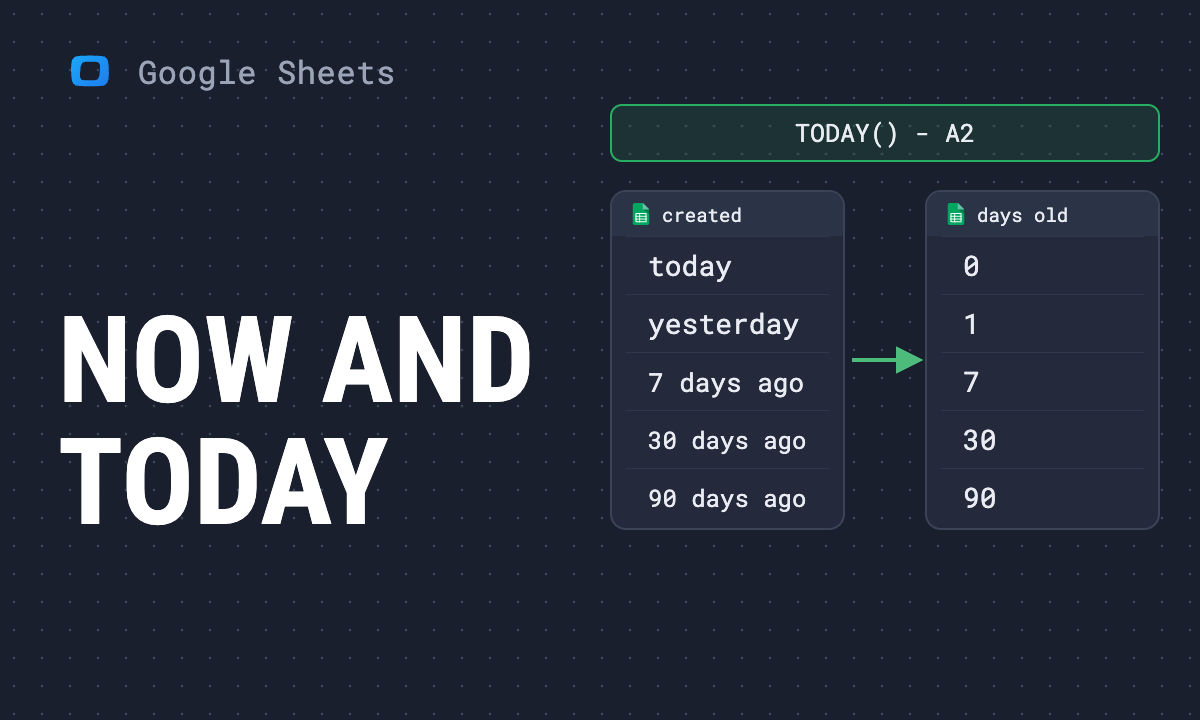 Article · Google Sheets TipsNOW and TODAY functions in Google Sheets: current date and time, with examples
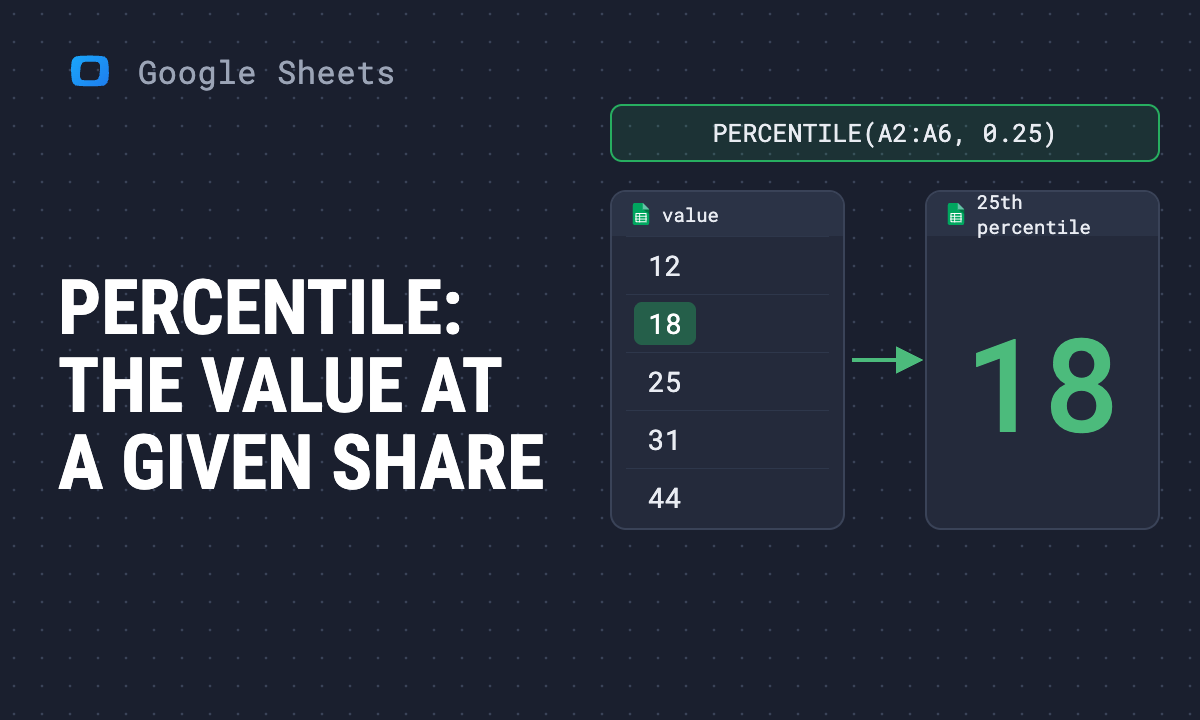 Article · Google Sheets TipsPERCENTILE function in Google Sheets: PERCENTILE.INC and PERCENTILE.EXC with examples
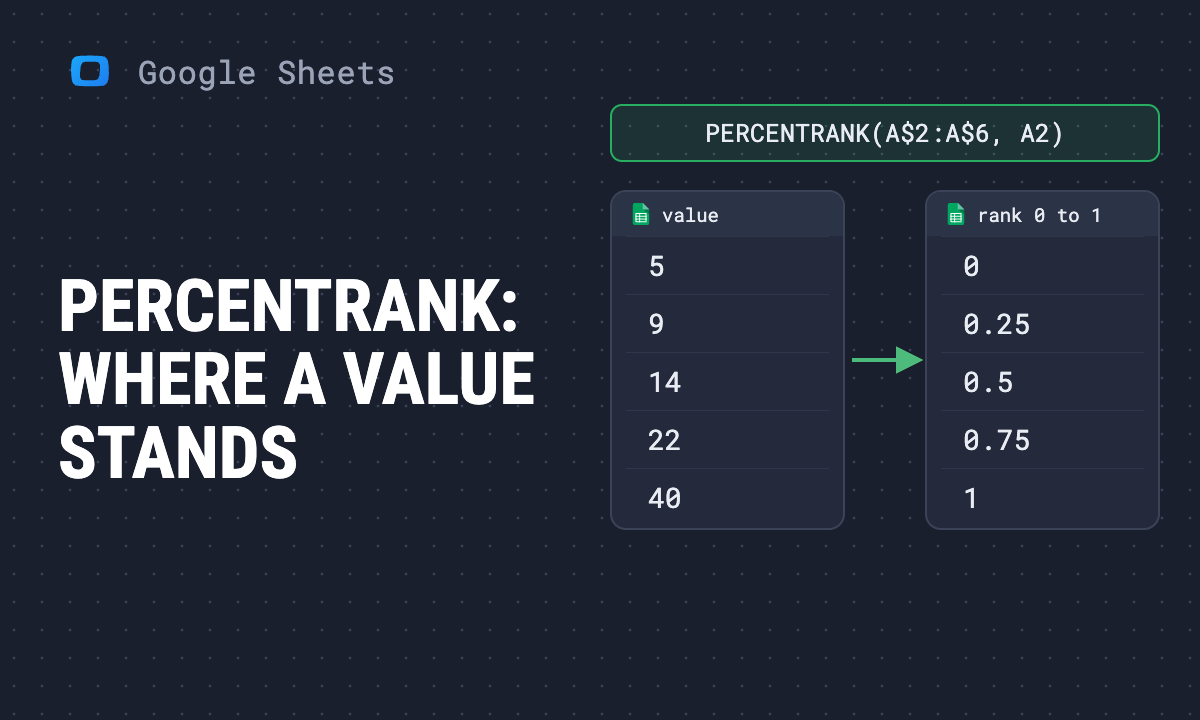 Article · Google Sheets TipsPERCENTRANK function in Google Sheets: the percentile rank of a value
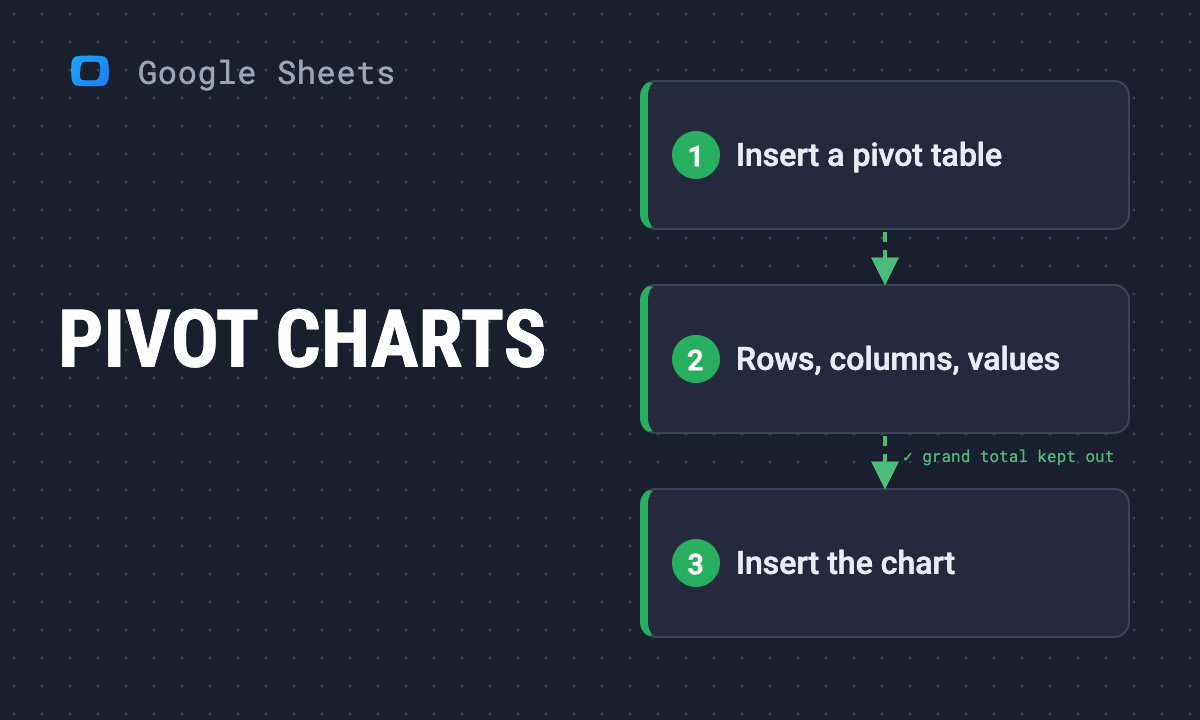 Article · Google Sheets TipsPivot charts in Google Sheets: how to make a chart from a pivot table
 Article · Google Sheets TipsPivot tables in Google Sheets: how to create, customize and use them
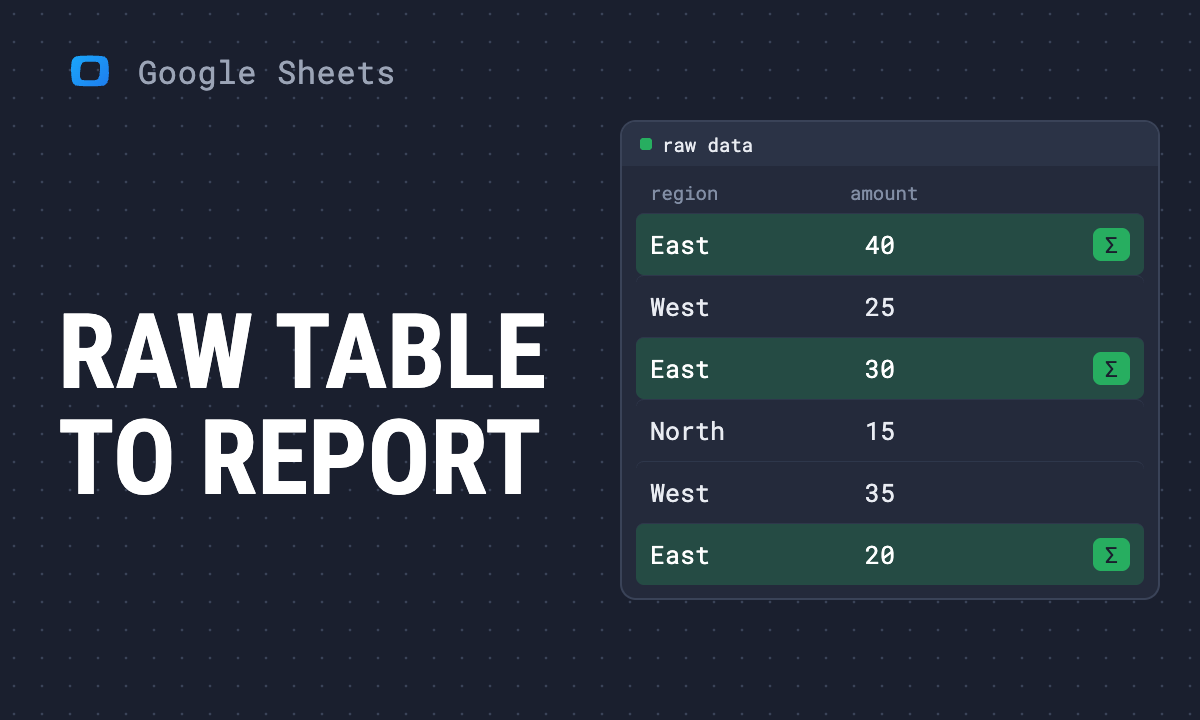 Article · Google Sheets TipsPivot tables and charts in Google Sheets: from a raw table to a report
 Article · Google Sheets TipsQUARTILE function in Google Sheets: how to calculate quartiles, the IQR and outliers
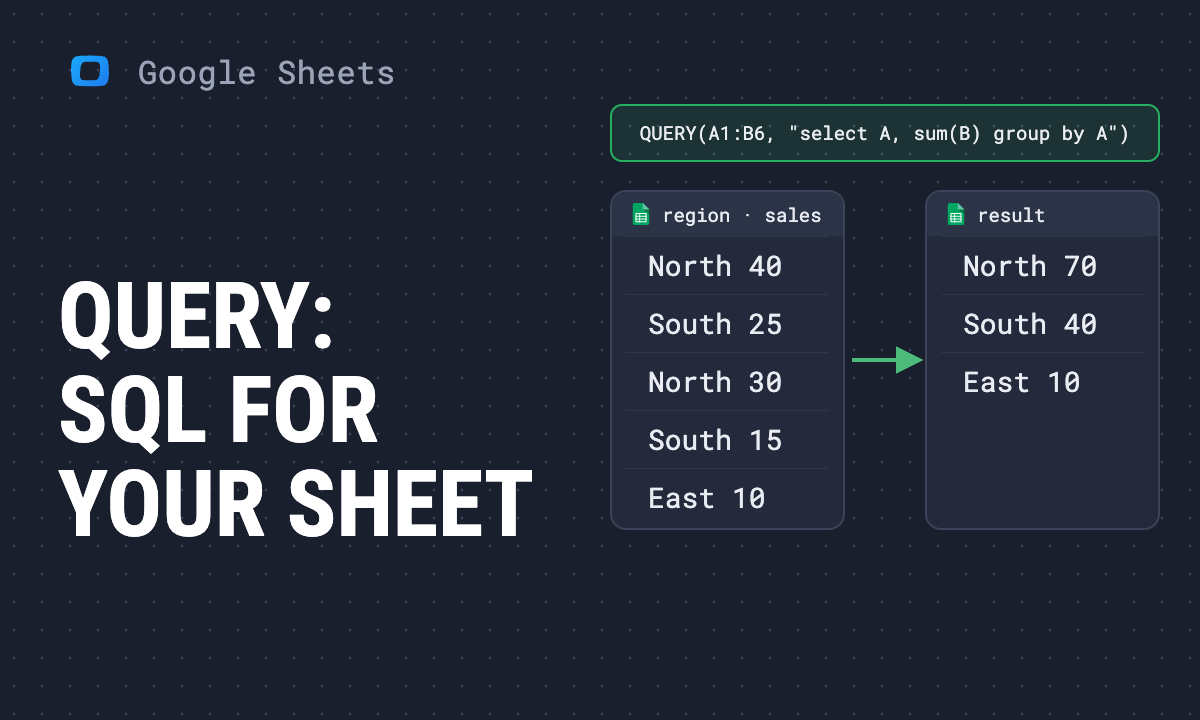 Article · Google Sheets TipsQUERY function in Google Sheets: syntax, clauses and examples
 Article · Google Sheets TipsQUERY vs VLOOKUP in Google Sheets: which one to use
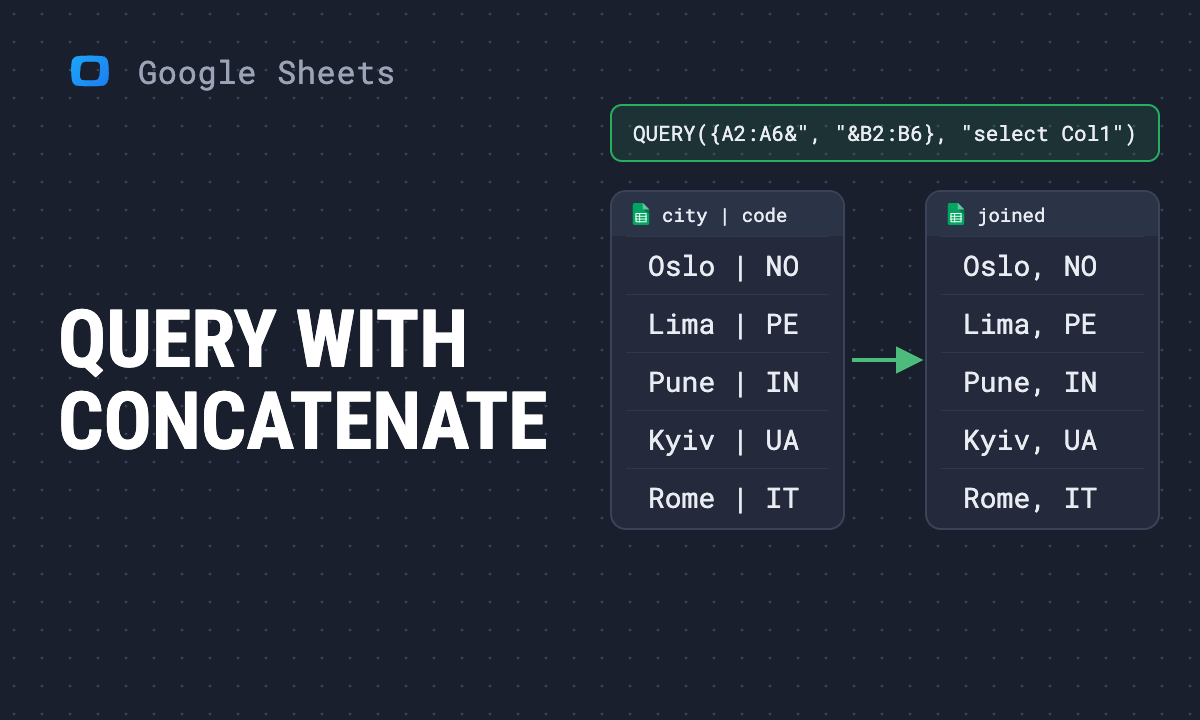 Article · Google Sheets TipsQUERY with CONCATENATE in Google Sheets: how to concatenate two columns
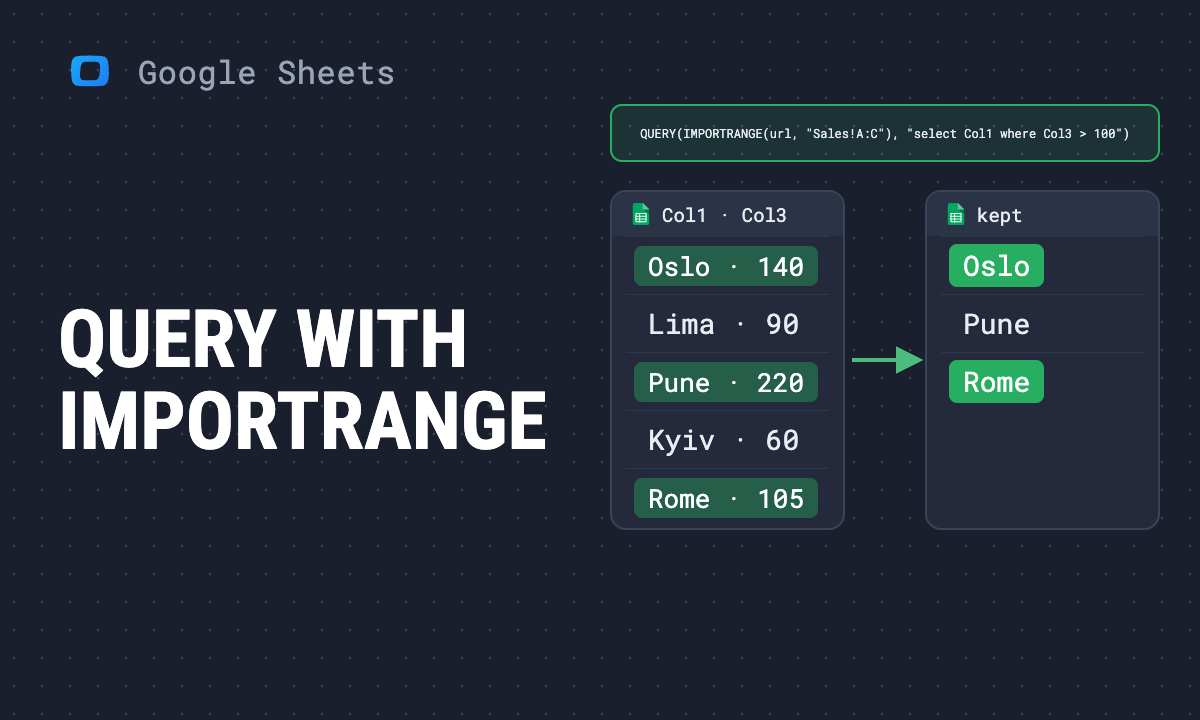 Article · Google Sheets TipsQUERY with IMPORTRANGE in Google Sheets: formula and 12 examples
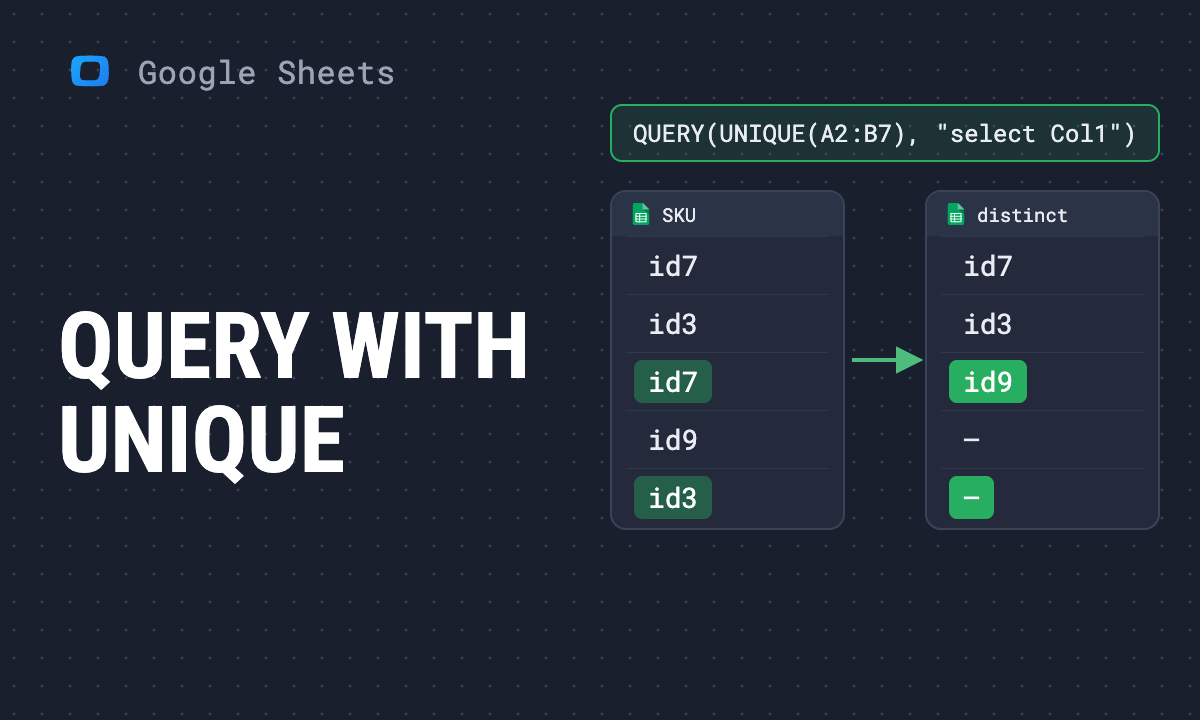 Article · Google Sheets TipsQUERY with UNIQUE in Google Sheets: how to return distinct rows
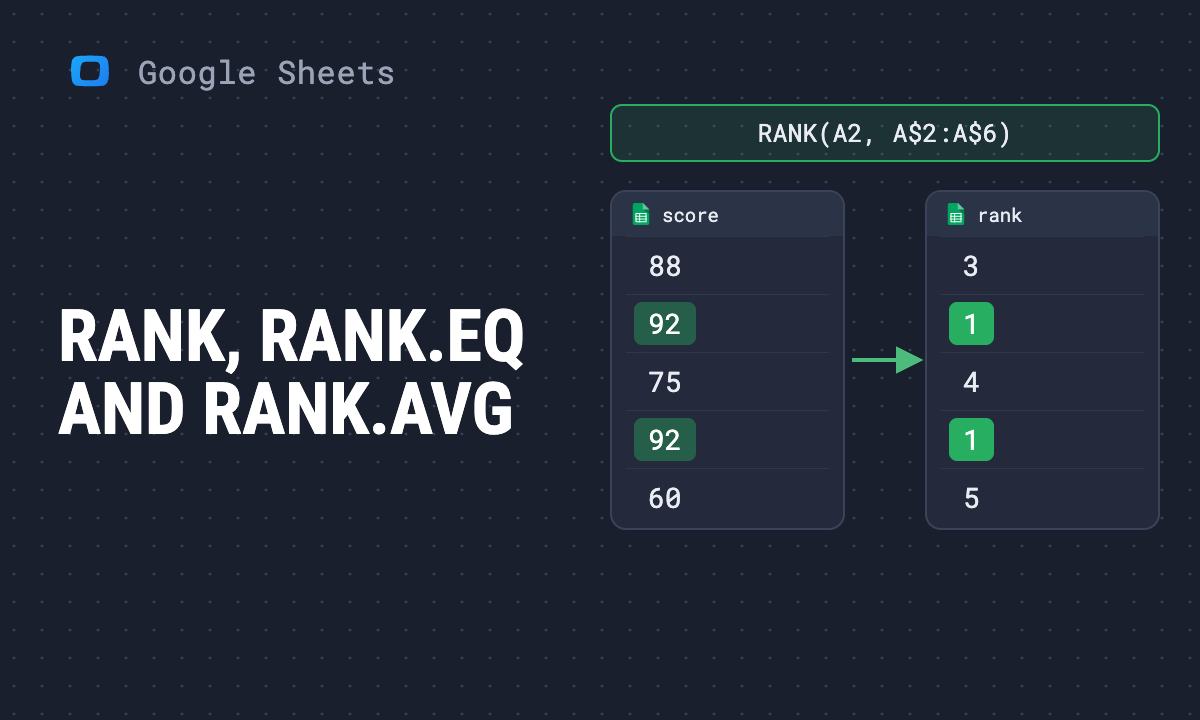 Article · Google Sheets TipsRANK function in Google Sheets: RANK, RANK.EQ and RANK.AVG
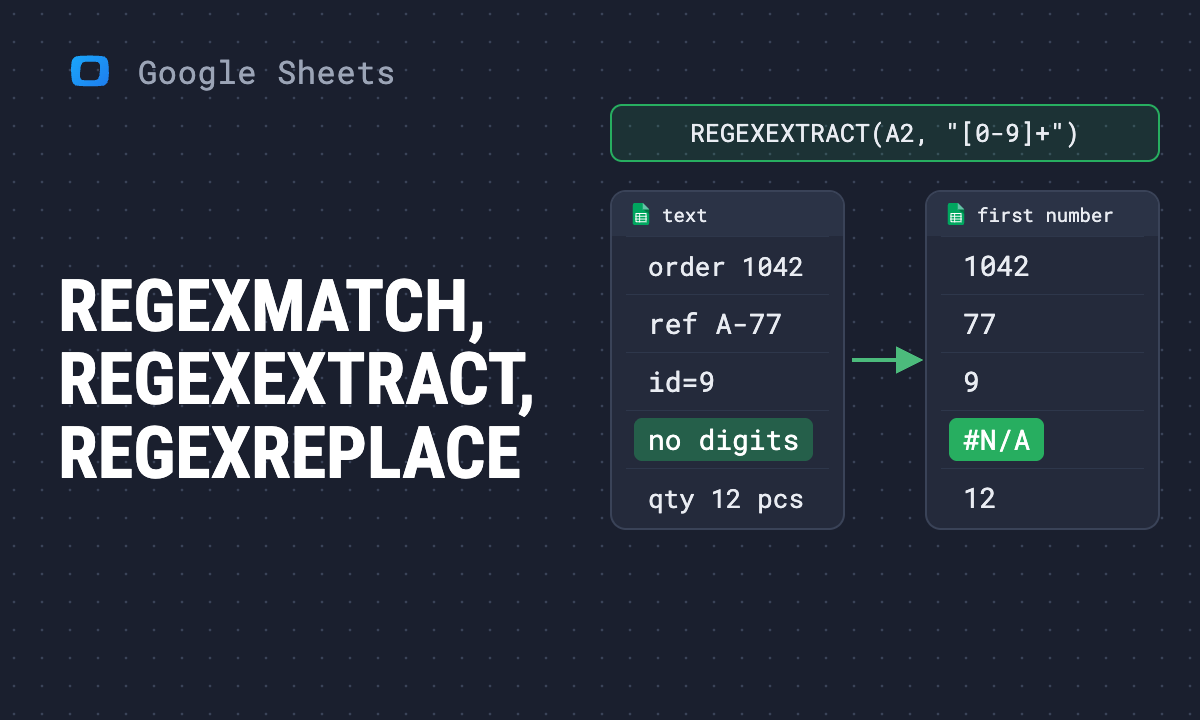 Article · Google Sheets TipsREGEX functions in Google Sheets: REGEXMATCH, REGEXEXTRACT and REGEXREPLACE
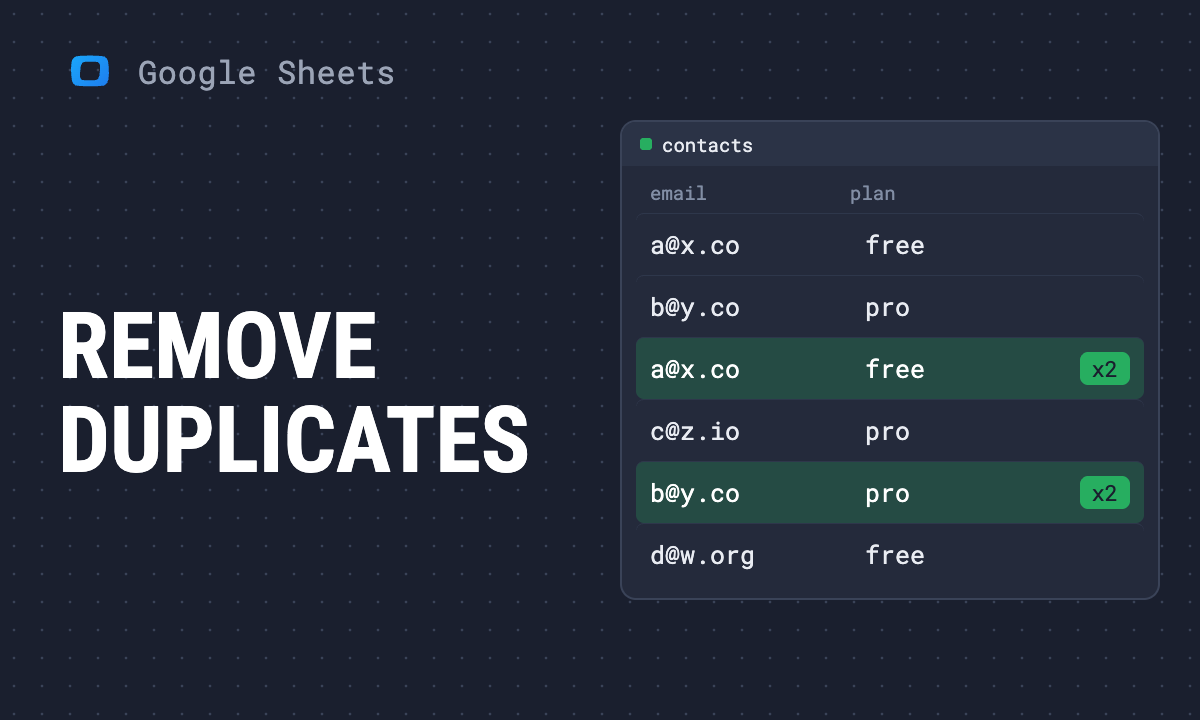 Article · Google Sheets TipsHow to remove duplicates in Google Sheets, and prevent them
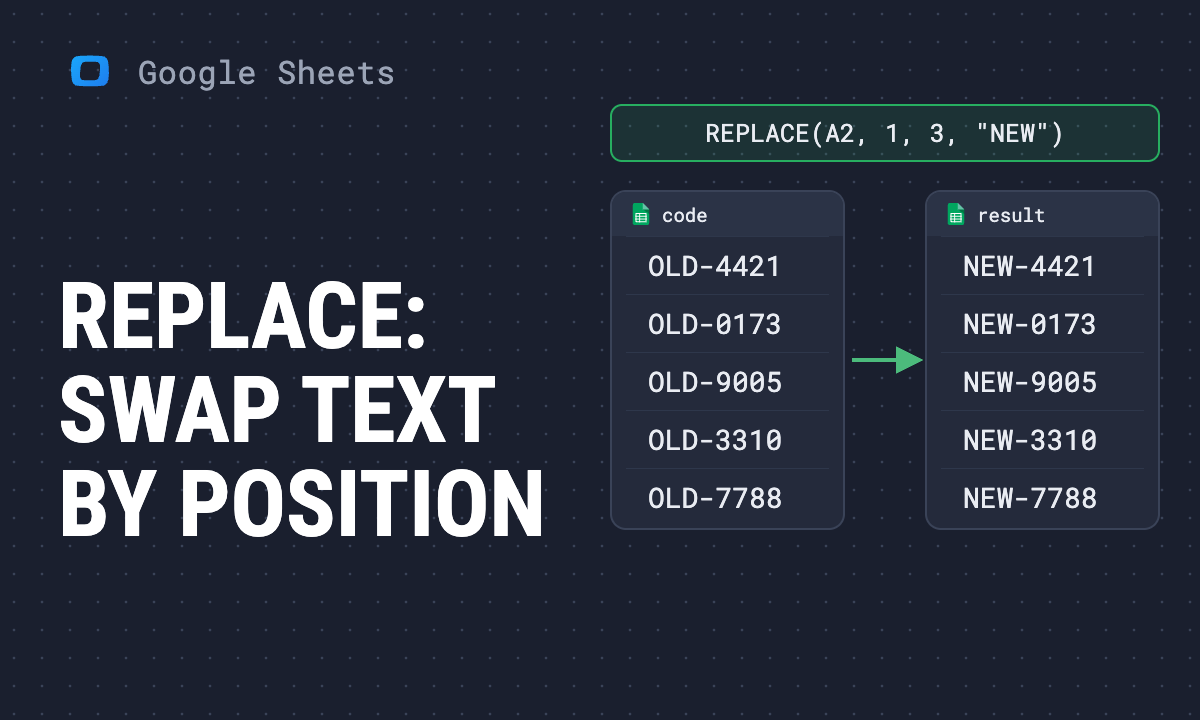 Article · Google Sheets TipsREPLACE function in Google Sheets: syntax and examples
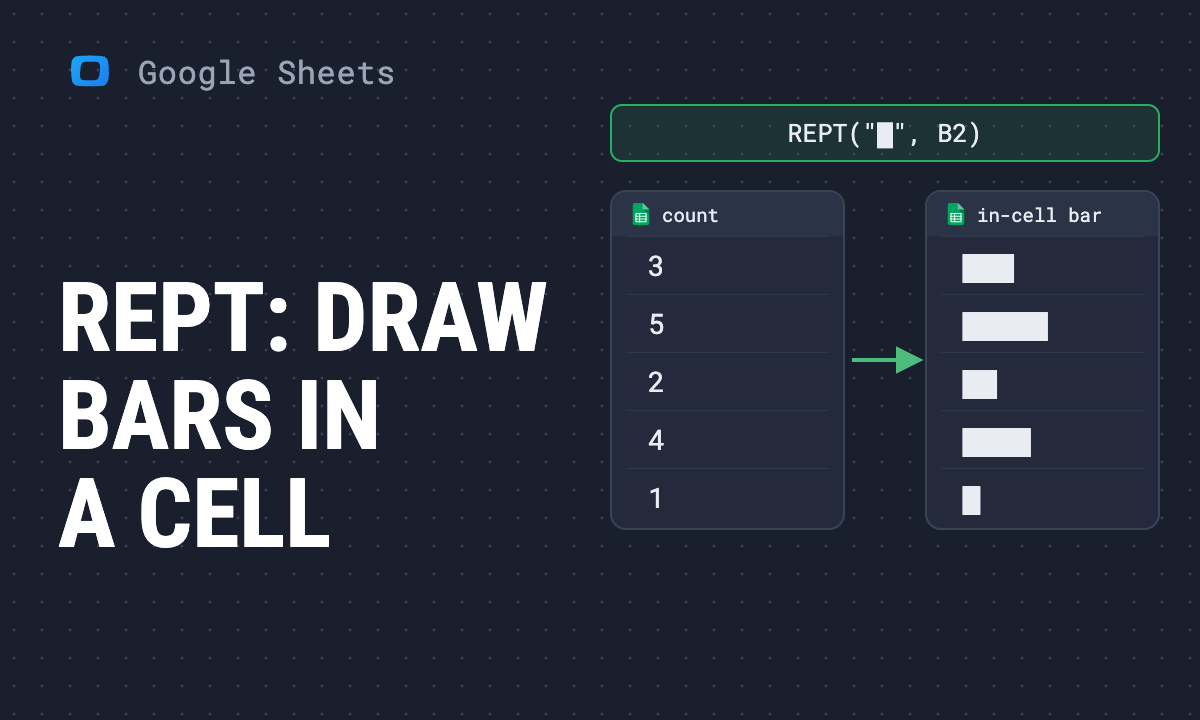 Article · Google Sheets TipsREPT function in Google Sheets: repeat text, pad values and draw in-cell bars
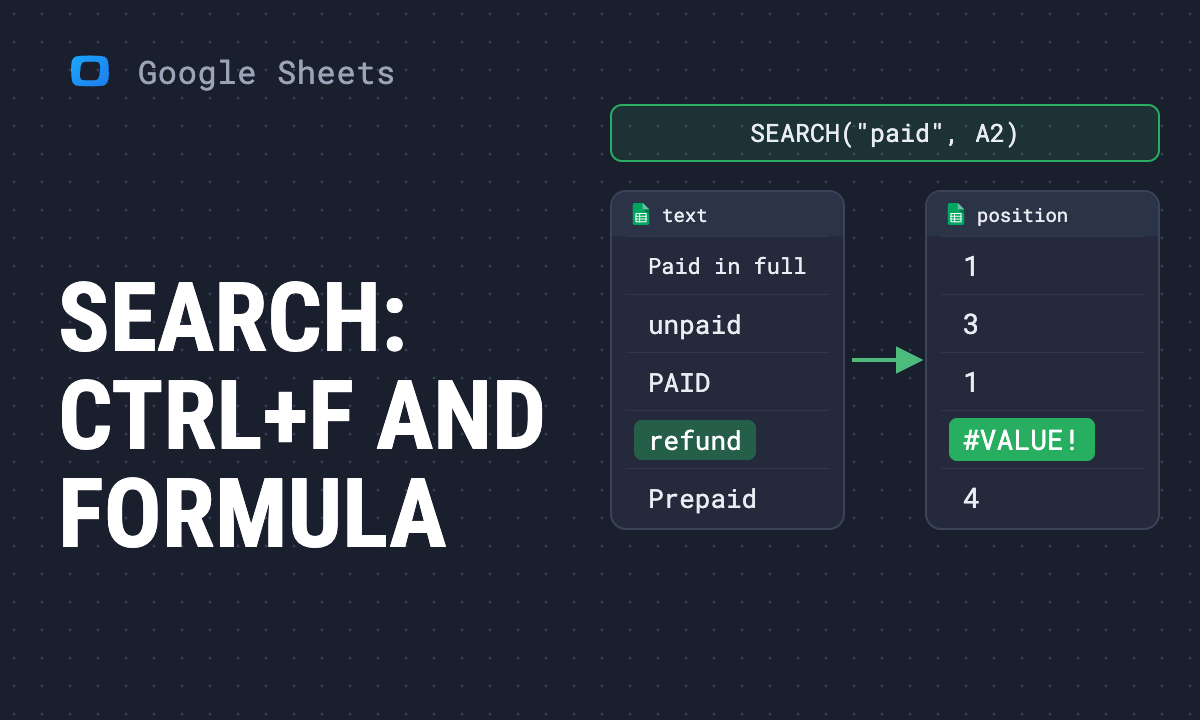 Article · Google Sheets TipsHow to search in Google Sheets: Find, find and replace, and the SEARCH function
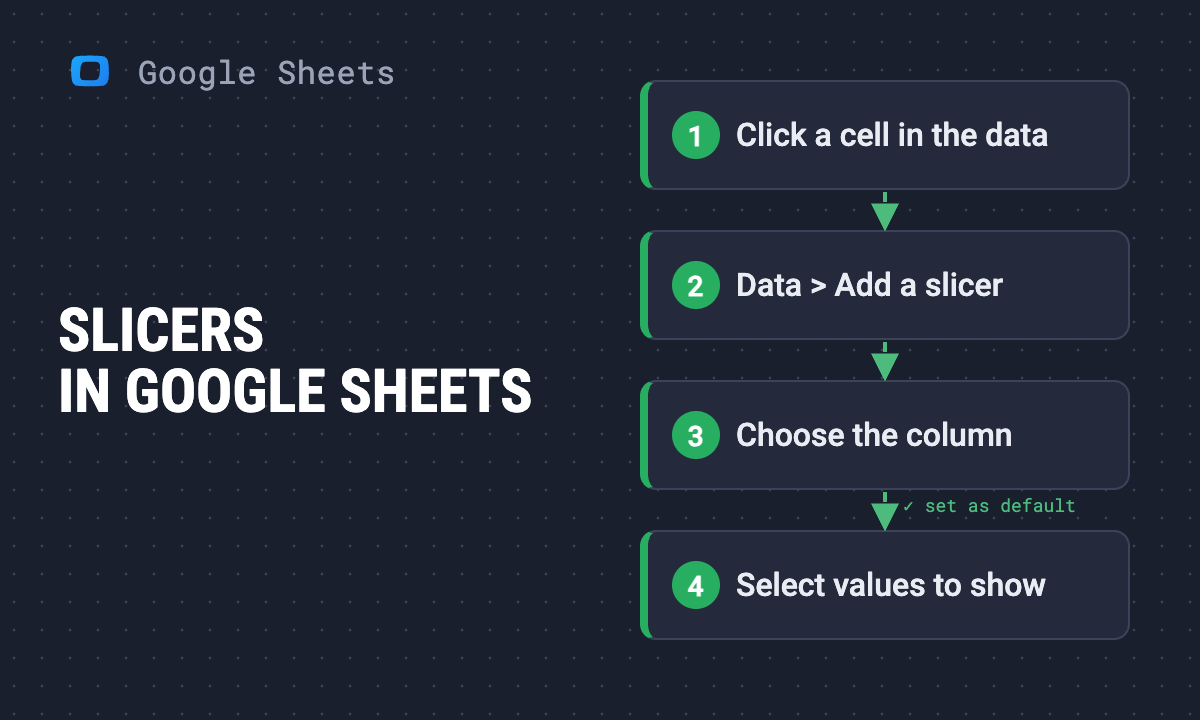 Article · Google Sheets TipsSlicers in Google Sheets: how to add, use and save them
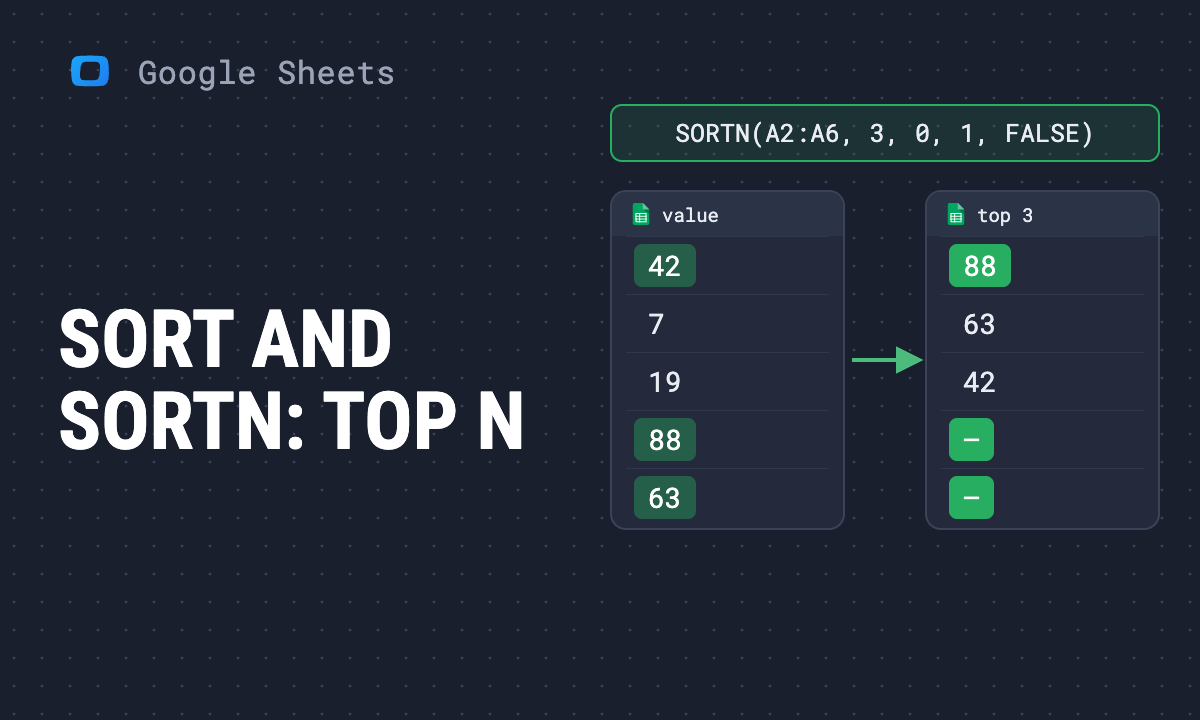 Article · Google Sheets TipsSORT and SORTN in Google Sheets: syntax, top N and ties
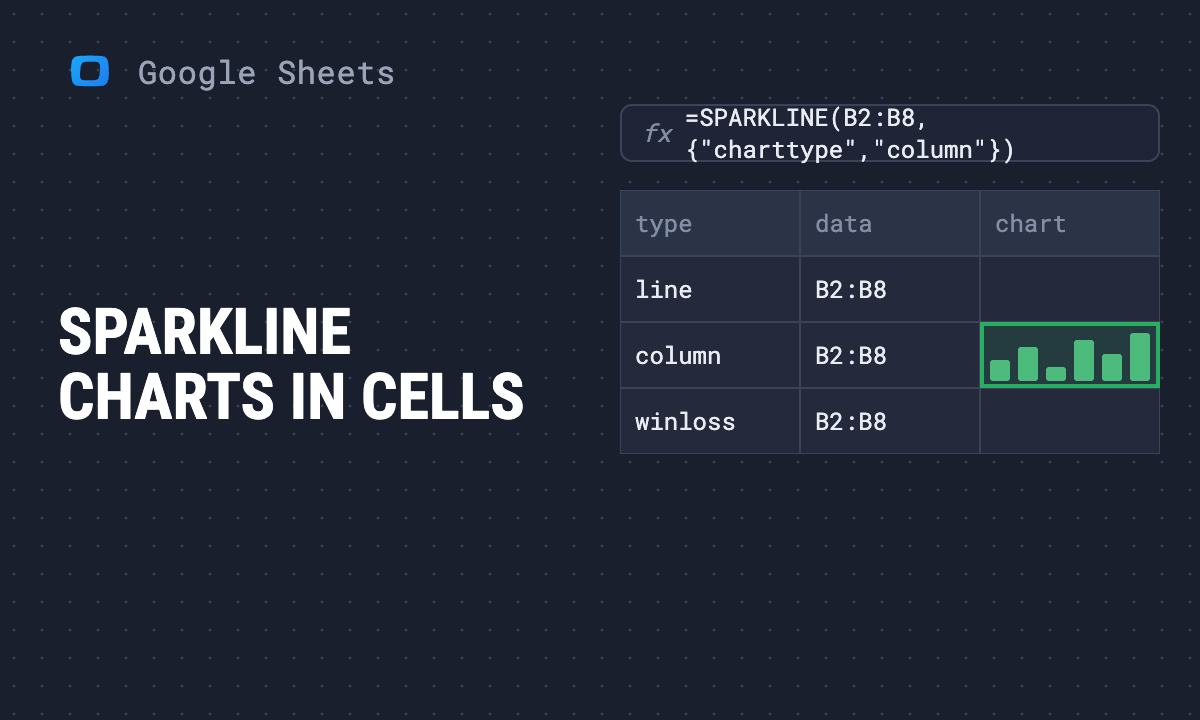 Article · Google Sheets TipsSPARKLINE in Google Sheets: chart types, options and examples
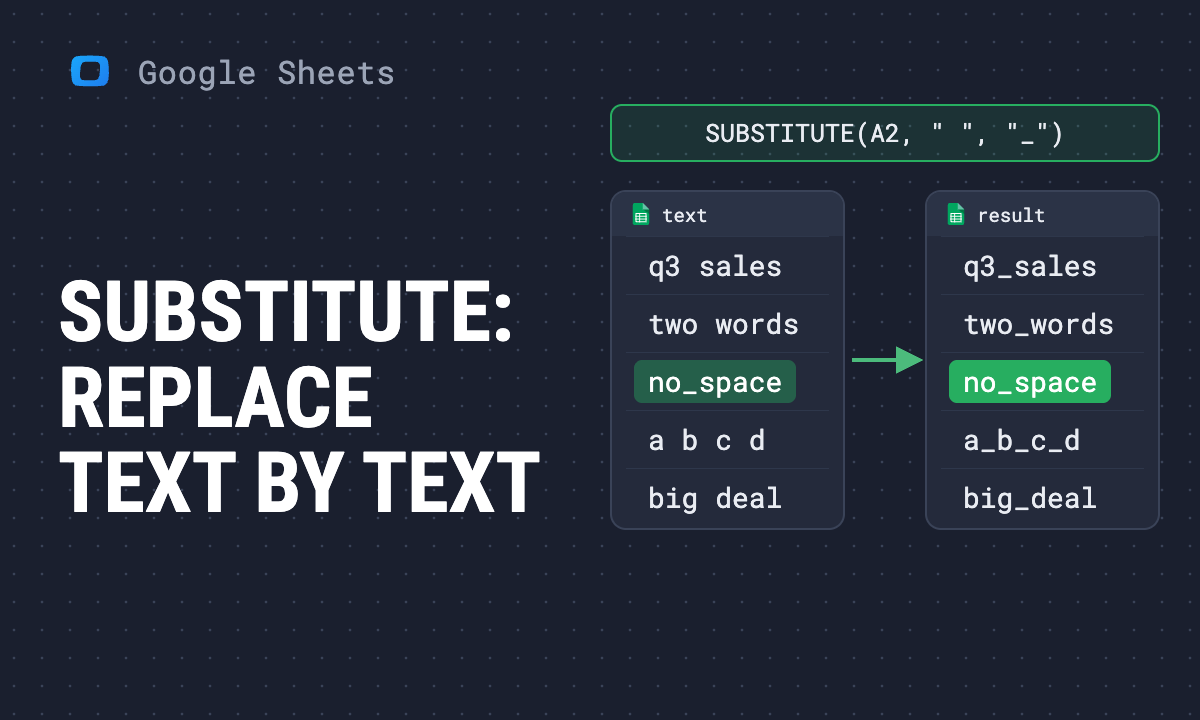 Article · Google Sheets TipsSUBSTITUTE function in Google Sheets: replace text, the nth occurrence and multiple values
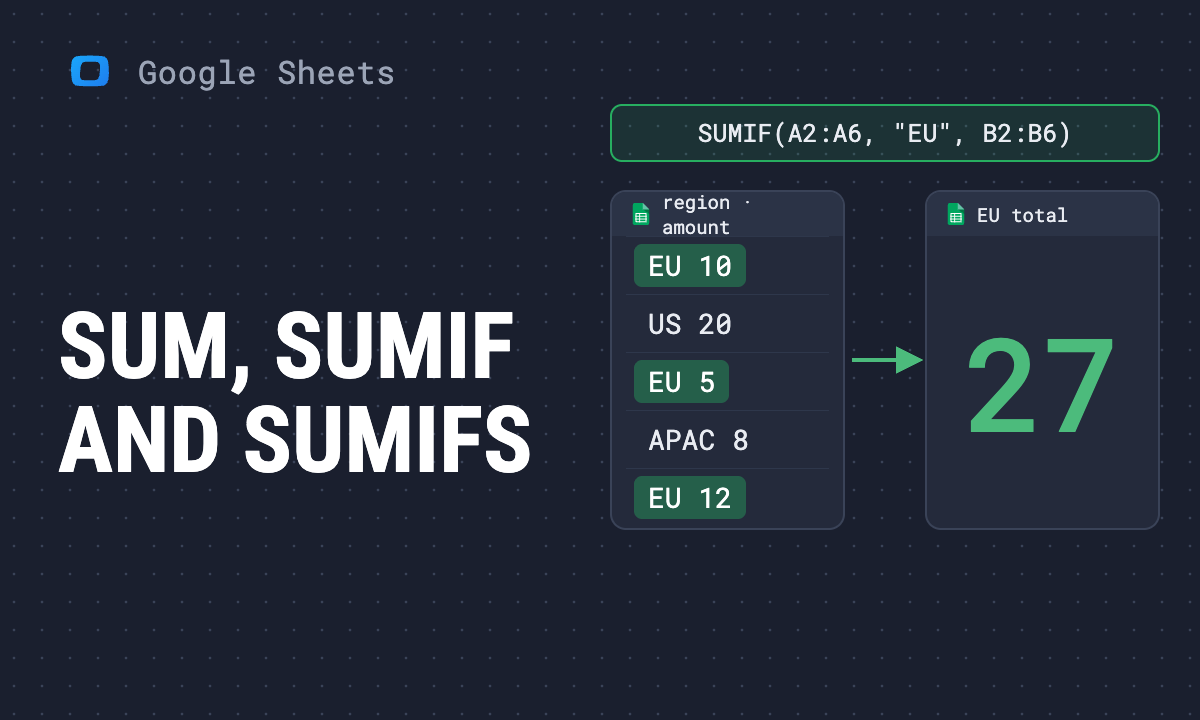 Article · Google Sheets TipsHow to sum in Google Sheets: SUM, SUMIF and SUMIFS with examples
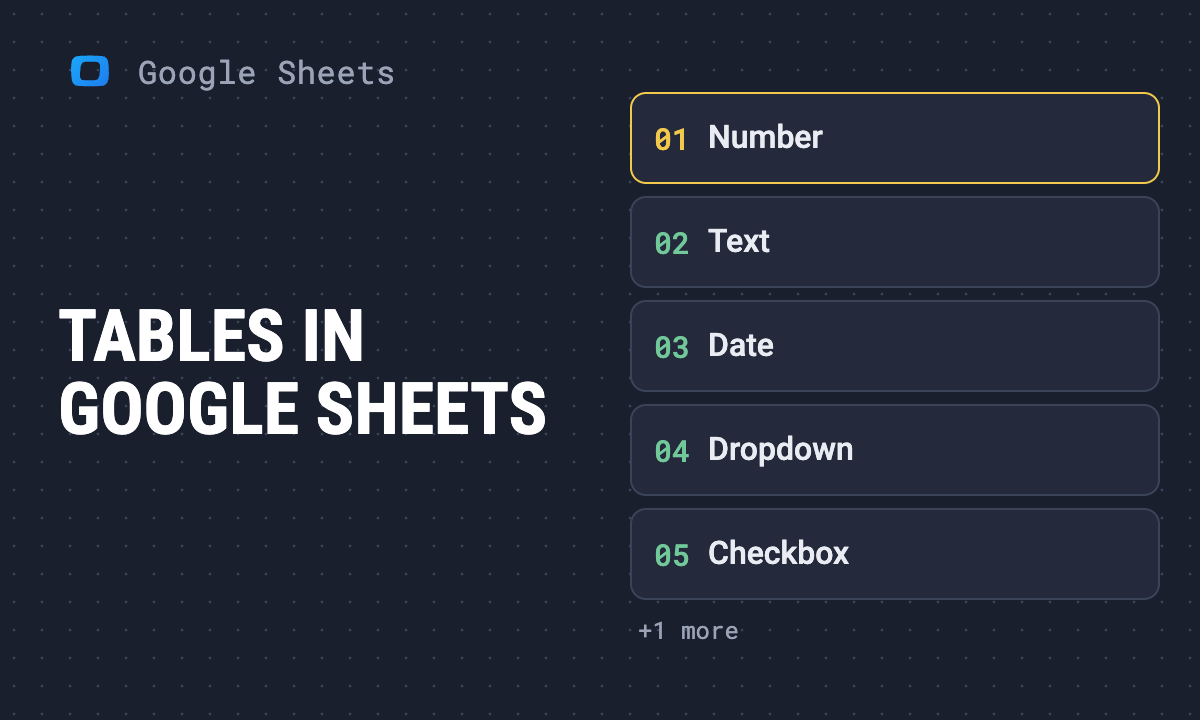 Article · Google Sheets TipsTables in Google Sheets: how to create, format and reference them
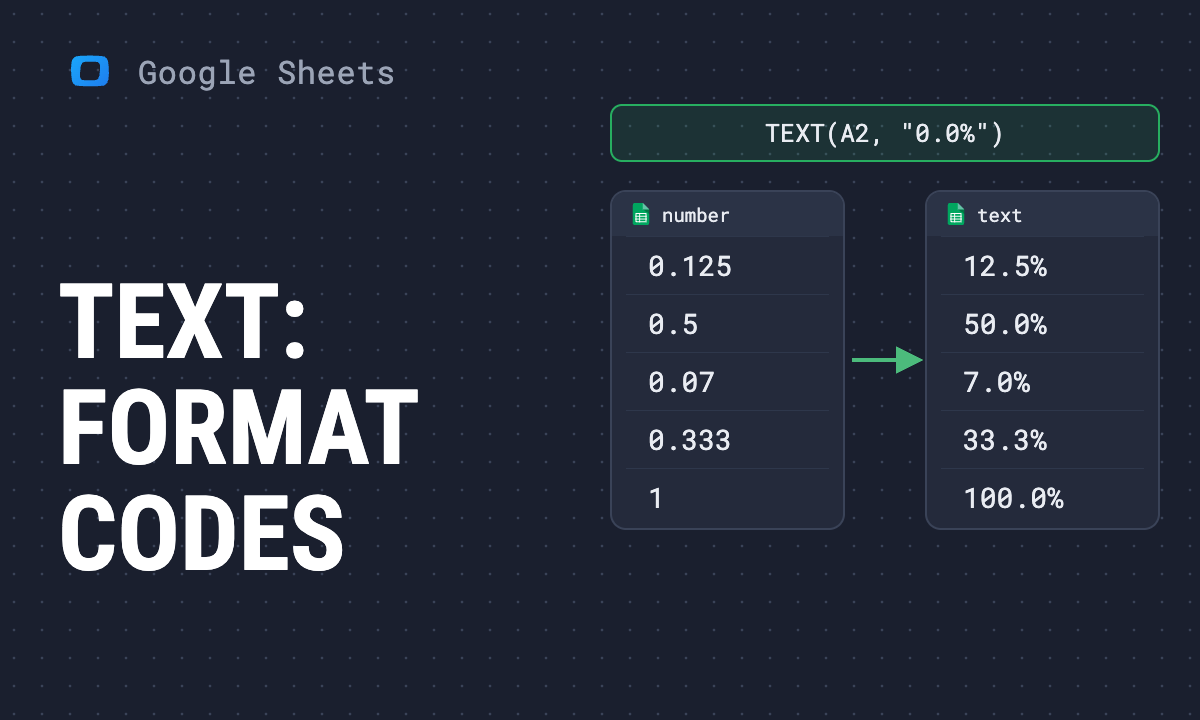 Article · Google Sheets TipsTEXT function in Google Sheets: format codes for numbers, dates and times
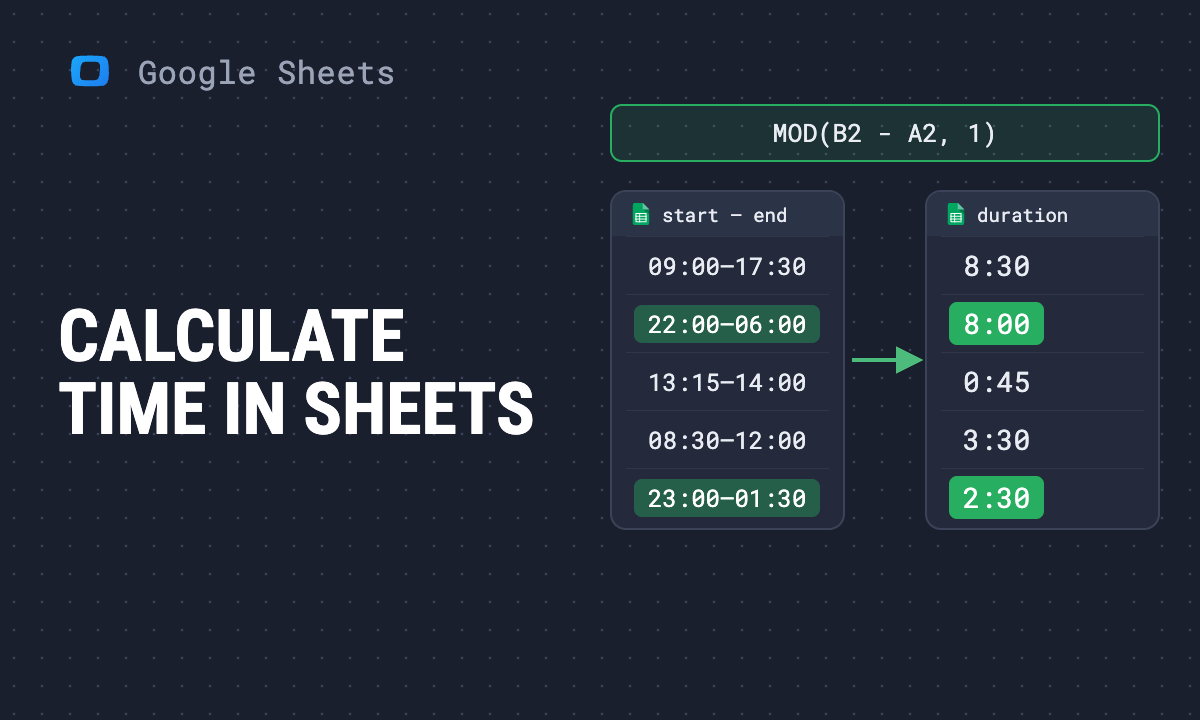 Article · Google Sheets TipsHow to calculate time in Google Sheets: add, subtract and the TIME functions
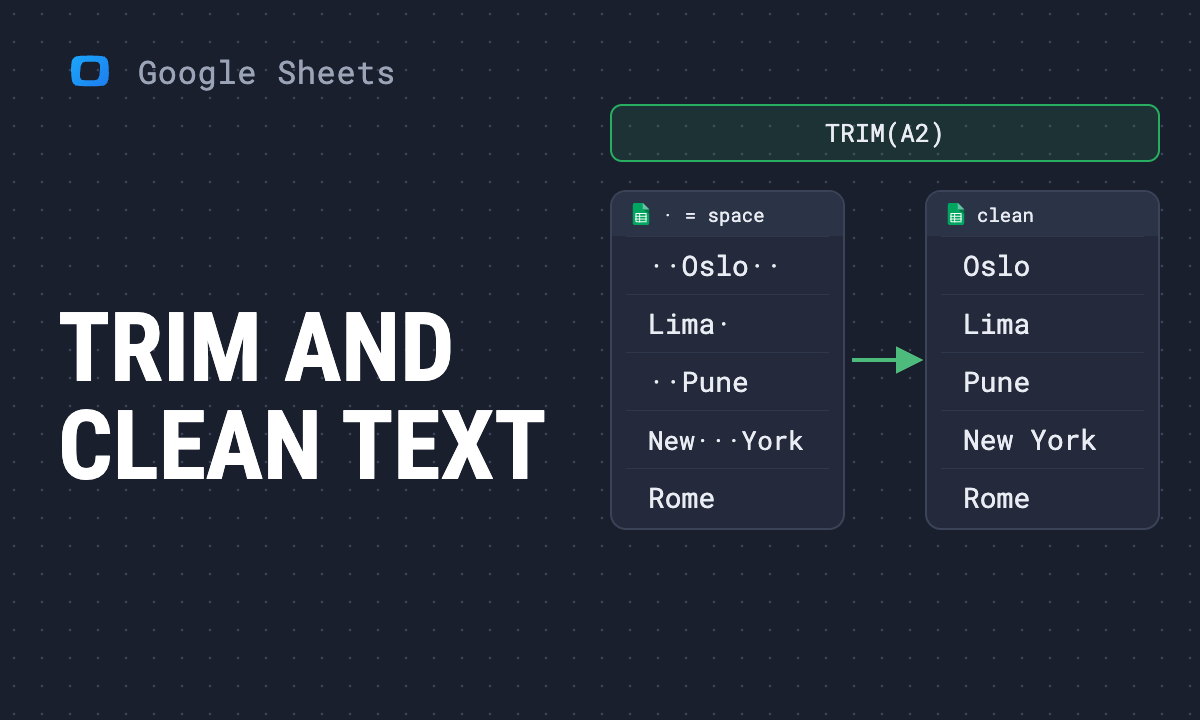 Article · Google Sheets TipsTRIM, CLEAN and T functions in Google Sheets: remove extra spaces and hidden characters
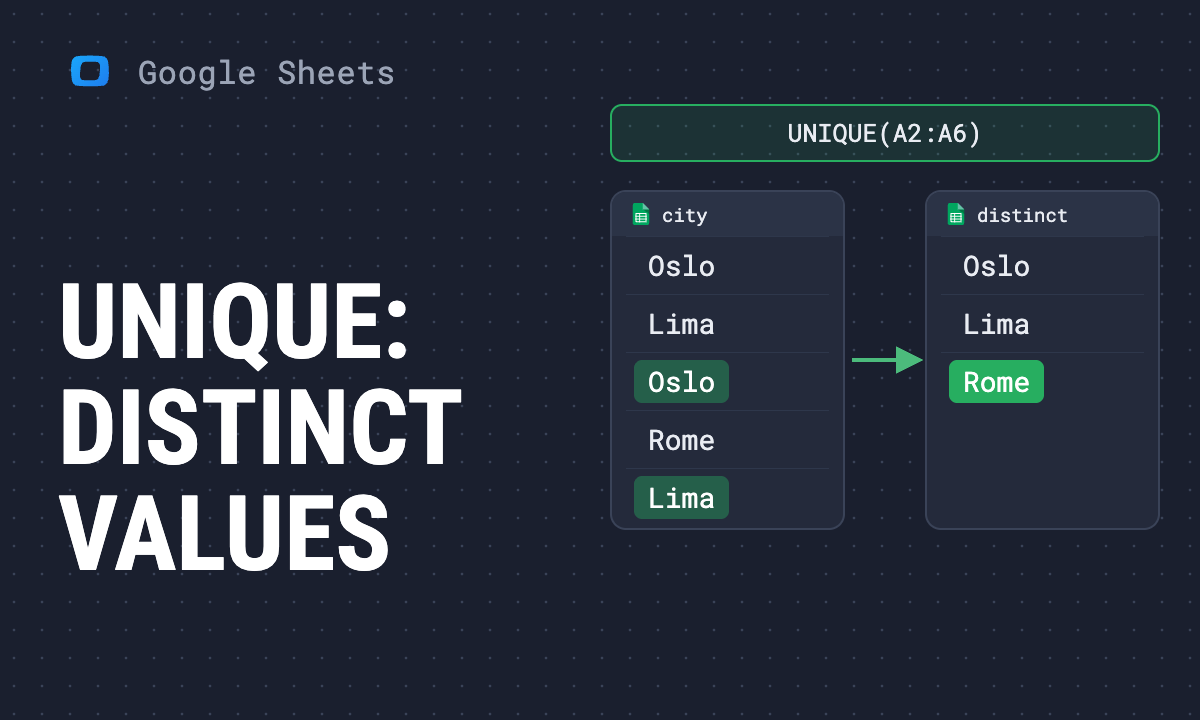 Article · Google Sheets TipsUNIQUE function in Google Sheets: syntax, examples and common errors
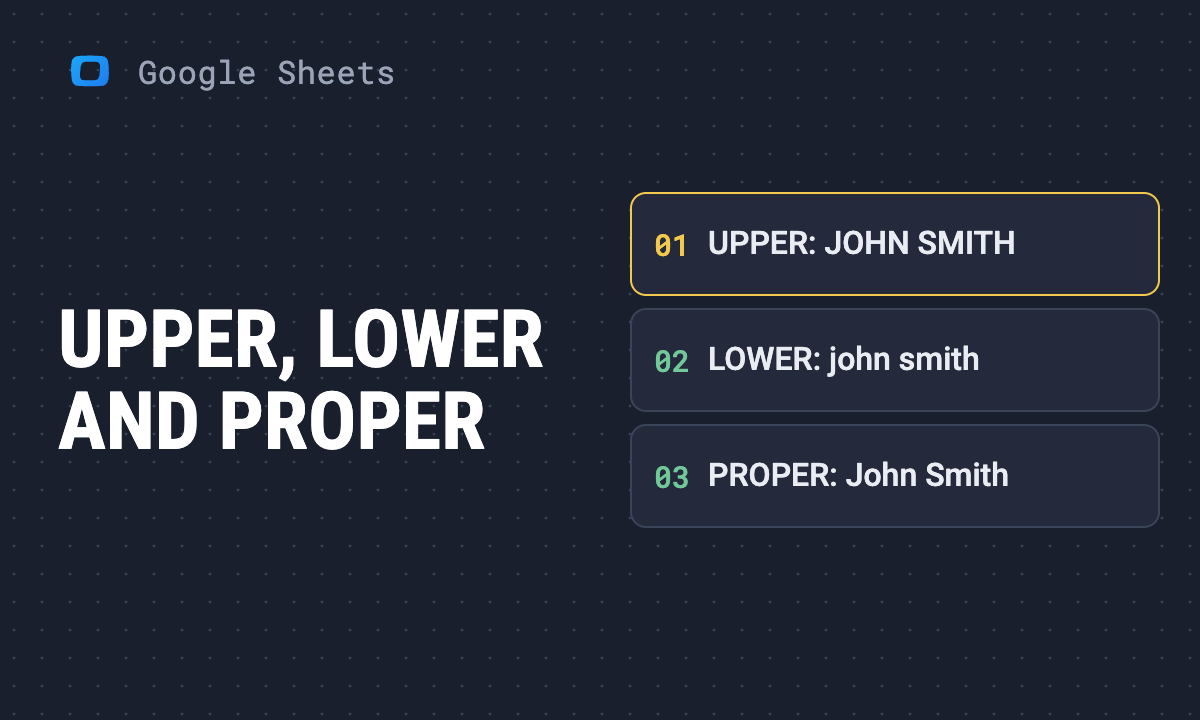 Article · Google Sheets TipsUPPER, LOWER and PROPER in Google Sheets: change text case
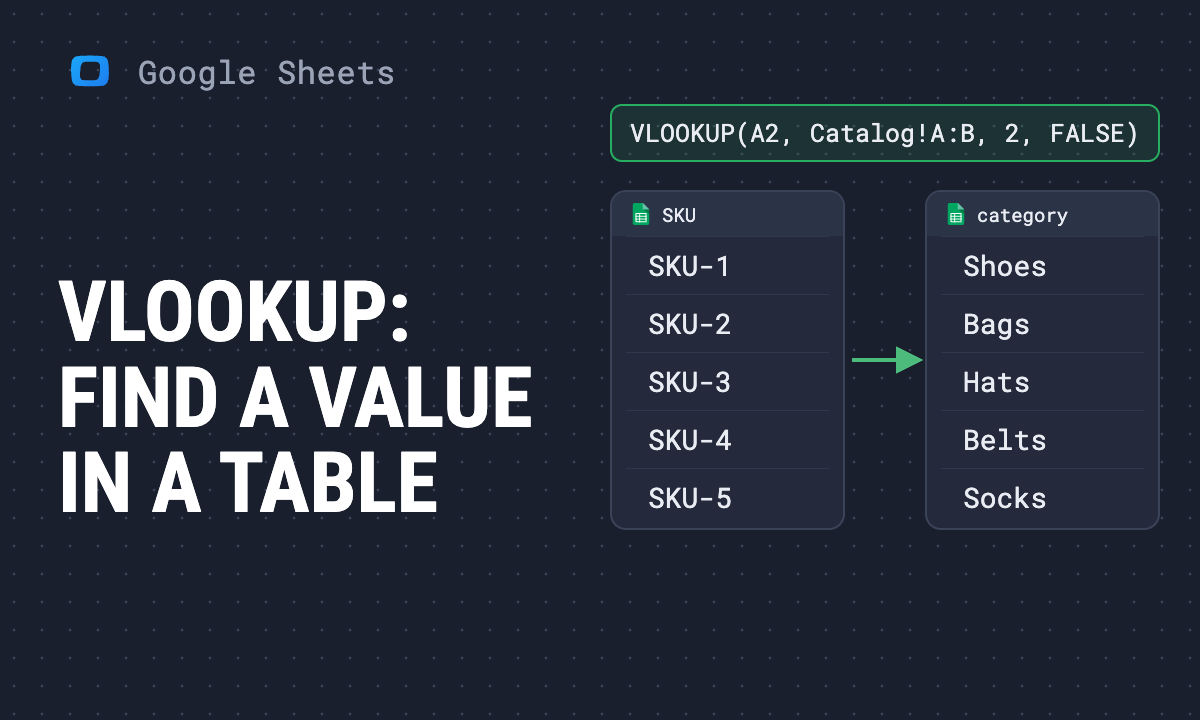 Article · Google Sheets TipsVLOOKUP in Google Sheets: formula, VLOOKUP from another sheet, and examples
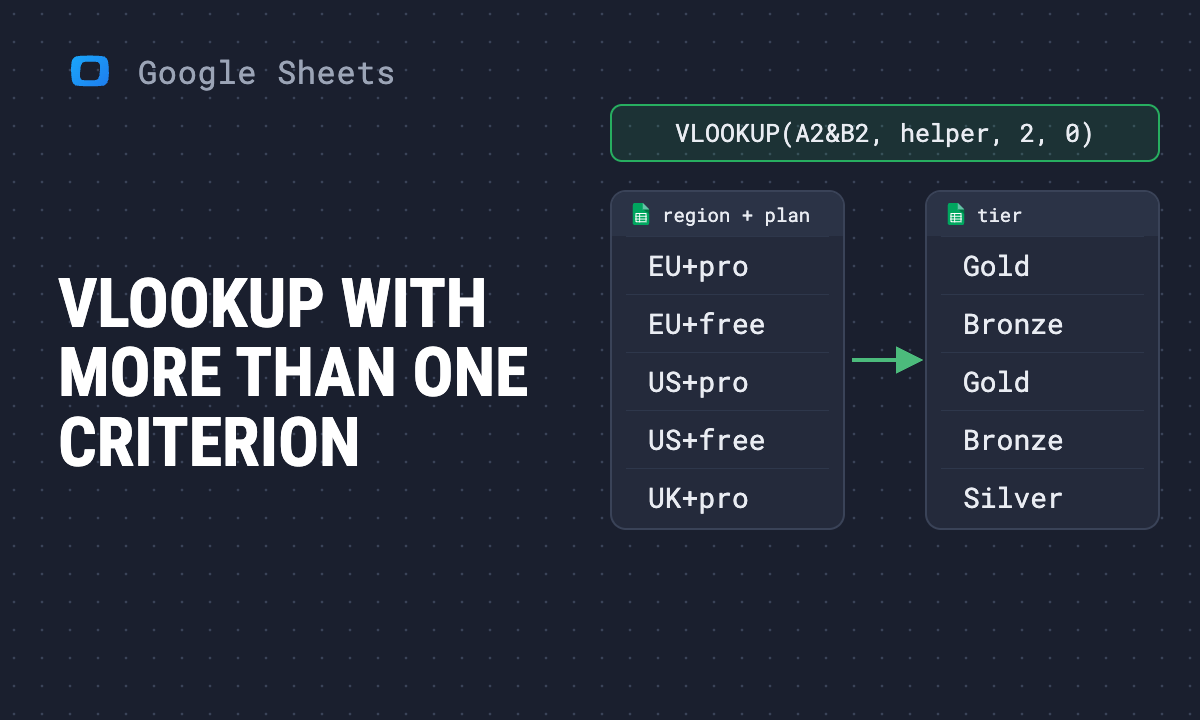 Article · Google Sheets TipsVLOOKUP with multiple criteria in Google Sheets: 5 ways
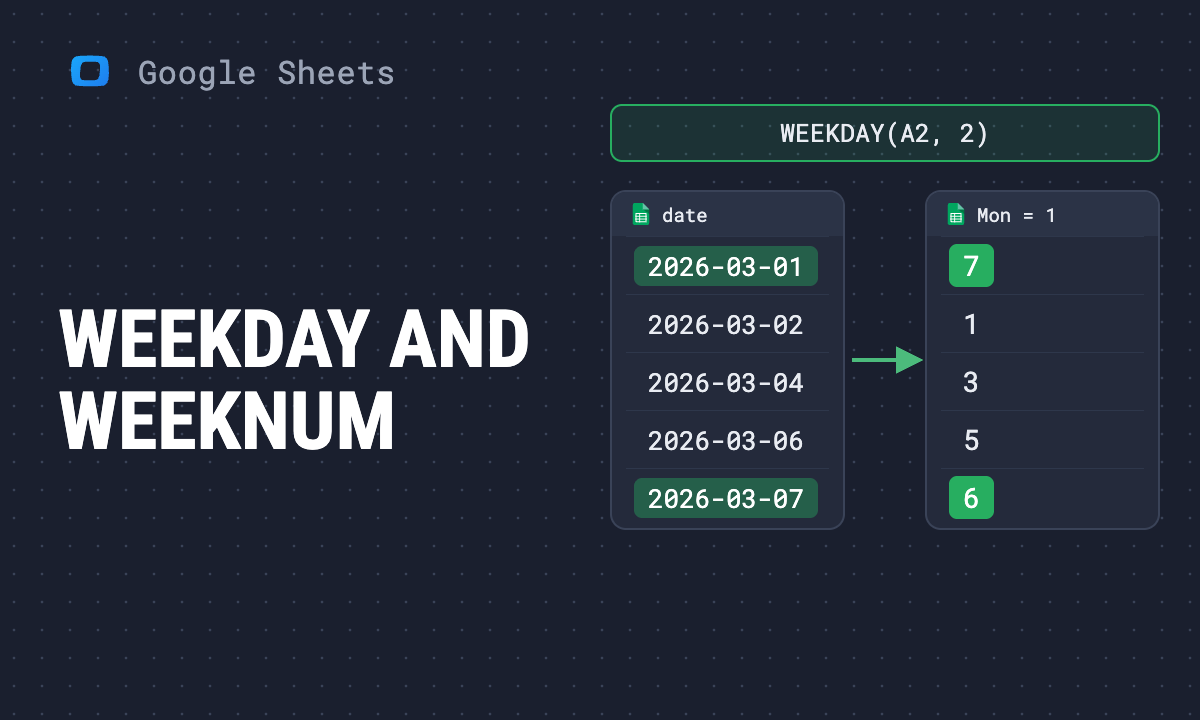 Article · Google Sheets TipsDay of the week and week number in Google Sheets: WEEKDAY, WEEKNUM and ISOWEEKNUM
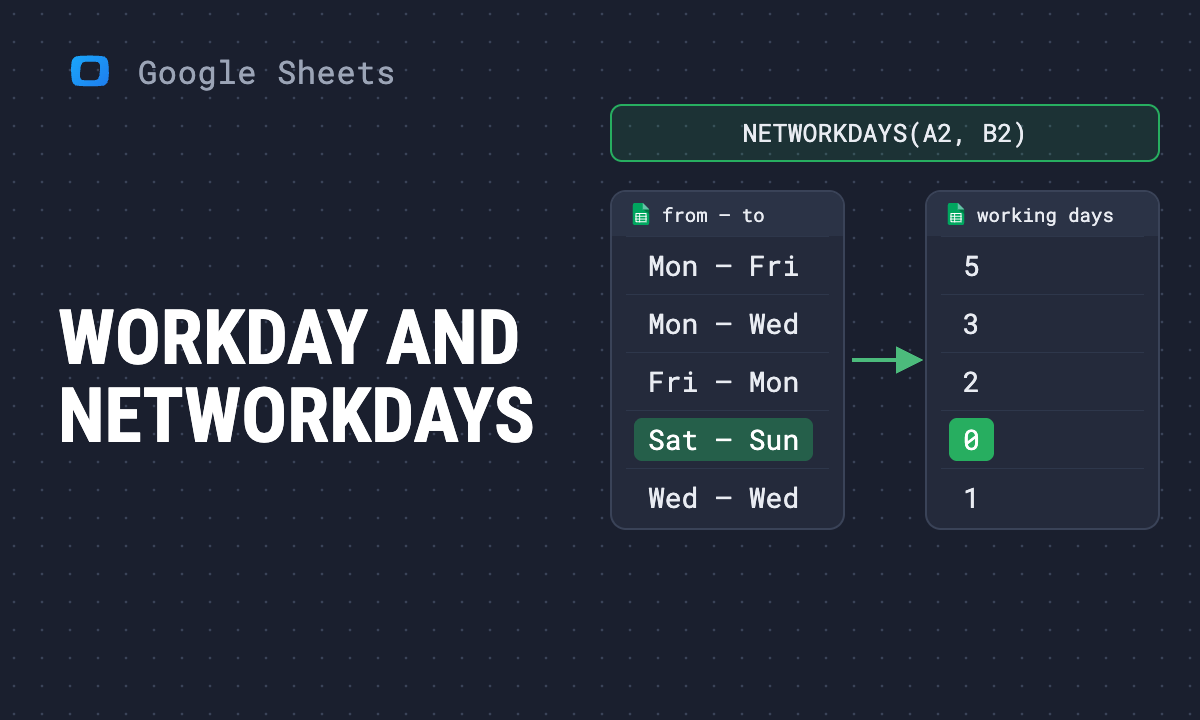 Article · Google Sheets TipsWORKDAY and NETWORKDAYS in Google Sheets: how to count working days
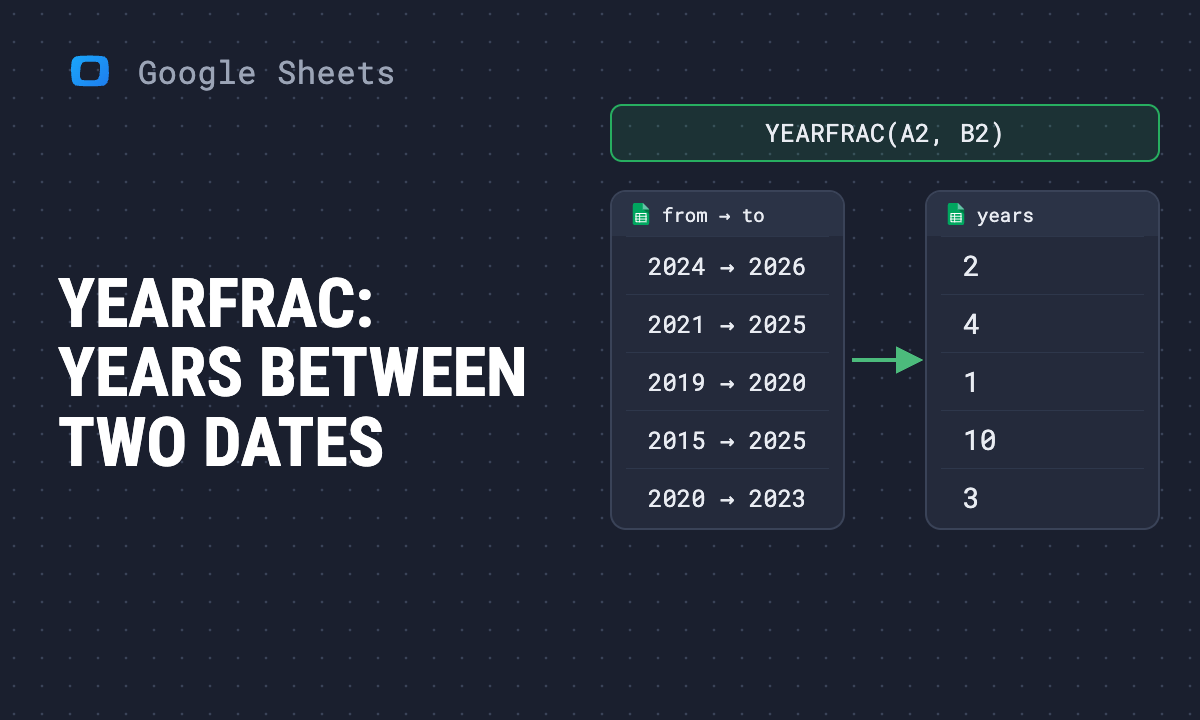 Article · Google Sheets TipsYEAR and YEARFRAC functions in Google Sheets: get the year from a date and the years between two dates
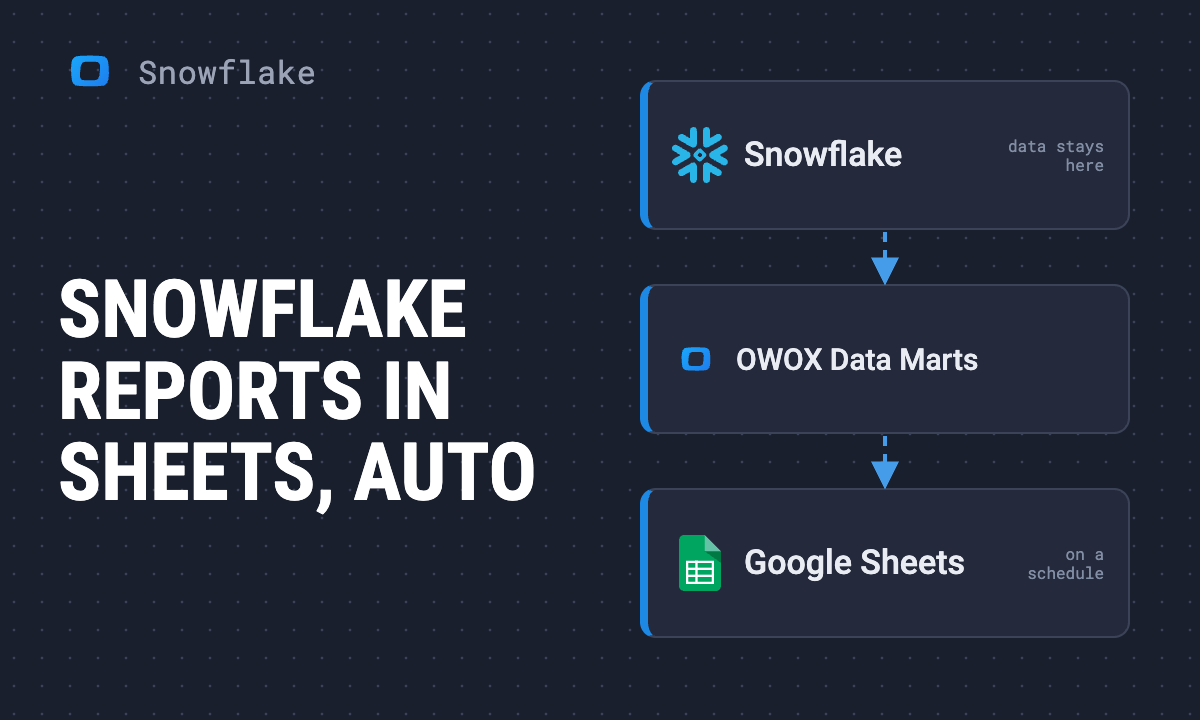 Article · SnowflakeAutomate Snowflake reports in Google Sheets with OWOX Data Marts
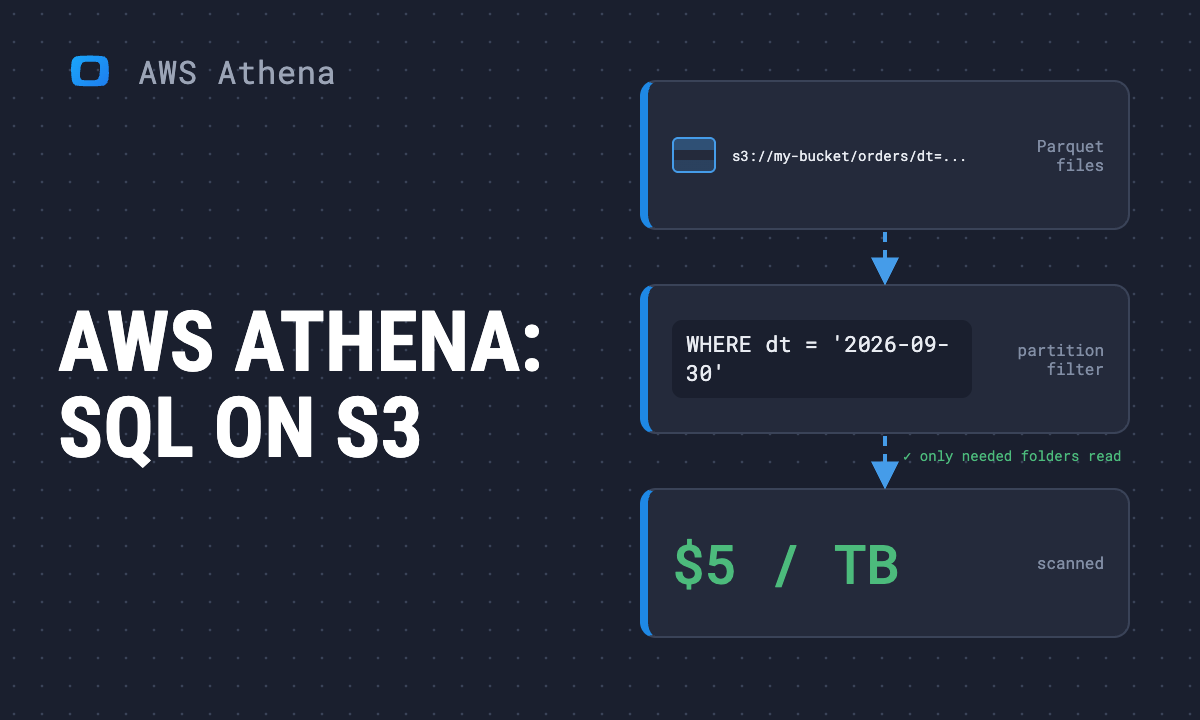 Article · Amazon AthenaAWS Athena 101: serverless SQL on S3 explained
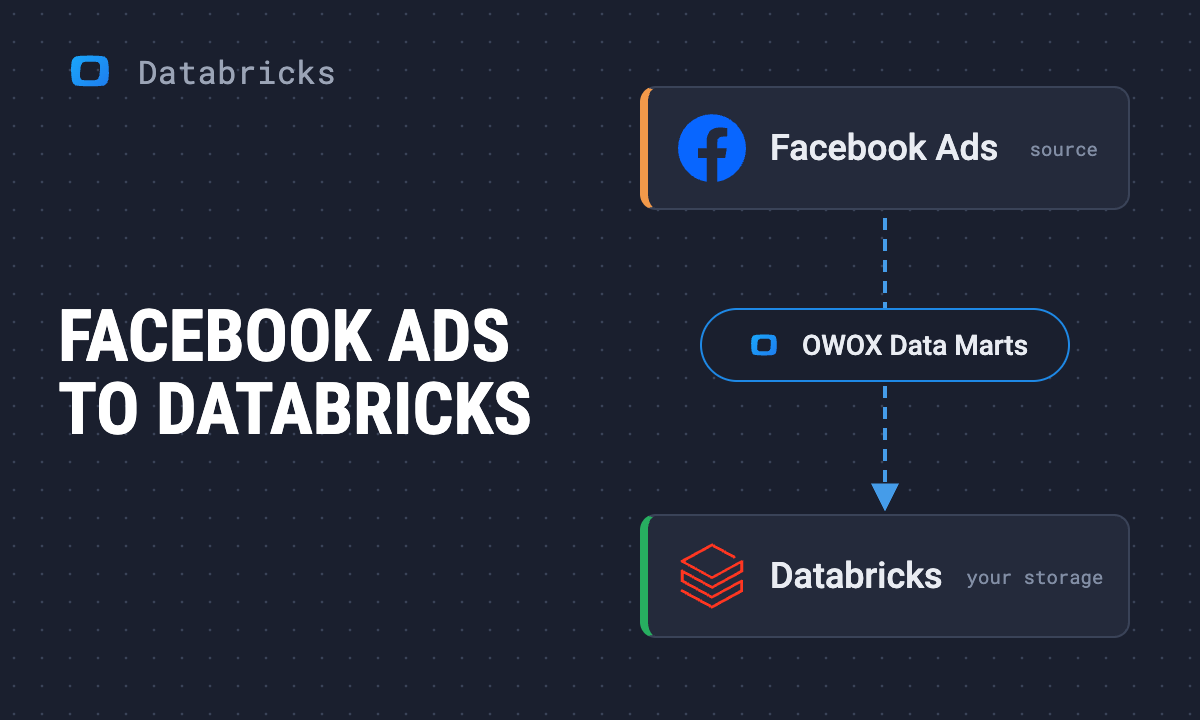 Article · DatabricksHow to connect Facebook Ads to Databricks, step by step
 Article · DatabricksHow to connect Google Ads to Databricks, step by step
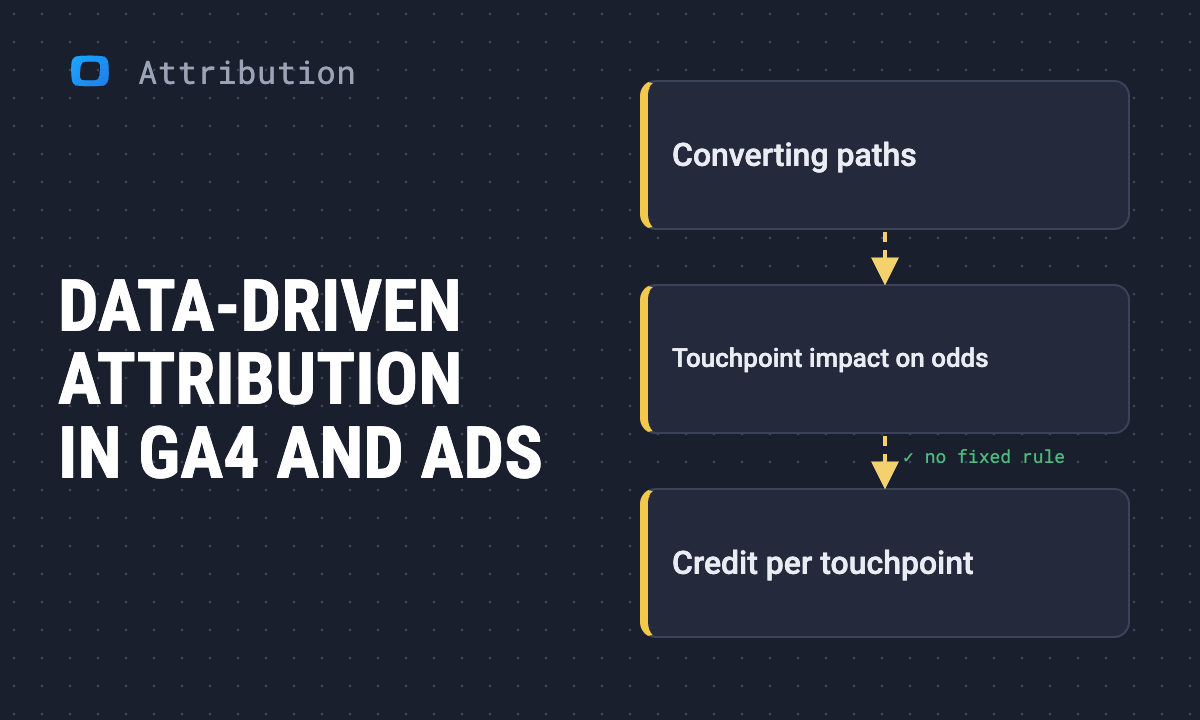 Article · Marketing AttributionData-driven attribution: how Google's model works in GA4, Google Ads and Search Ads 360
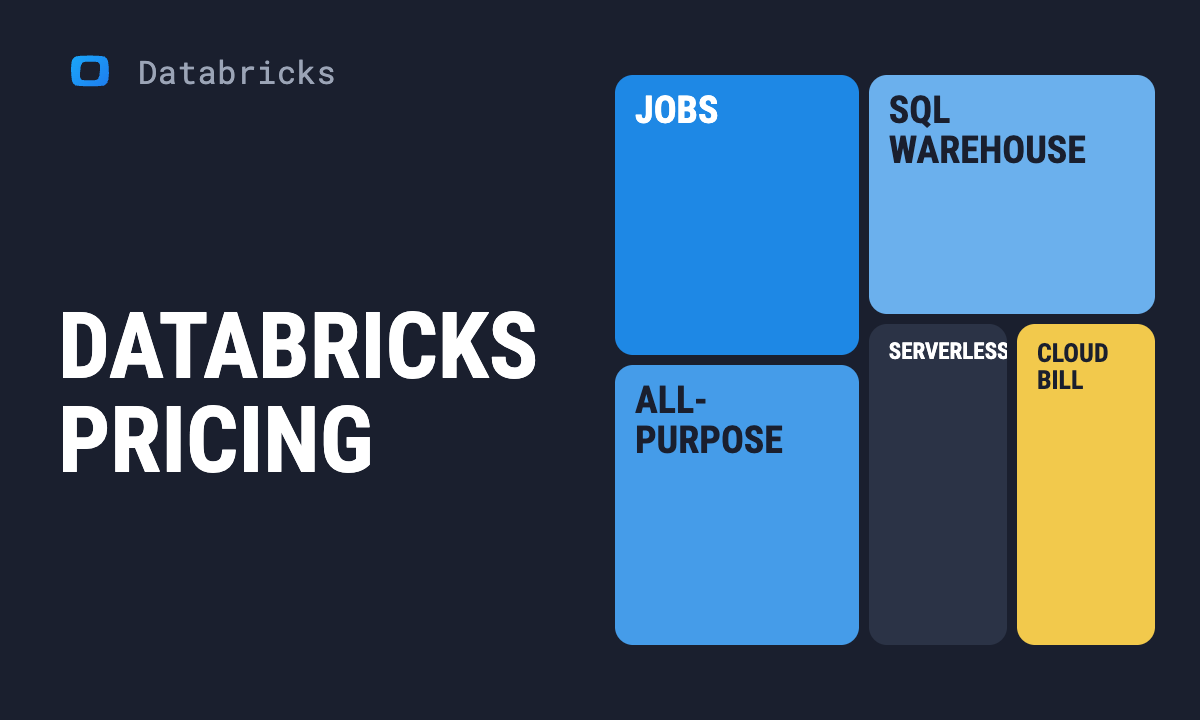 Article · DatabricksDatabricks pricing explained: DBU rates, compute types and what drives your bill
 Article · DatabricksHow to connect Databricks to Google Sheets, without CSV exports
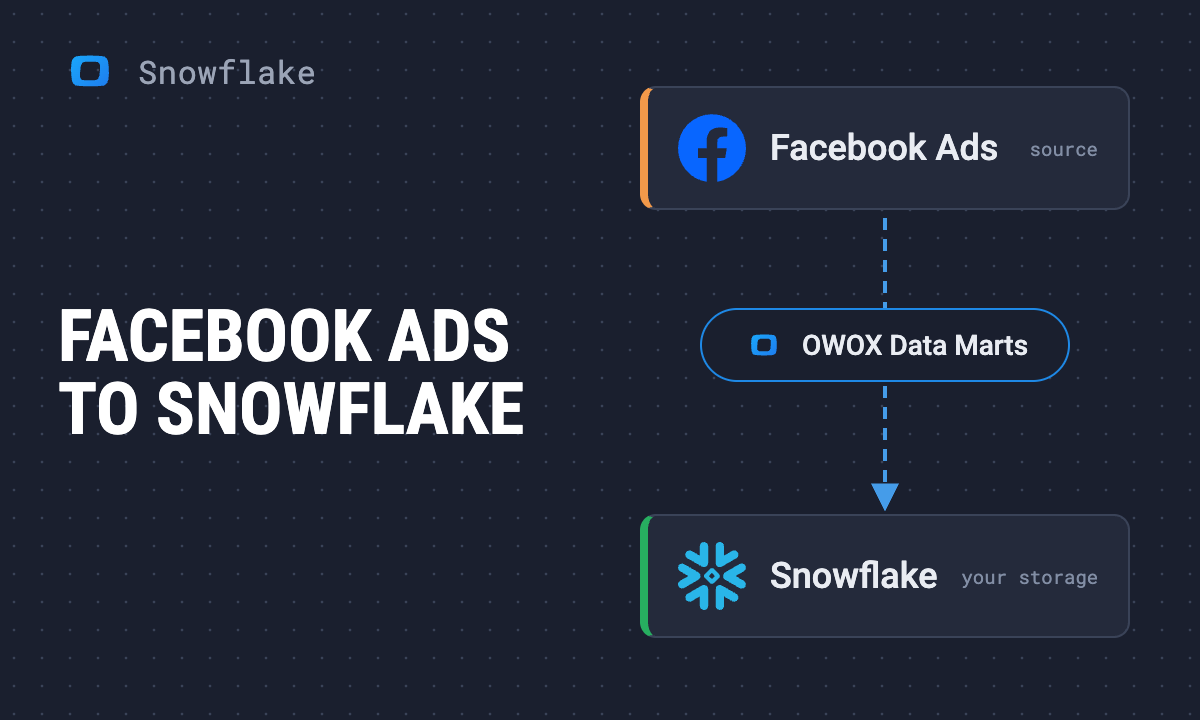 Article · SnowflakeHow to load Facebook Ads data into Snowflake with OWOX Data Marts
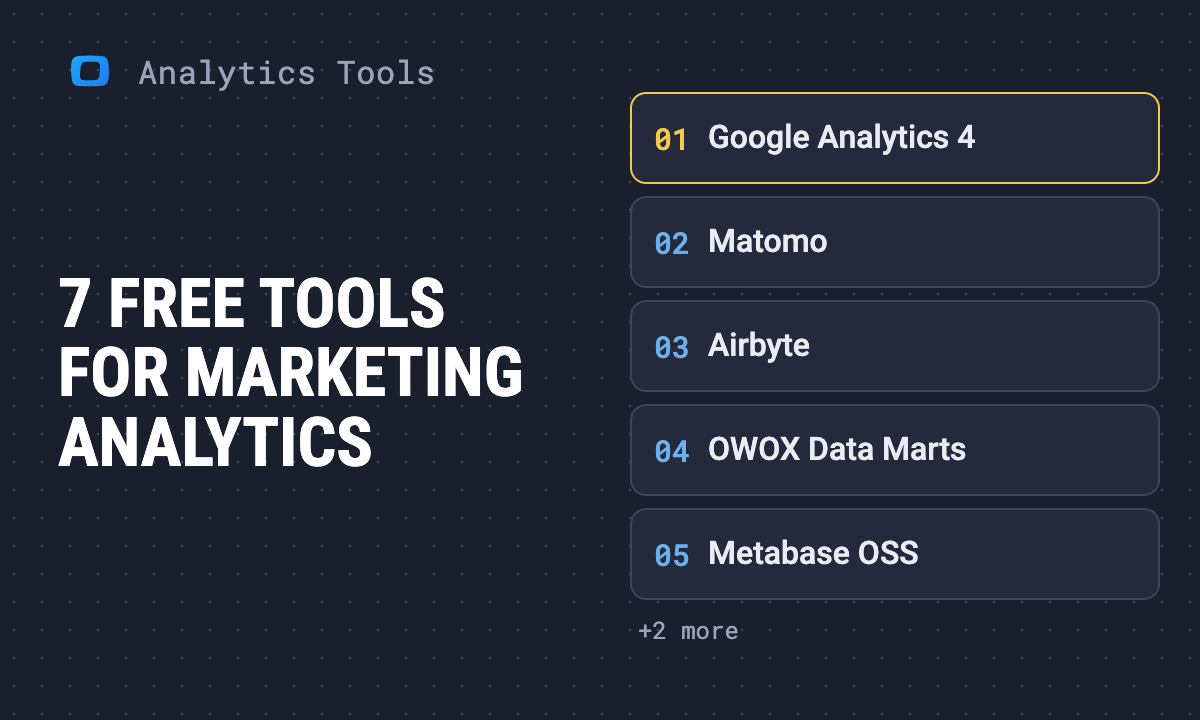 Article · Analytics ToolsBest marketing analytics tools in 2026: free and open-source first
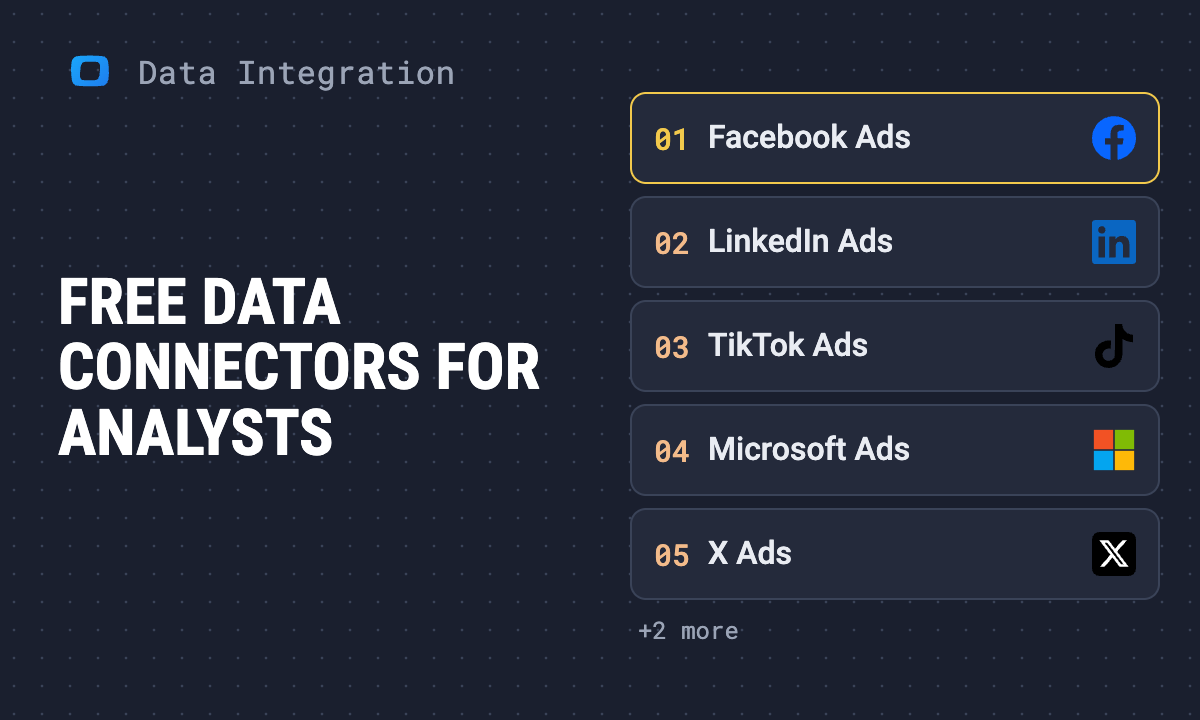 Article · Data IntegrationWhy we built free data connectors for analysts
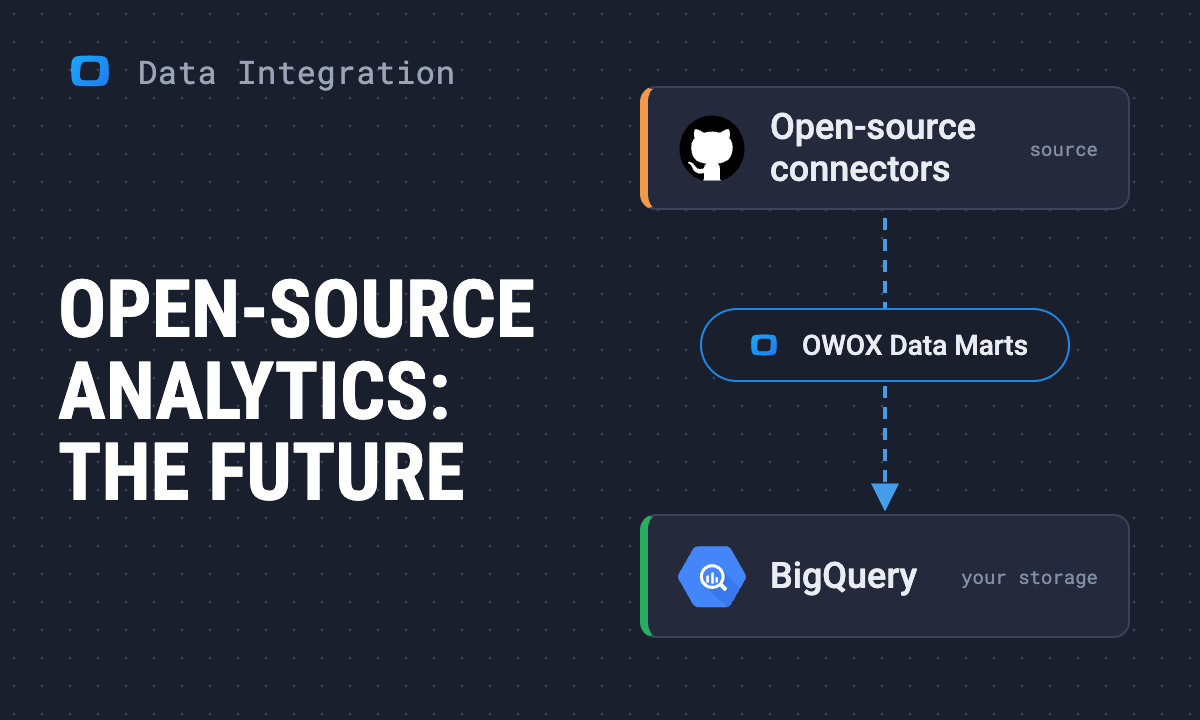 Article · Data IntegrationWhy open-source analytics is the future for analysts
 Article · SnowflakeHow to load Google Ads data into Snowflake with OWOX Data Marts
 Article · DatabricksHow to connect LinkedIn Ads to Databricks, step by step
 Article · DatabricksHow to connect TikTok Ads to Databricks, step by step
 Article · Marketing AttributionCustom attribution models: when the standard ones are wrong and how to build your own
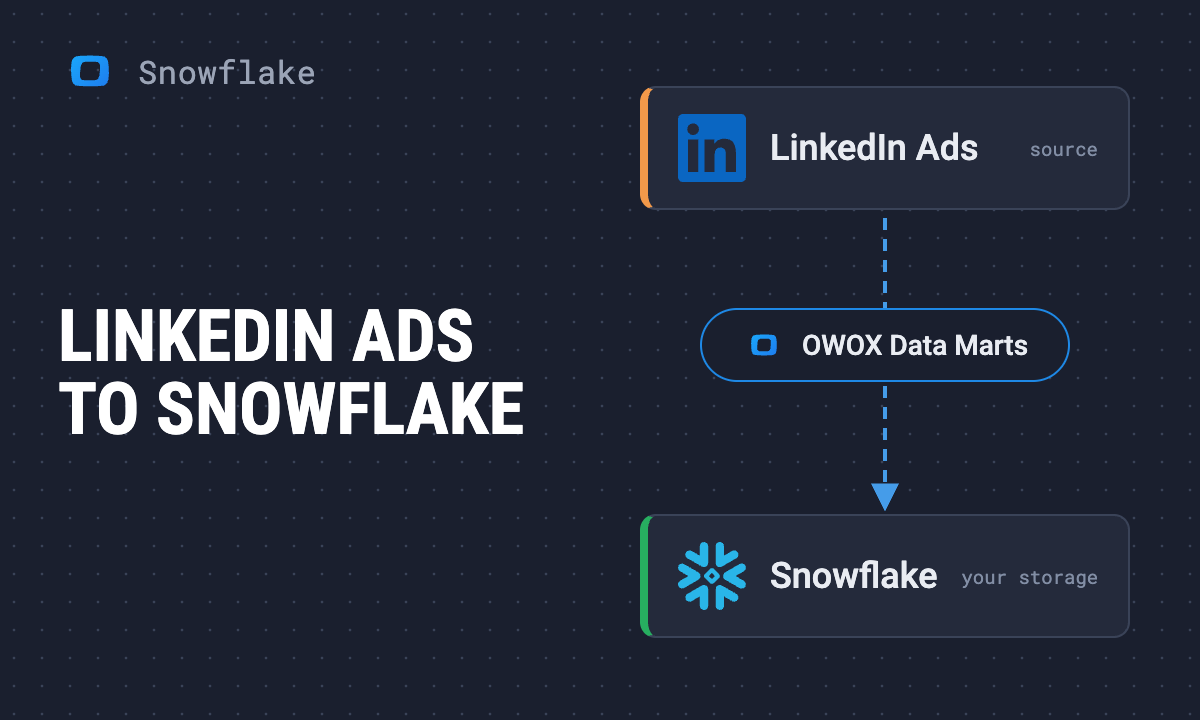 Article · SnowflakeHow to load LinkedIn Ads data into Snowflake with OWOX Data Marts
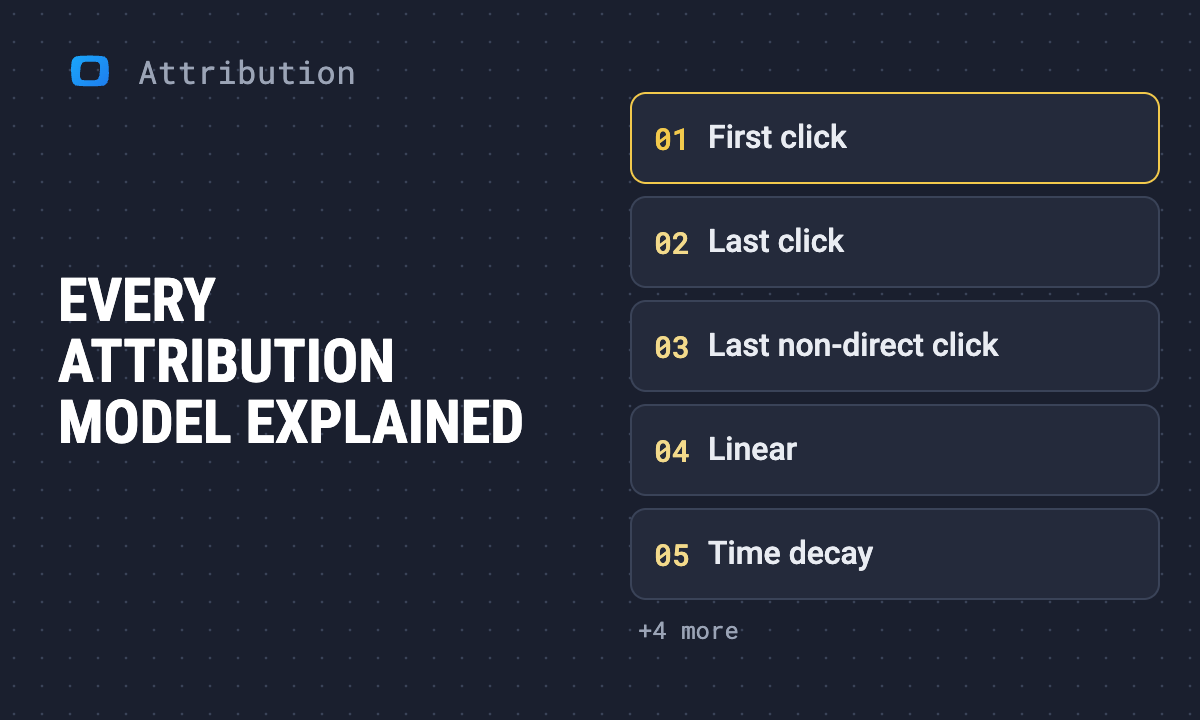 Article · Marketing AttributionMarketing attribution models: how each one works and how to build your own
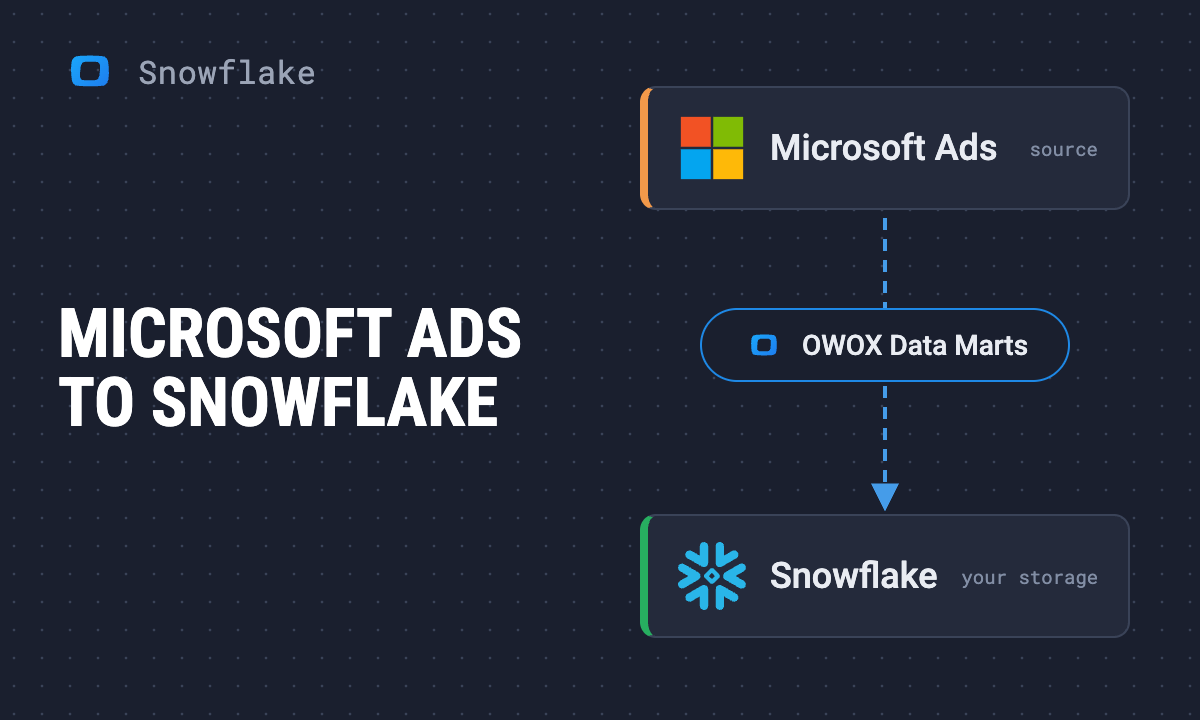 Article · SnowflakeHow to load Microsoft Ads data into Snowflake with OWOX Data Marts
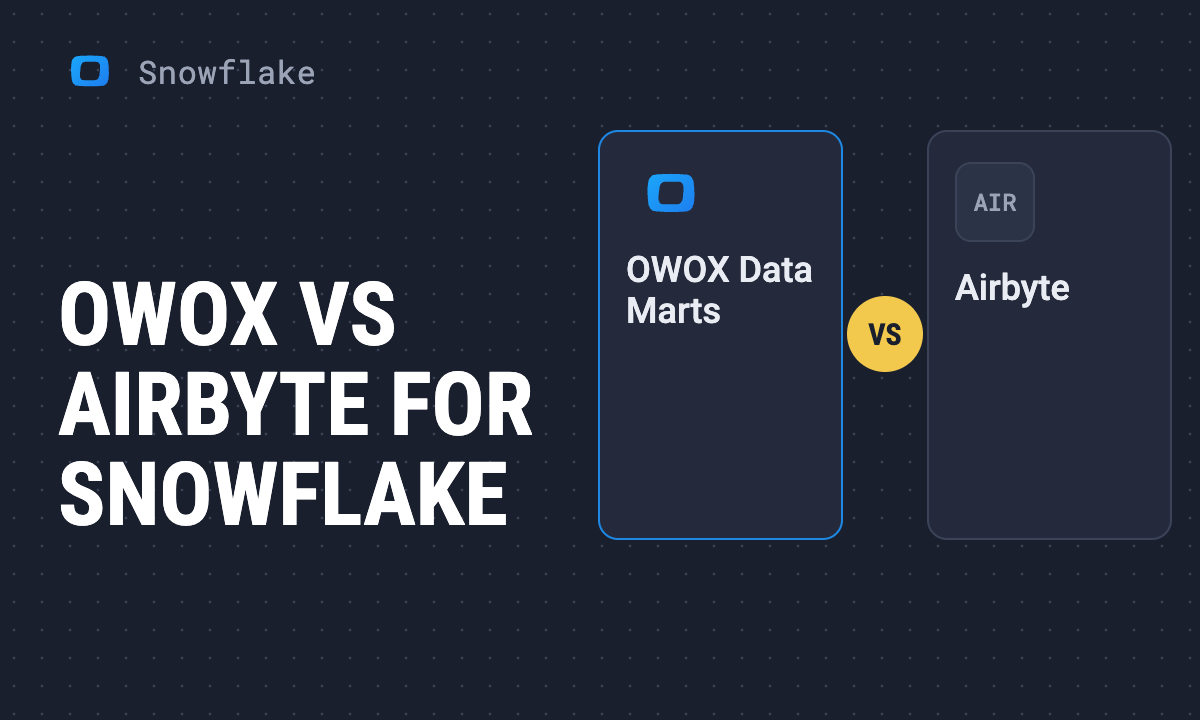 Article · SnowflakeOWOX Data Marts vs Airbyte for Snowflake: what each one does
 Article · Data IntegrationOWOX Data Marts vs Supermetrics vs Airbyte: which one fits your marketing data
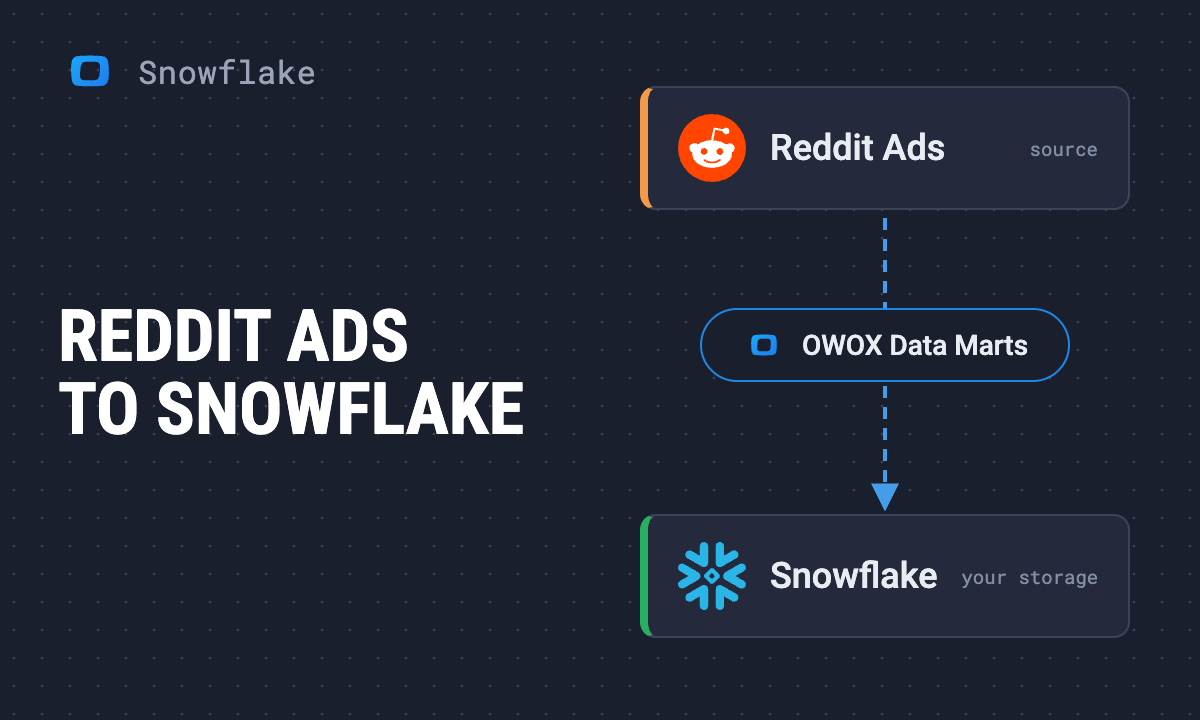 Article · SnowflakeHow to load Reddit Ads data into Snowflake with OWOX Data Marts
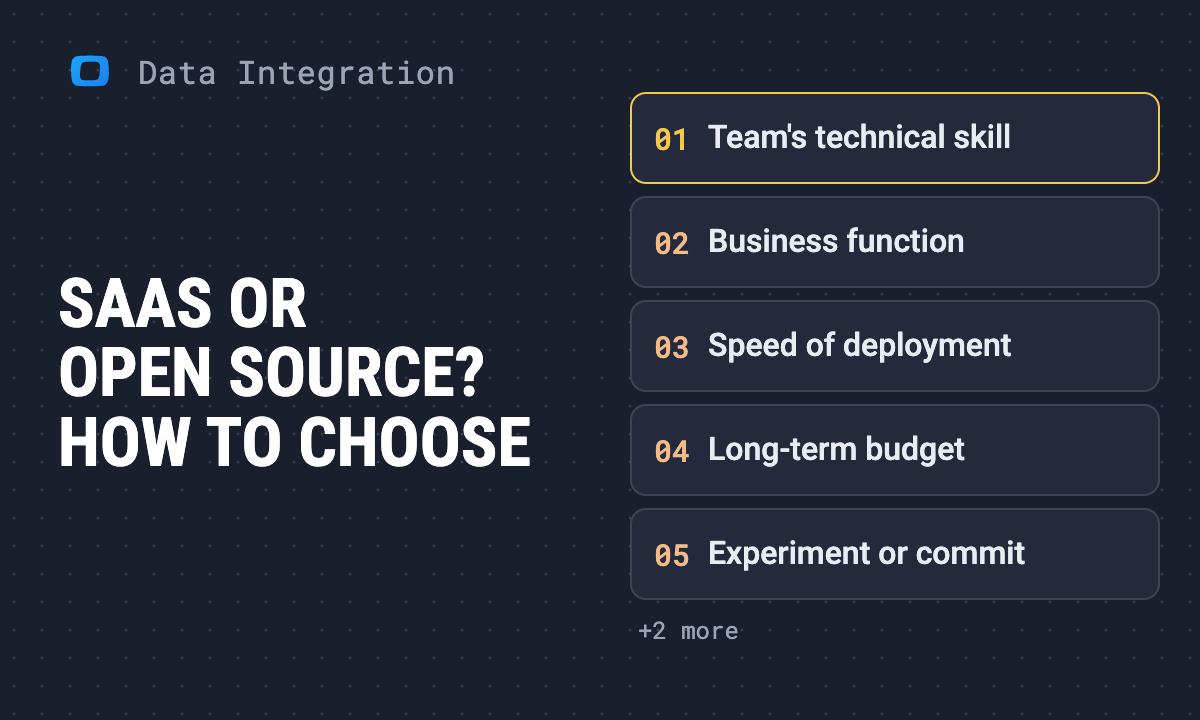 Article · Data IntegrationSaaS vs open source for data connectivity: how to choose
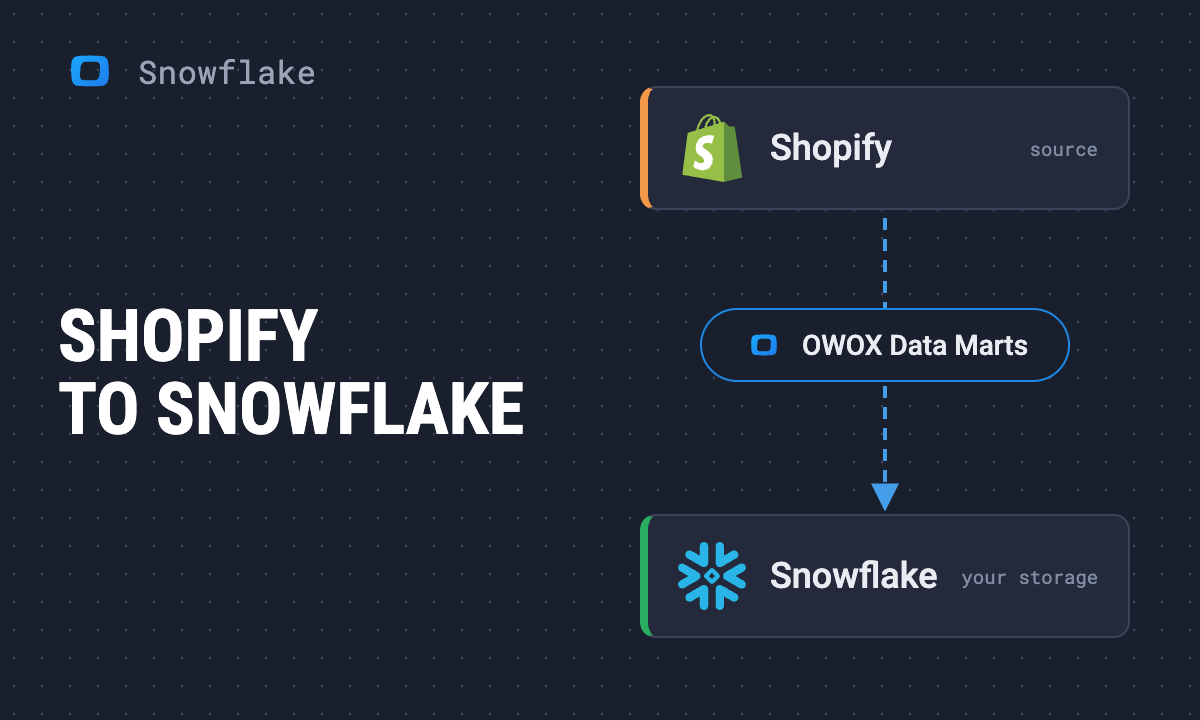 Article · SnowflakeHow to load Shopify data into Snowflake with OWOX Data Marts
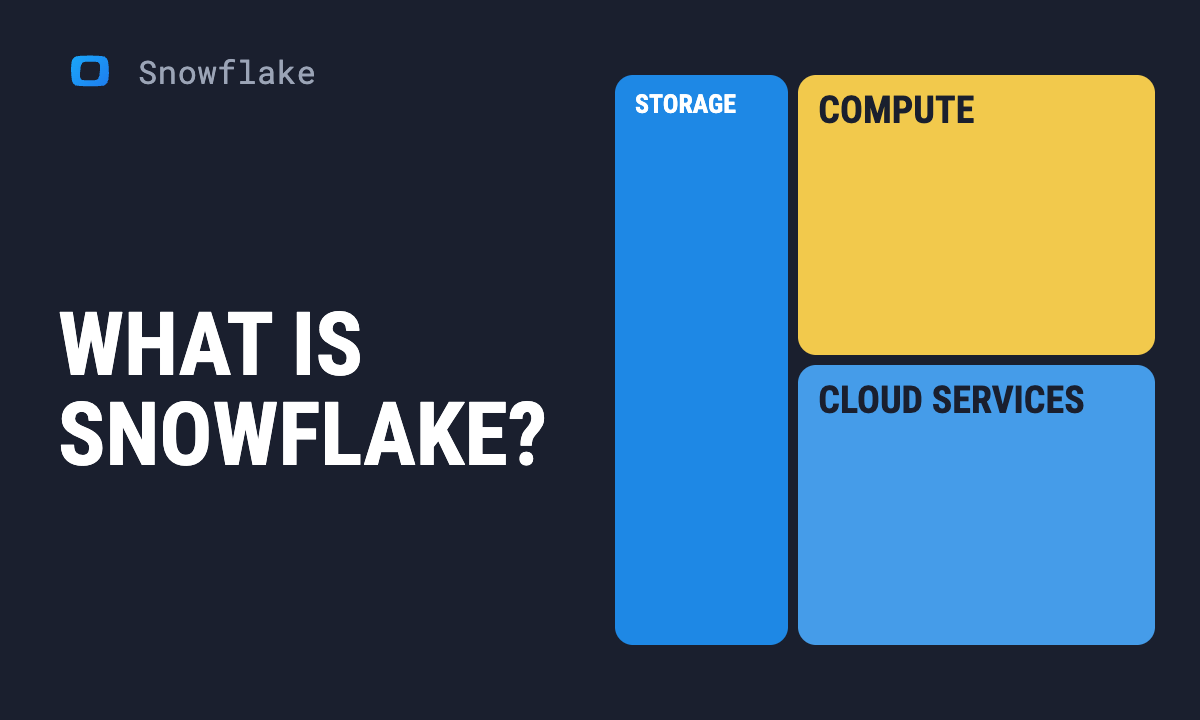 Article · SnowflakeWhat is Snowflake? A beginner's guide to the cloud data warehouse
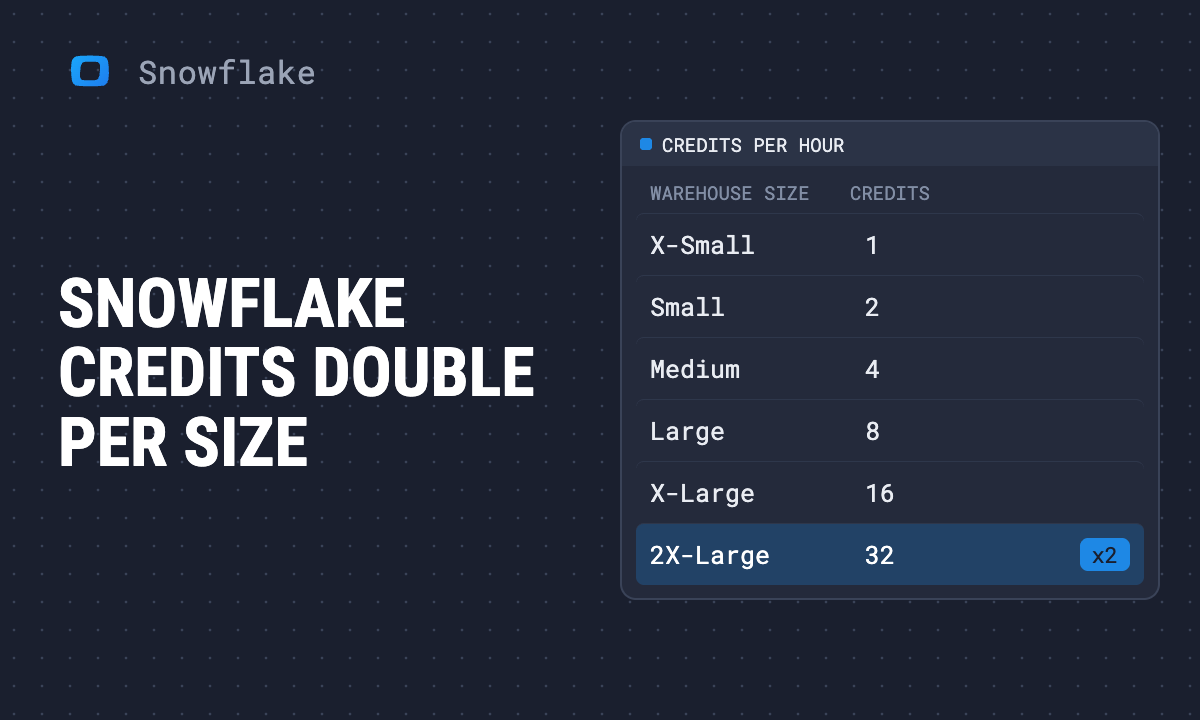 Article · SnowflakeSnowflake pricing explained: credits, warehouse sizes and storage costs
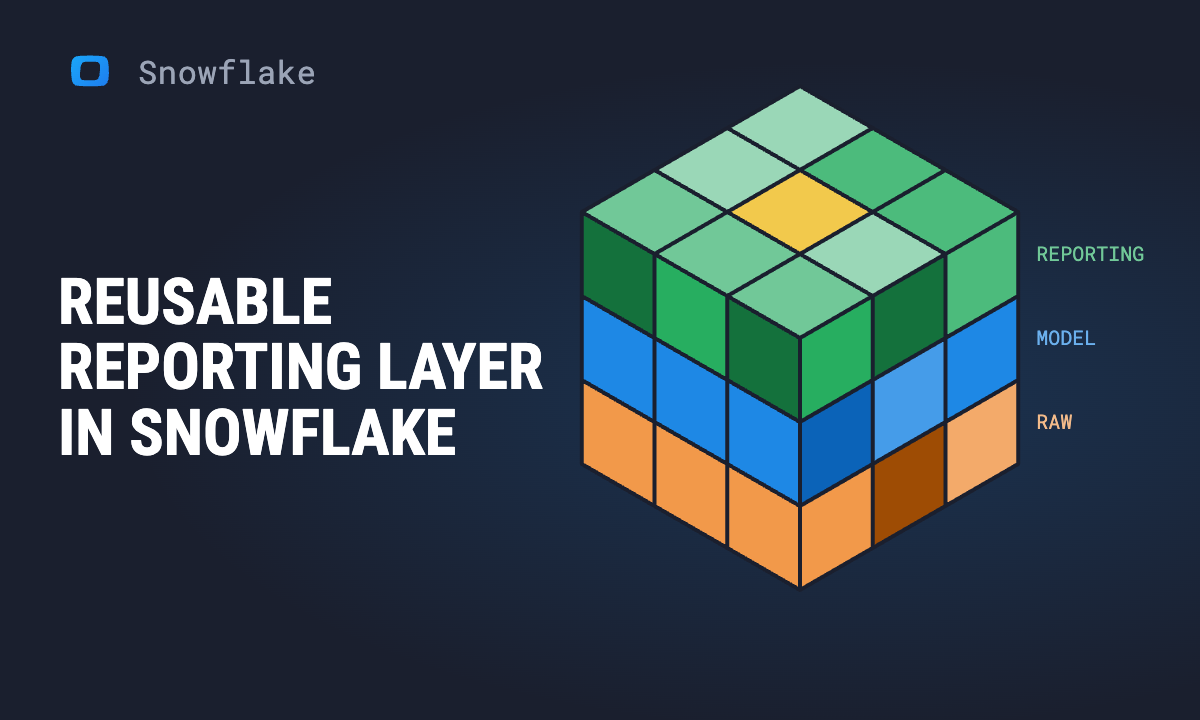 Article · SnowflakeSnowflake for data analysts: how to turn your warehouse into a reusable reporting layer
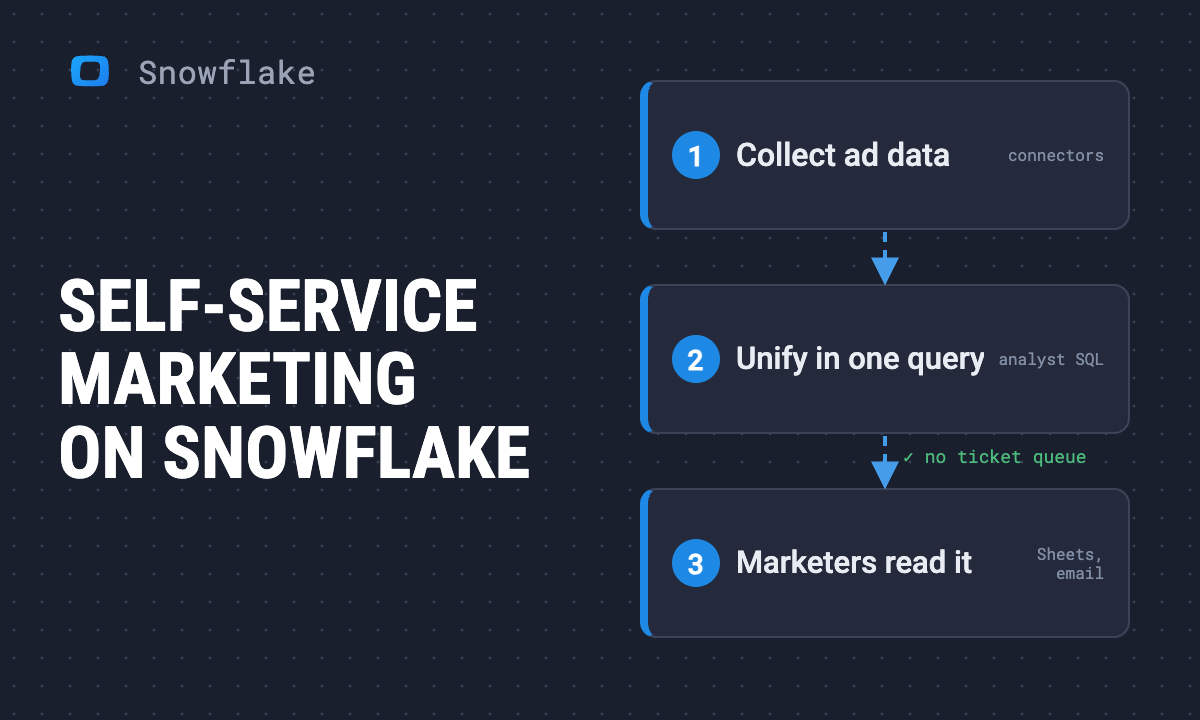 Article · SnowflakeHow to turn Snowflake into a self-service marketing analytics engine
 Article · SnowflakeHow to load TikTok Ads data into Snowflake with OWOX Data Marts
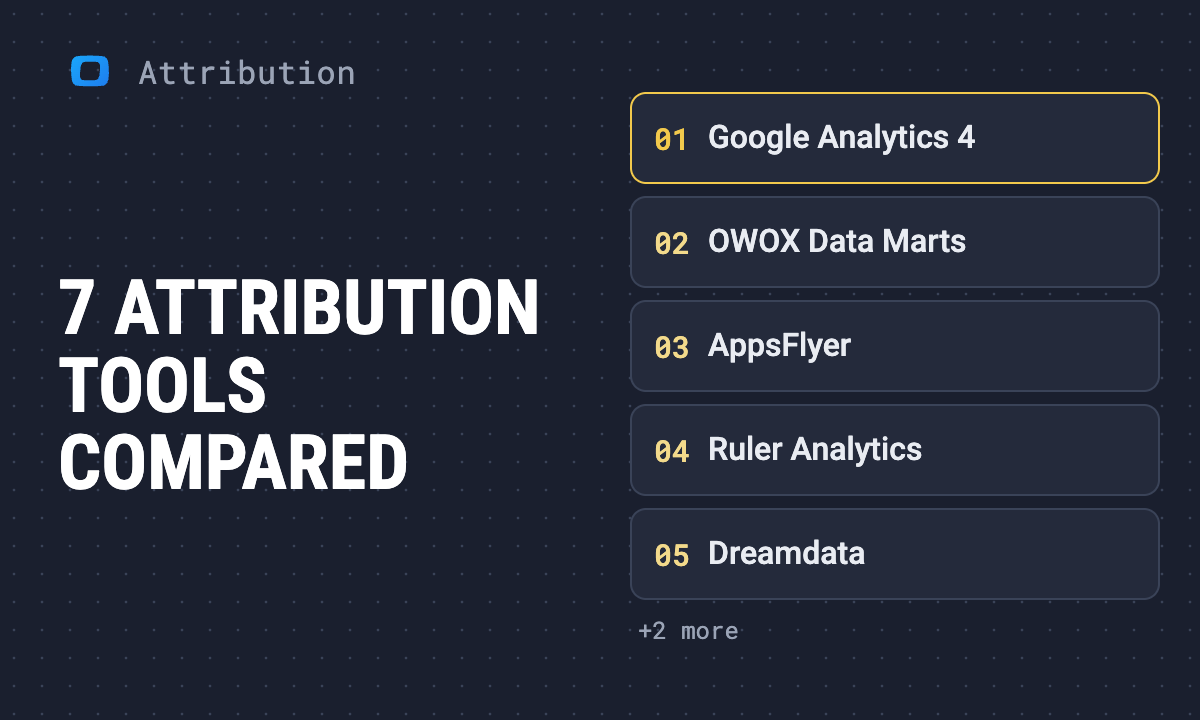 Article · Marketing AttributionBest marketing attribution software in 2026: seven tools compared
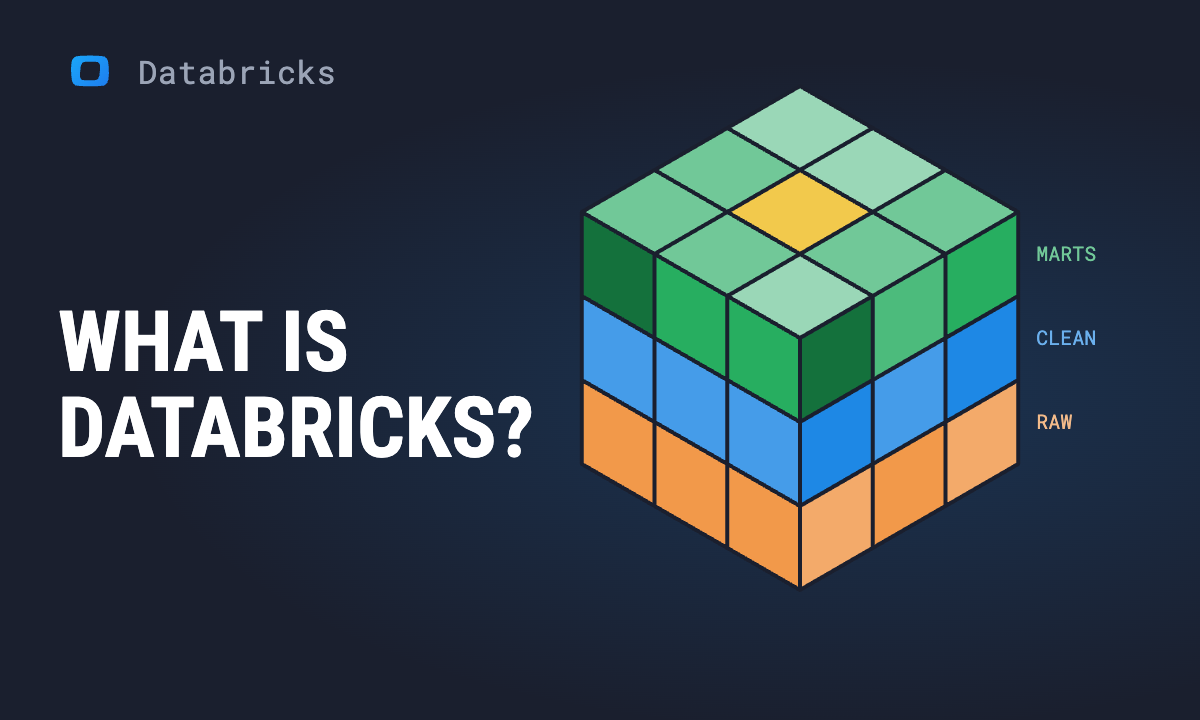 Article · DatabricksWhat is Databricks and how does it work?
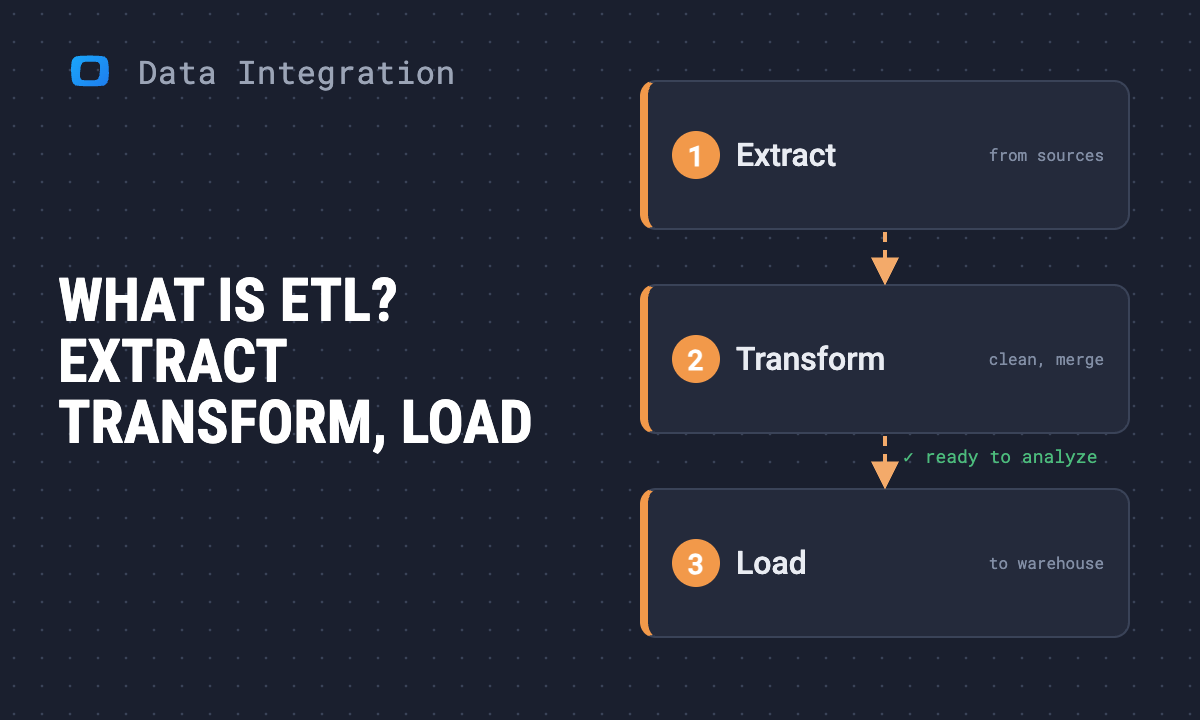 Article · Data IntegrationWhat is ETL? The process, pipelines, ETL vs ELT and how to choose a tool
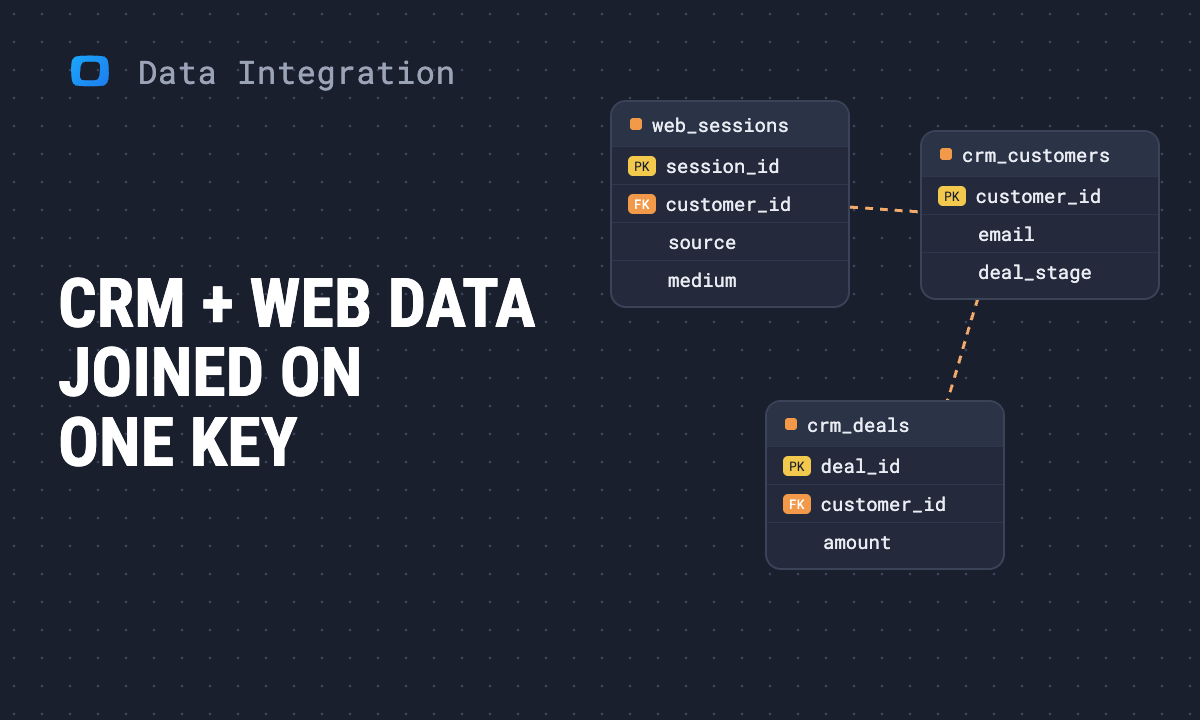 Article · Data IntegrationCRM and digital marketing data integration: a practical guide
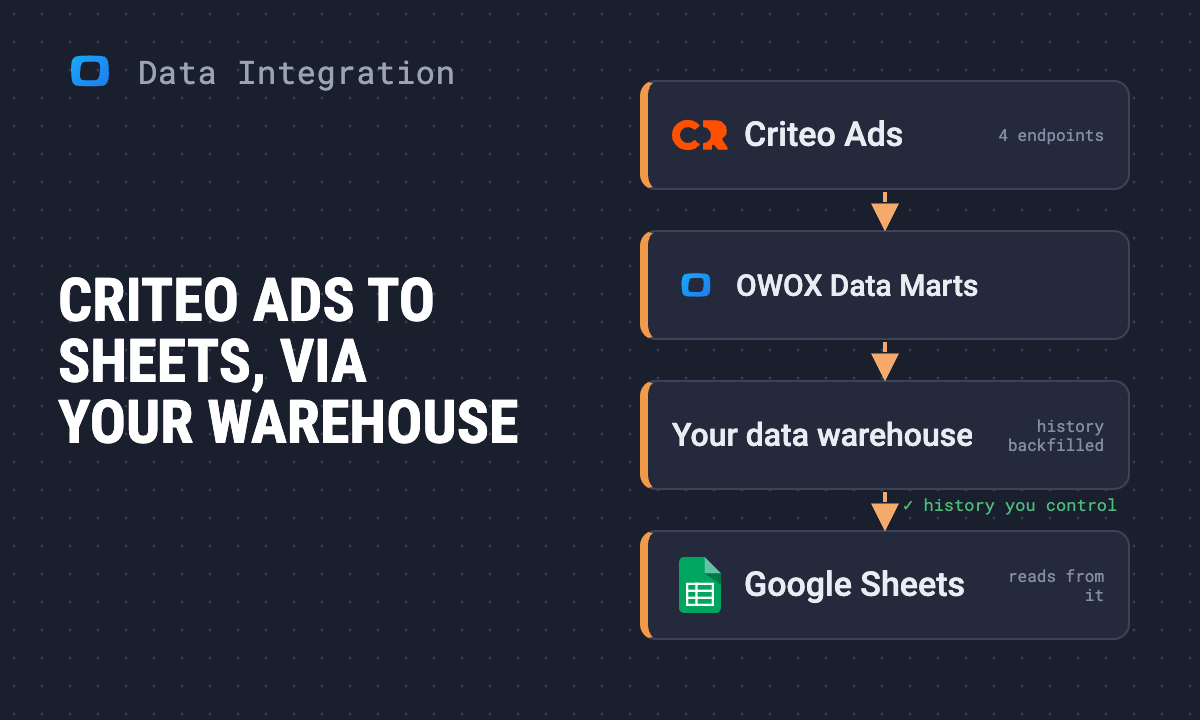 Article · Data IntegrationHow to connect Criteo Ads to Google Sheets with OWOX Data Marts
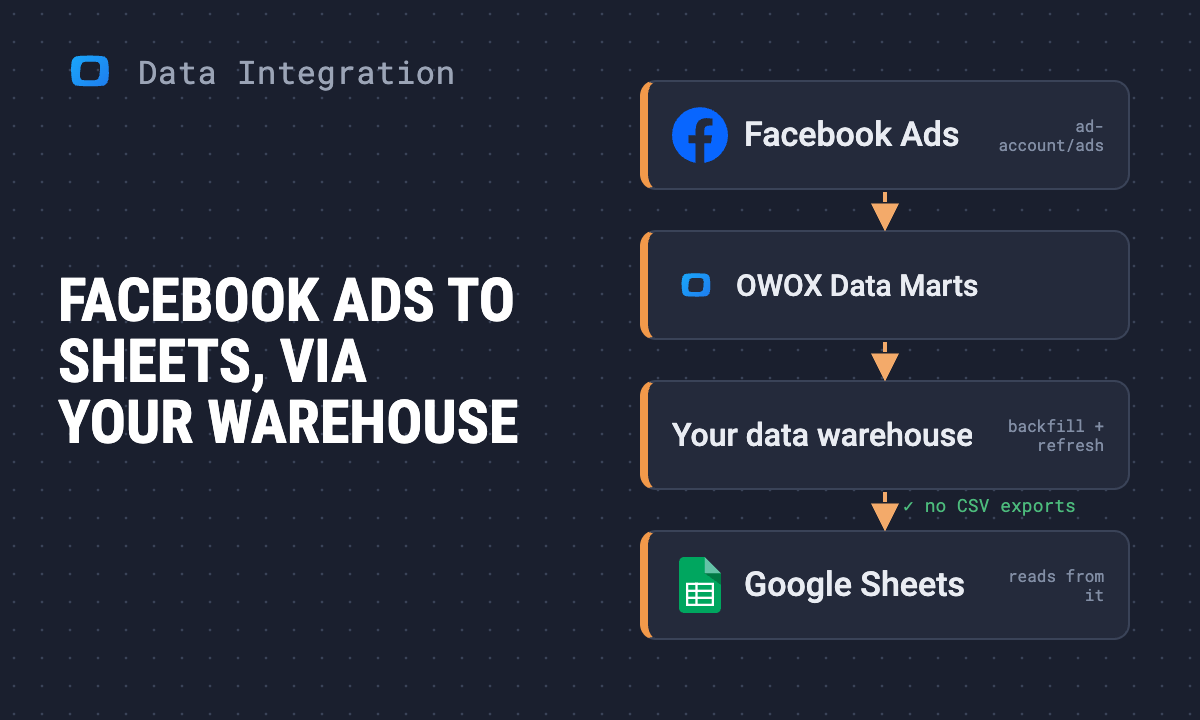 Article · Data IntegrationHow to connect Facebook Ads to Google Sheets with OWOX Data Marts
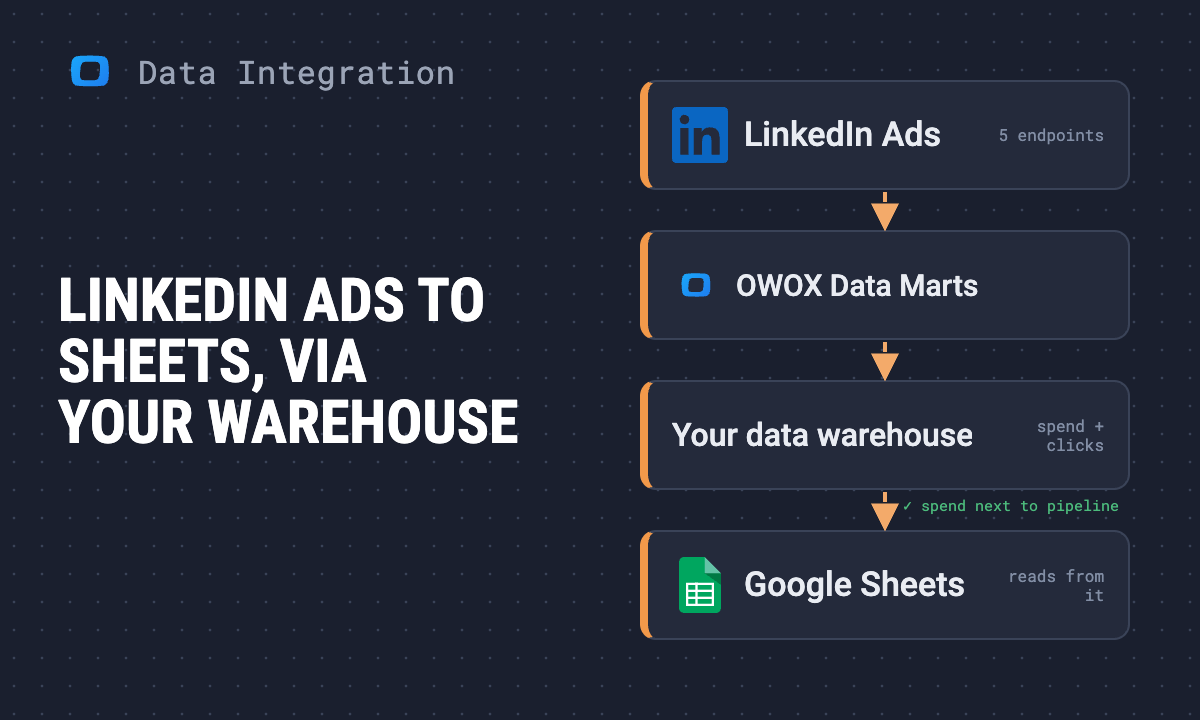 Article · Data IntegrationHow to connect LinkedIn Ads to Google Sheets with OWOX Data Marts
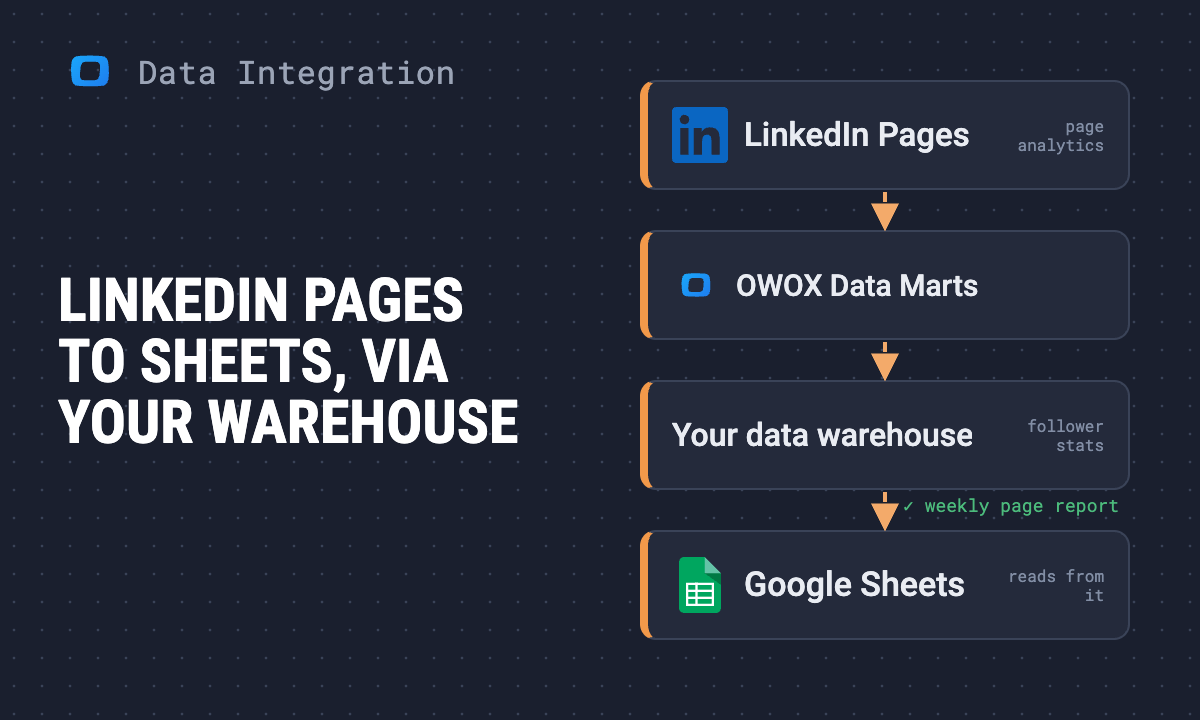 Article · Data IntegrationHow to connect LinkedIn Pages (company page analytics) to Google Sheets with OWOX Data Marts
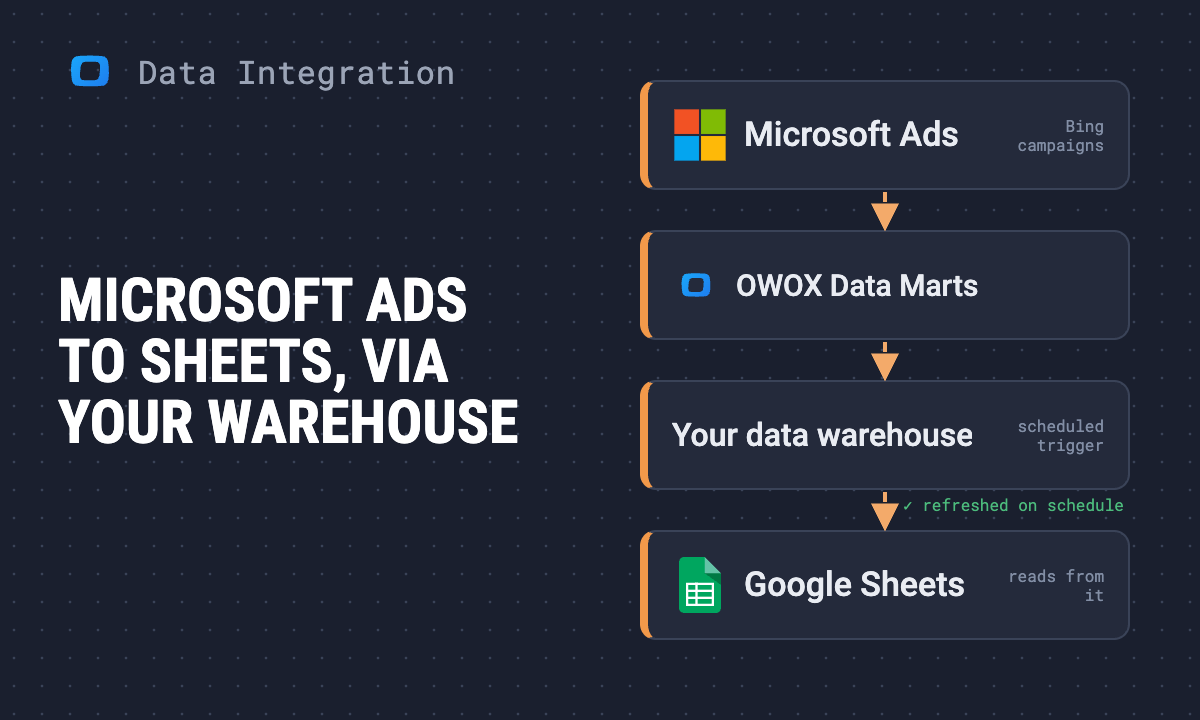 Article · Data IntegrationHow to connect Microsoft Ads (Bing Ads) to Google Sheets with OWOX Data Marts
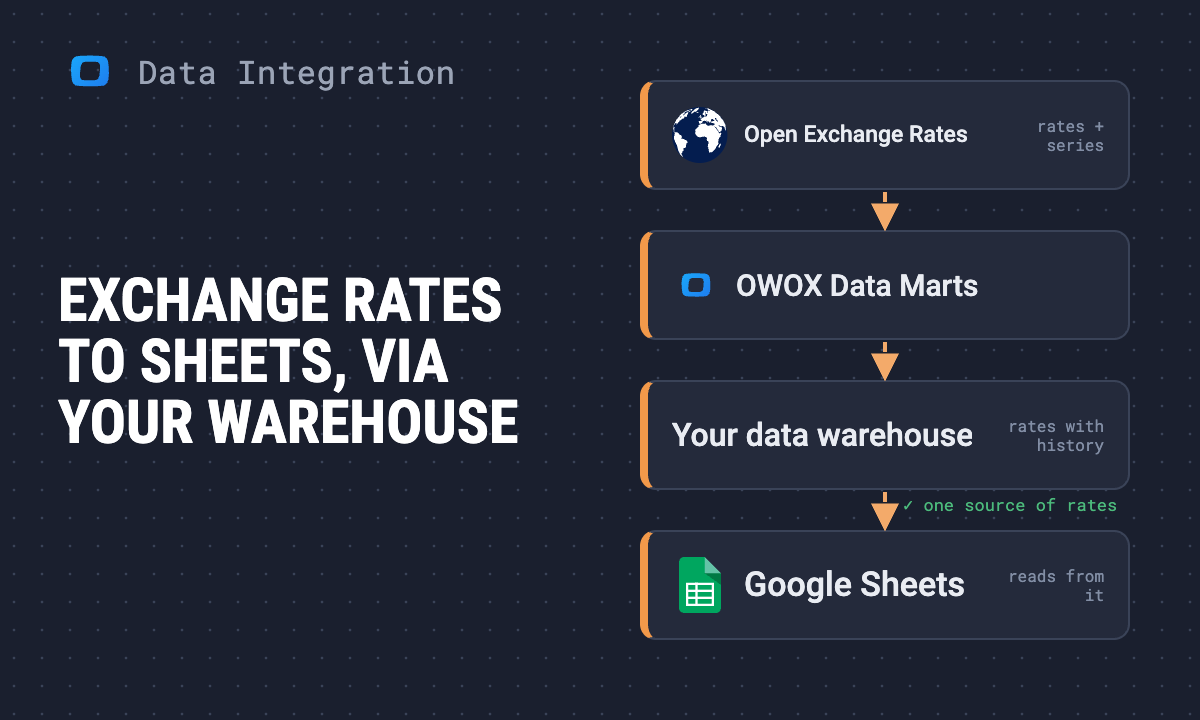 Article · Data IntegrationHow to connect Open Exchange Rates to Google Sheets with OWOX Data Marts
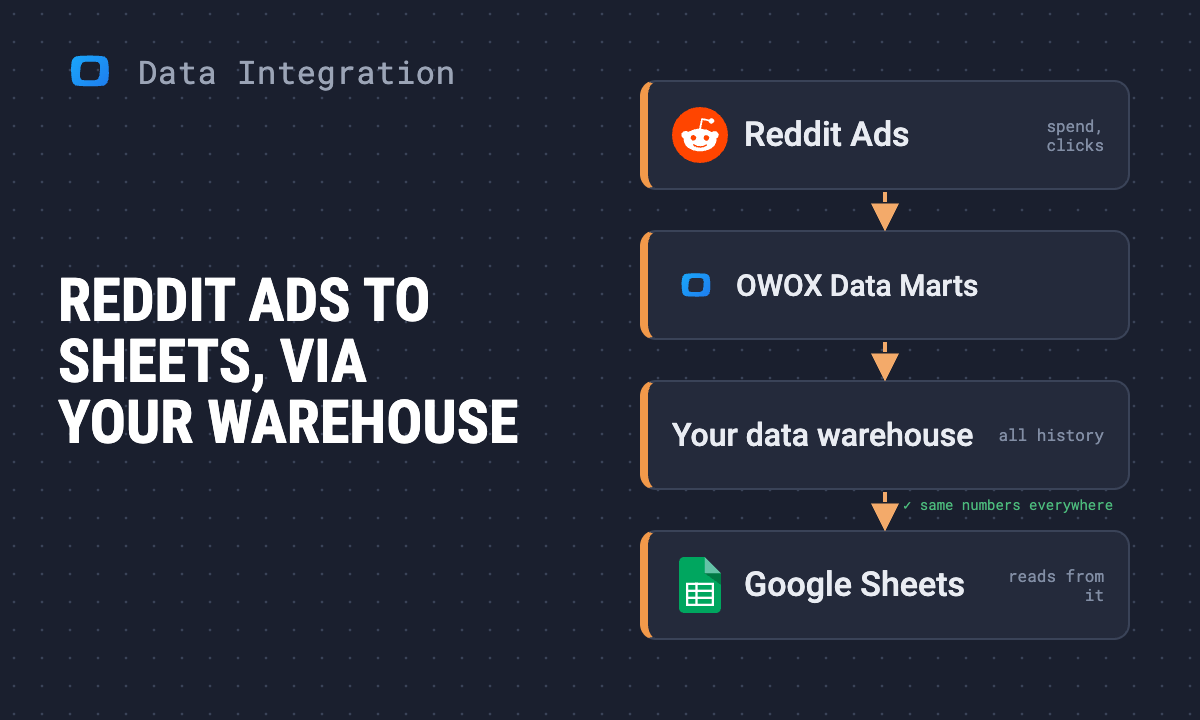 Article · Data IntegrationHow to connect Reddit Ads to Google Sheets with OWOX Data Marts
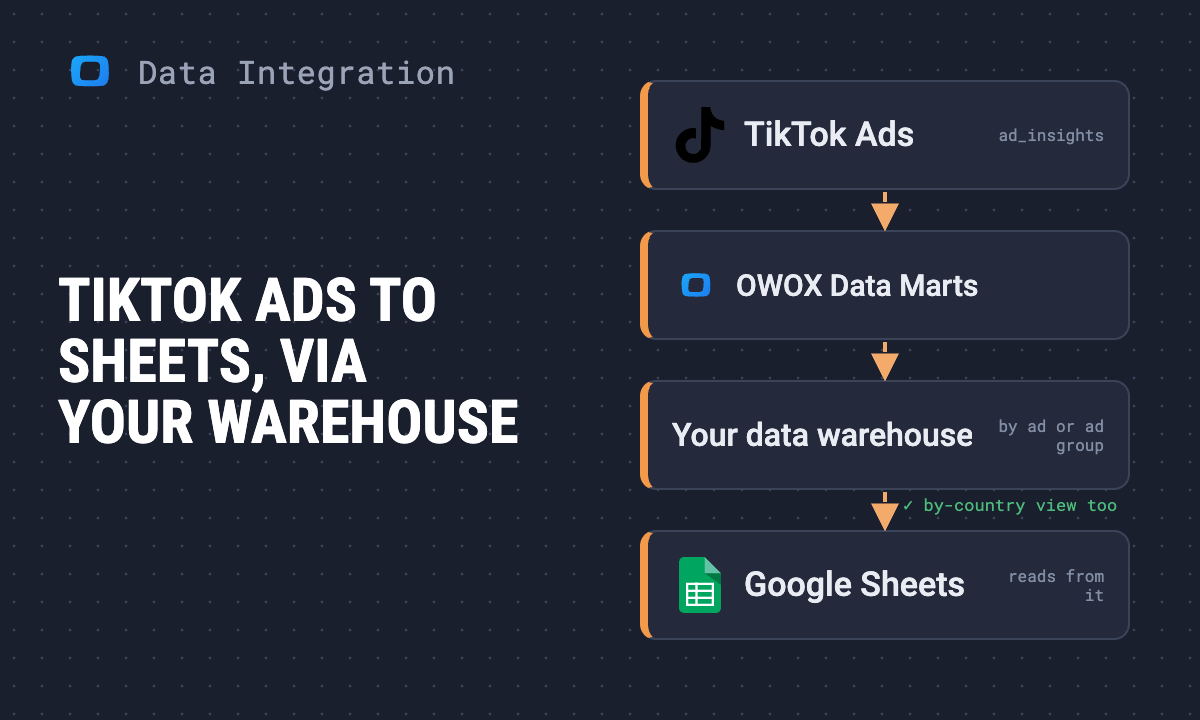 Article · Data IntegrationHow to connect TikTok Ads to Google Sheets with OWOX Data Marts
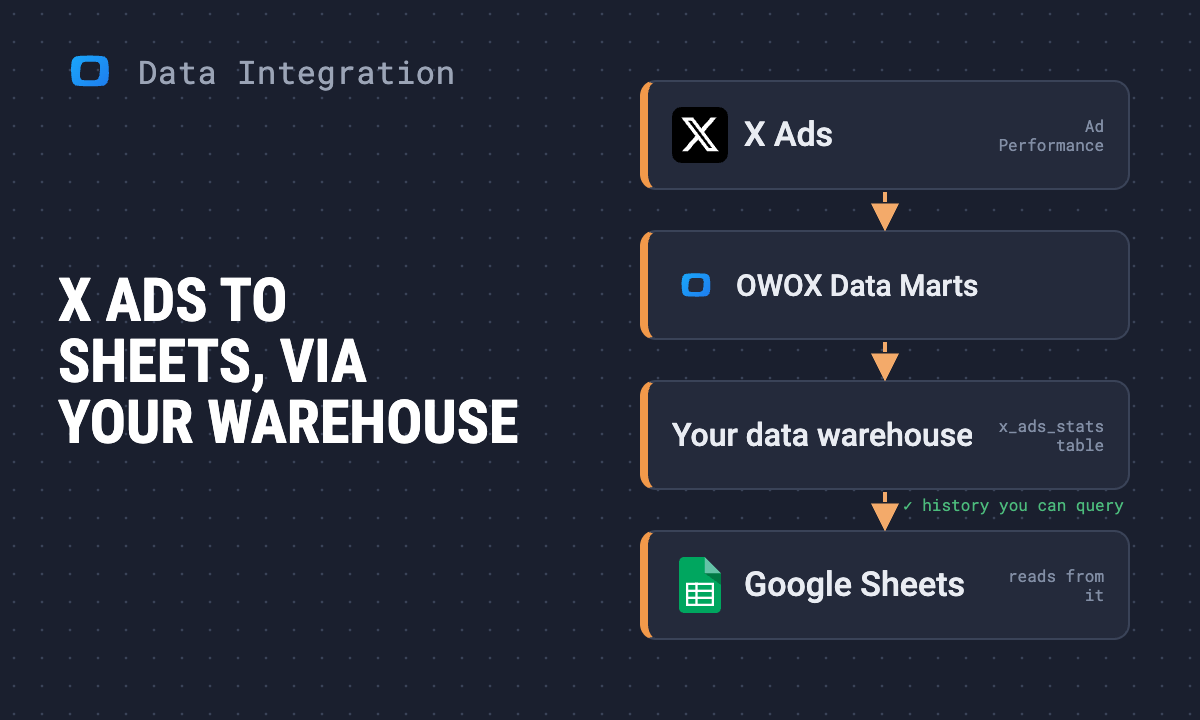 Article · Data IntegrationHow to connect X Ads (Twitter Ads) to Google Sheets with OWOX Data Marts
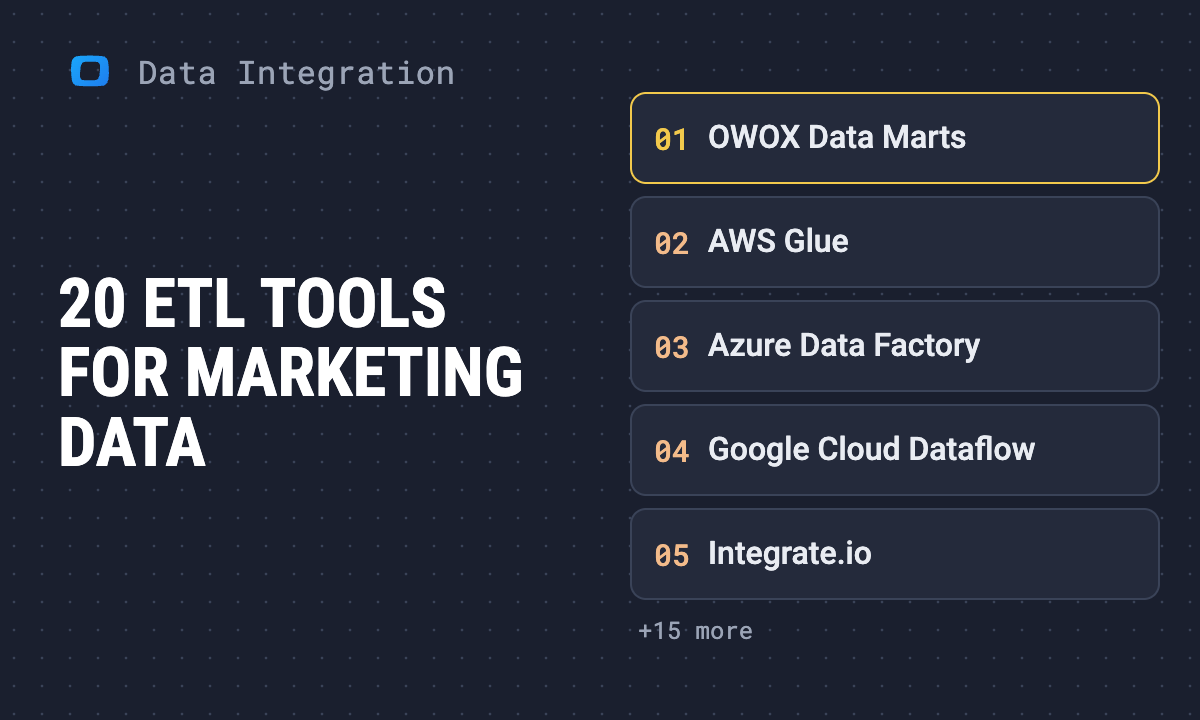 Article · Data IntegrationTop 20 ETL tools for marketing in 2026
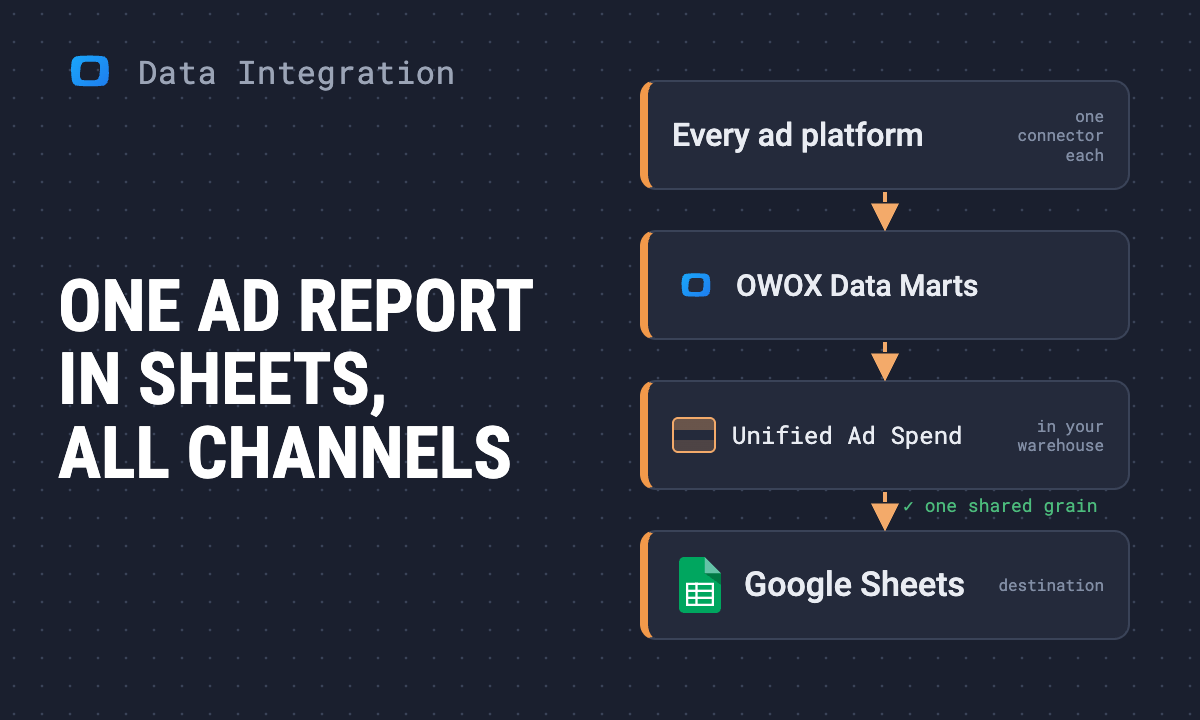 Article · Data IntegrationHow to build a unified ad report in Google Sheets with OWOX Data Marts
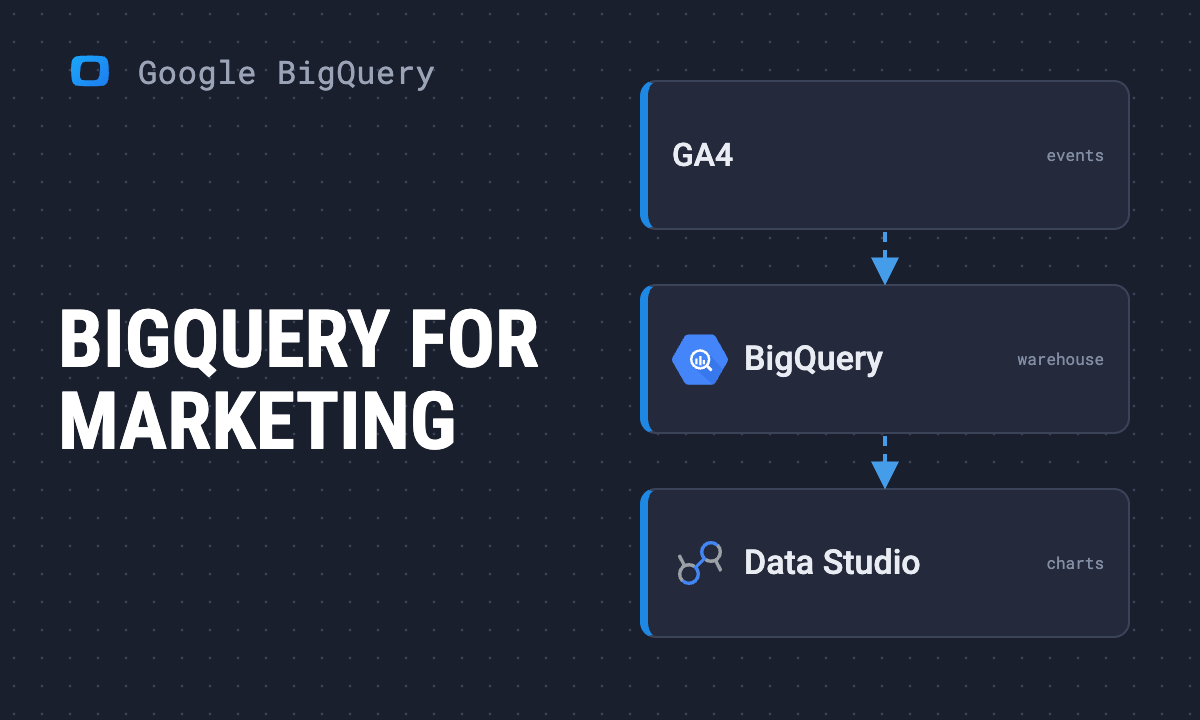 Article · Google BigQueryBigQuery for marketing analytics: What changed in 2026
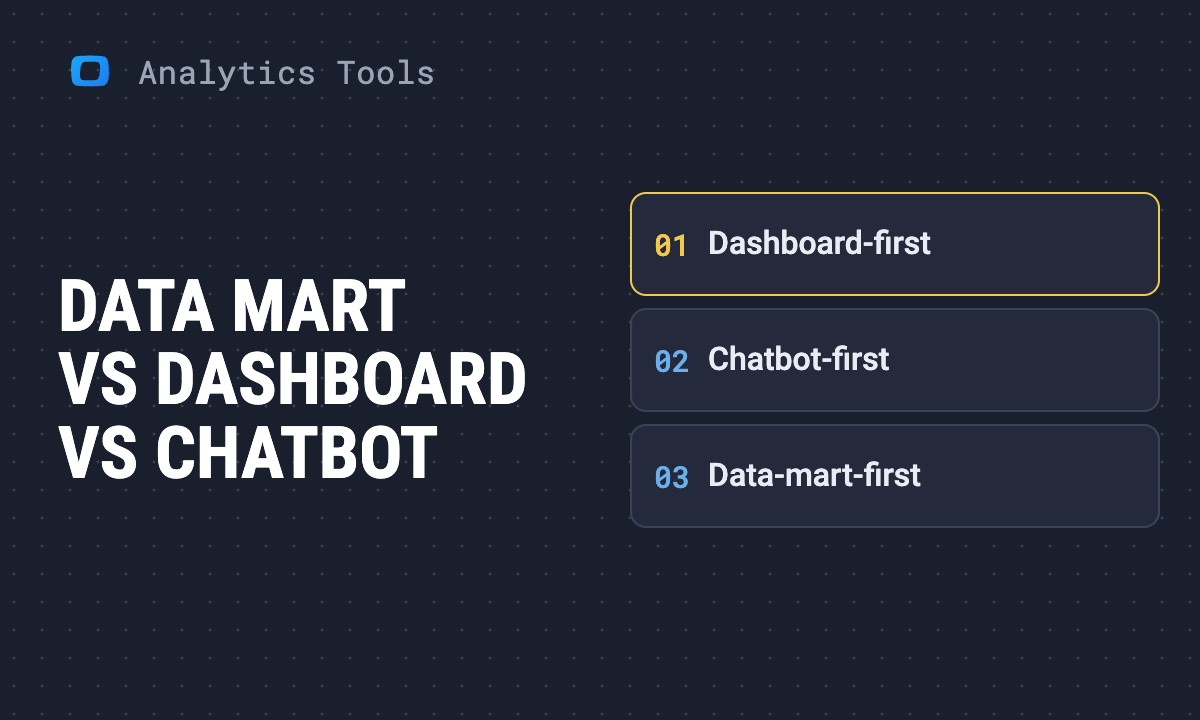 Article · Analytics ToolsData Mart vs Dashboard vs Chatbots: Which Analytics Architecture Actually Wins?
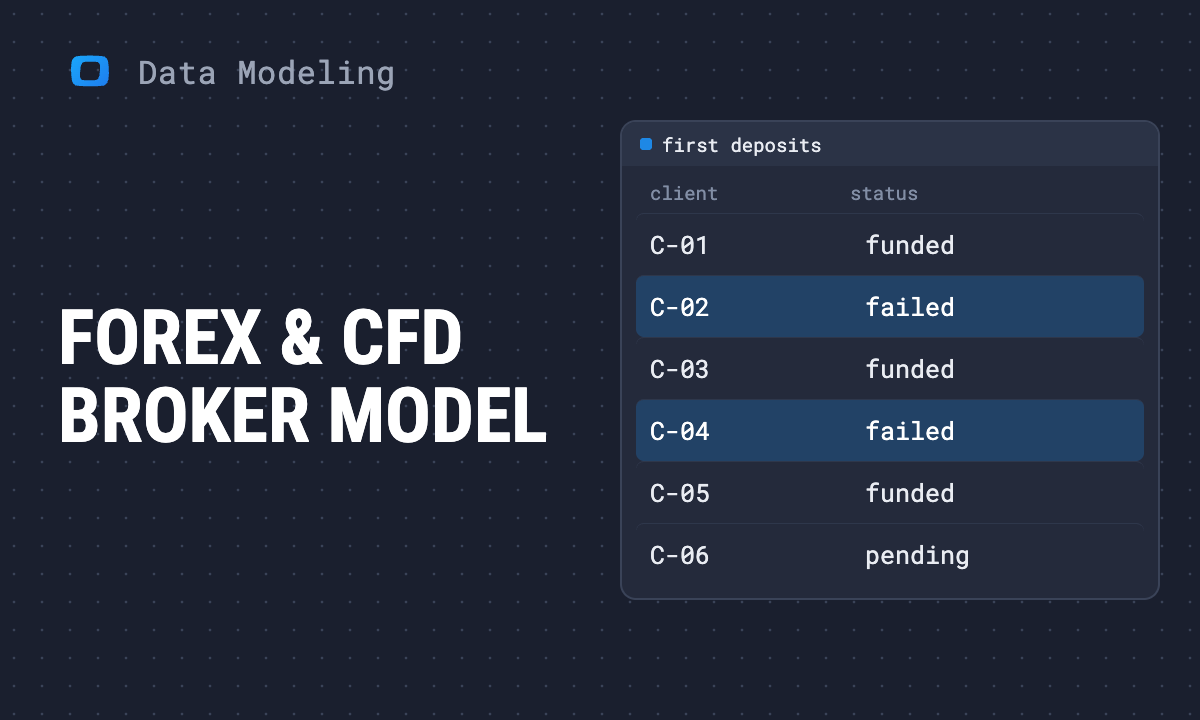 Article · Data ModelingForex & CFD Broker Data Model: Free Template
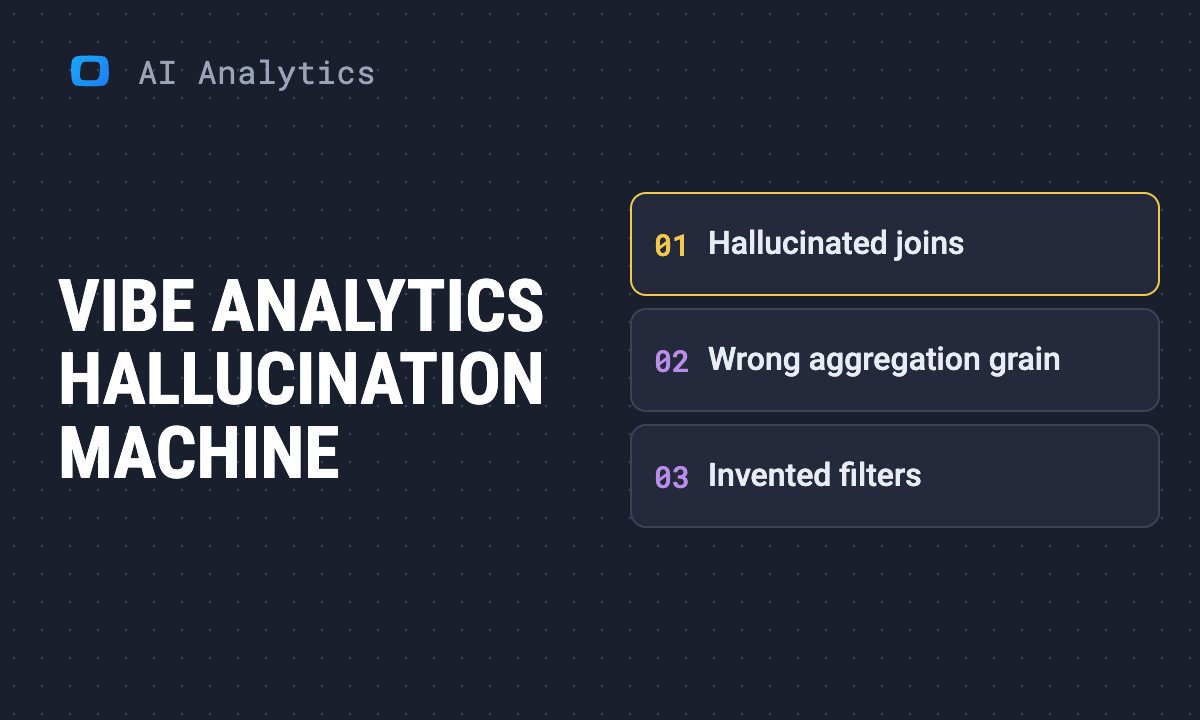 Article · AI in AnalyticsVibe Analytics is a Hallucination Machine
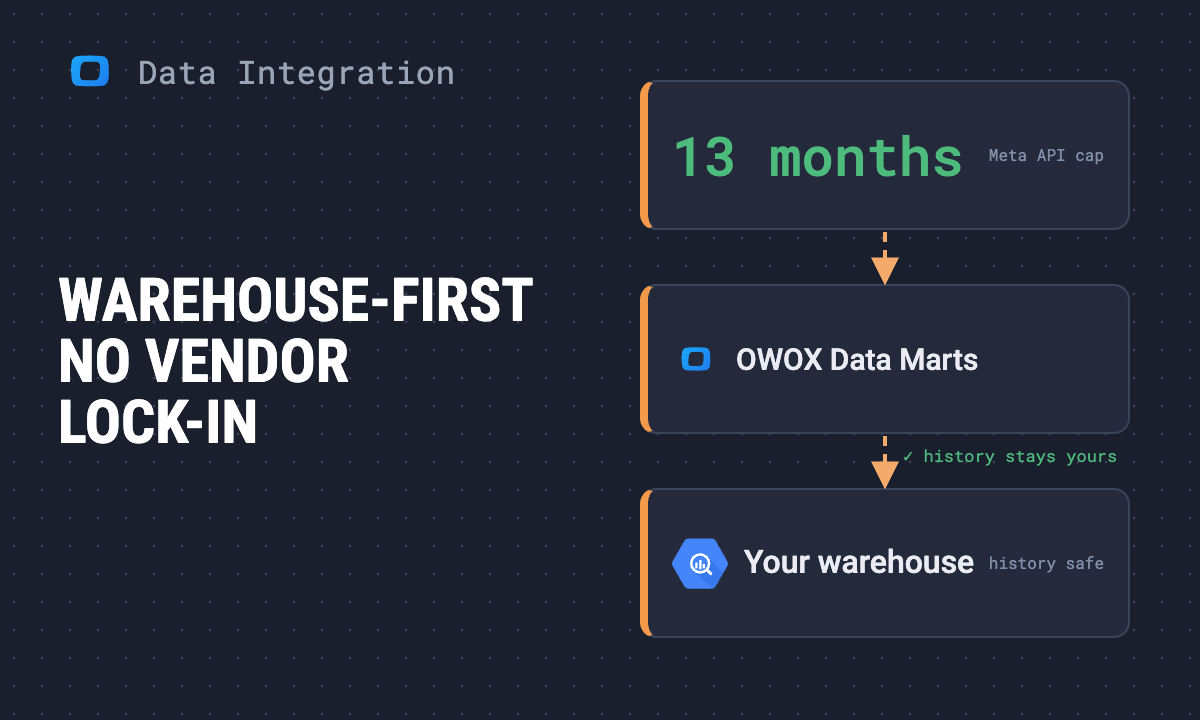 Article · Data IntegrationWarehouse-First Analytics: Escape Data Vendor Lock-in
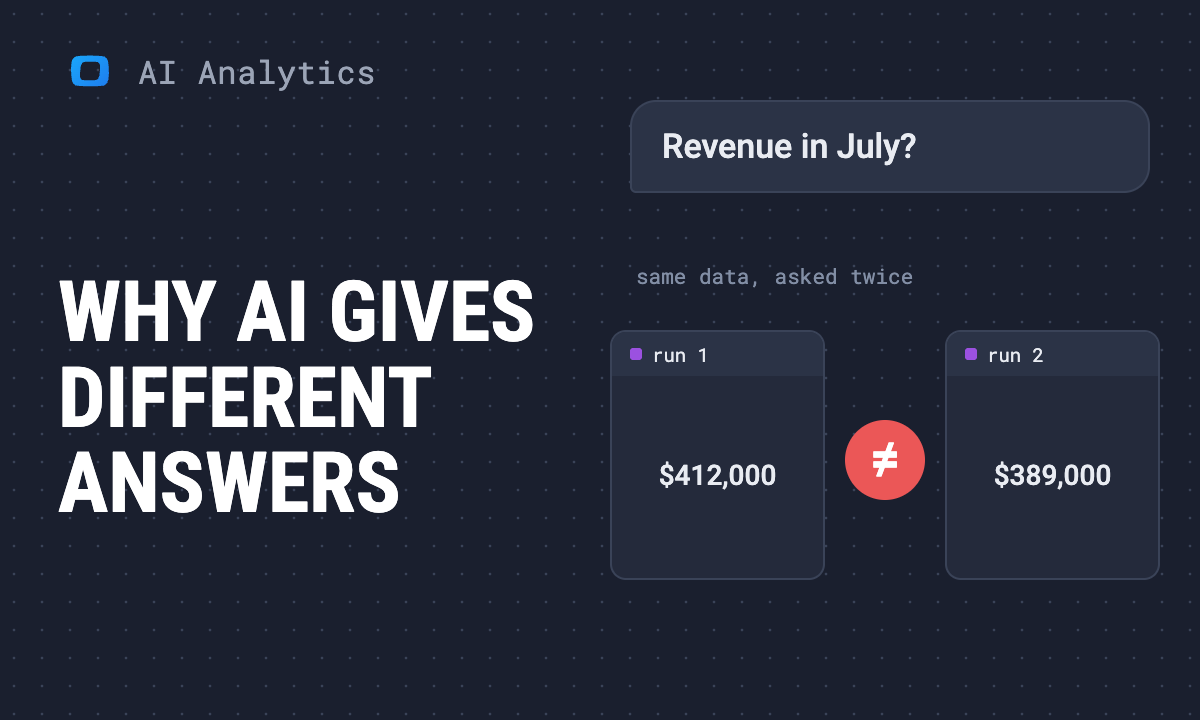 Article · AI in AnalyticsWhy AI Gives Different Answers to the Same Data Question
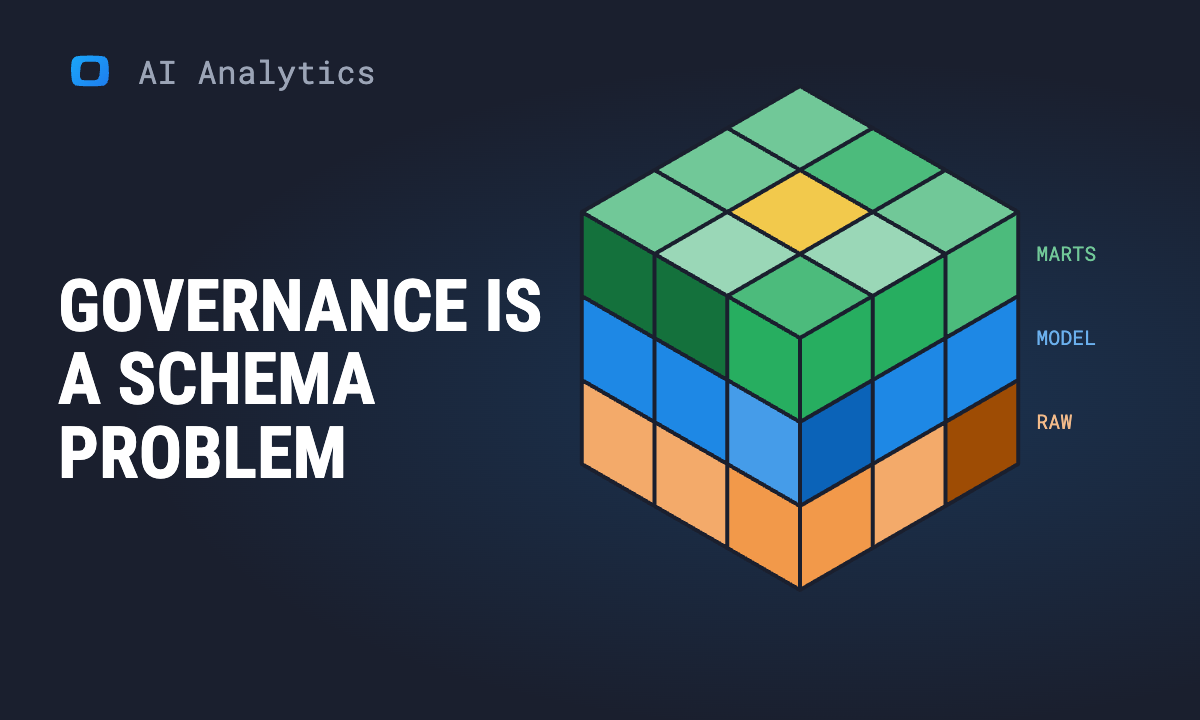 Article · AI in AnalyticsGoverned Self-Service Analytics: Fix the Real Bottleneck
 Success story · Data AnalyticsPurblack: Pürblack® Success Story: Trusted Data & AI Answers with OWOX
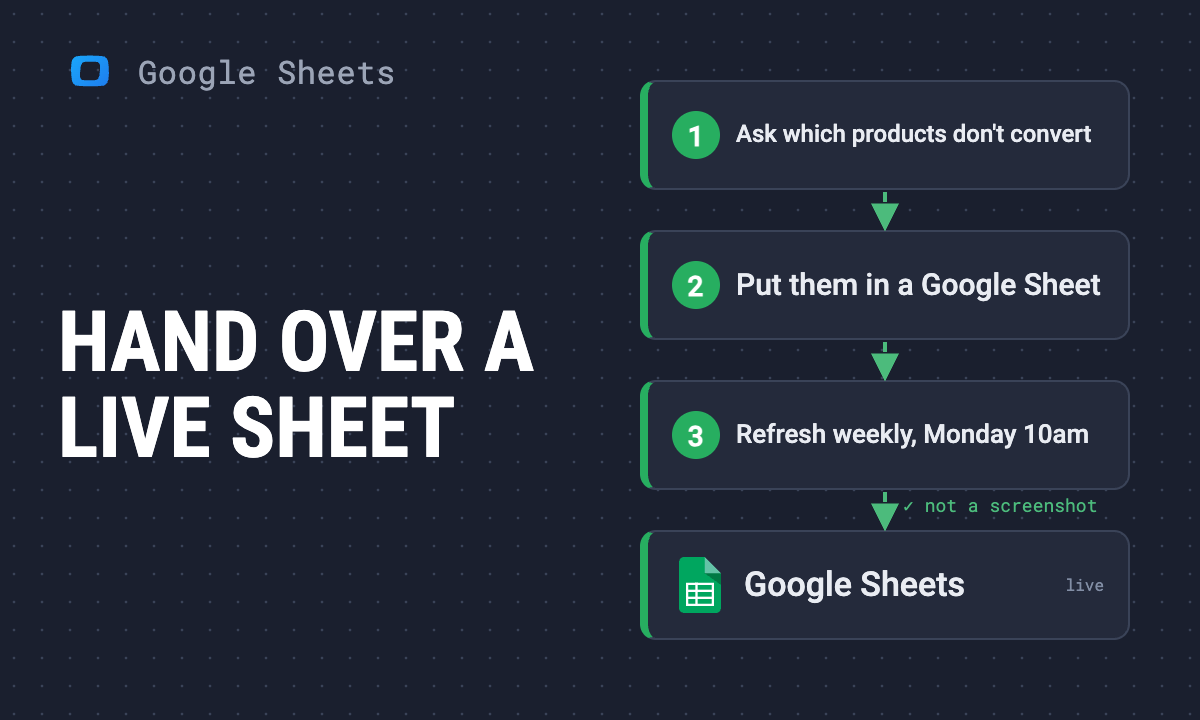 Article · Google Sheets TipsStop delegating tasks with data screenshots that are wrong by morning
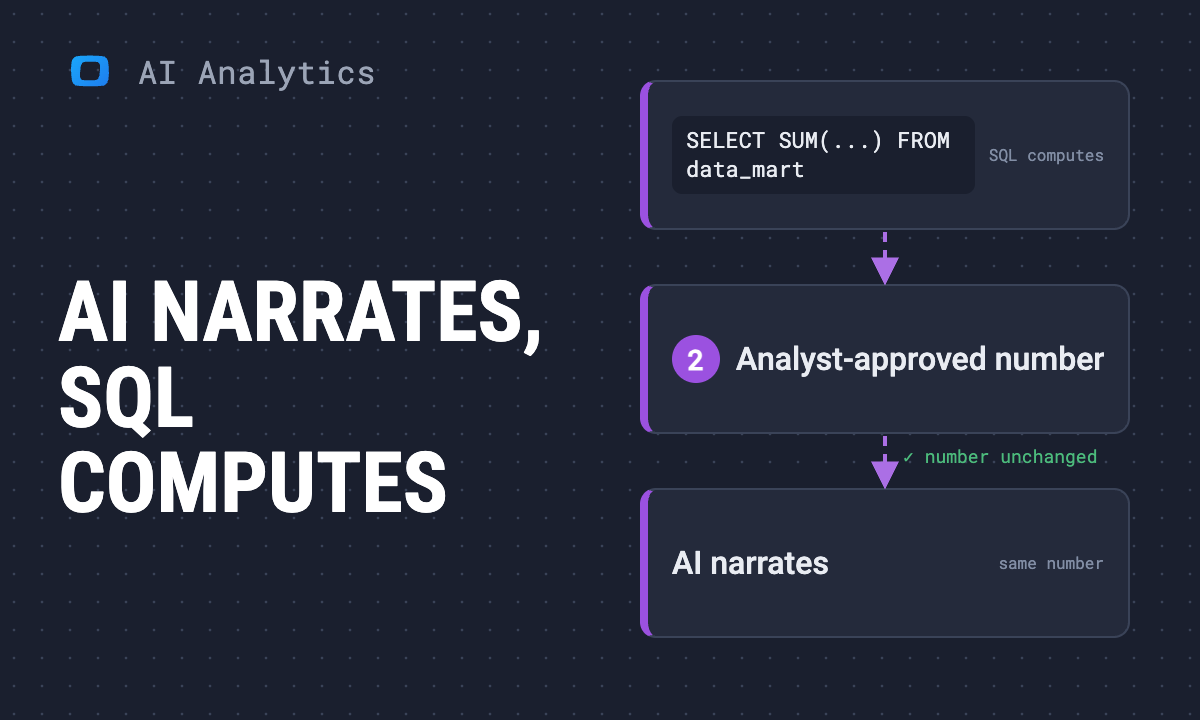 Article · AI in AnalyticsAI hallucinates. Your revenue numbers don't have to
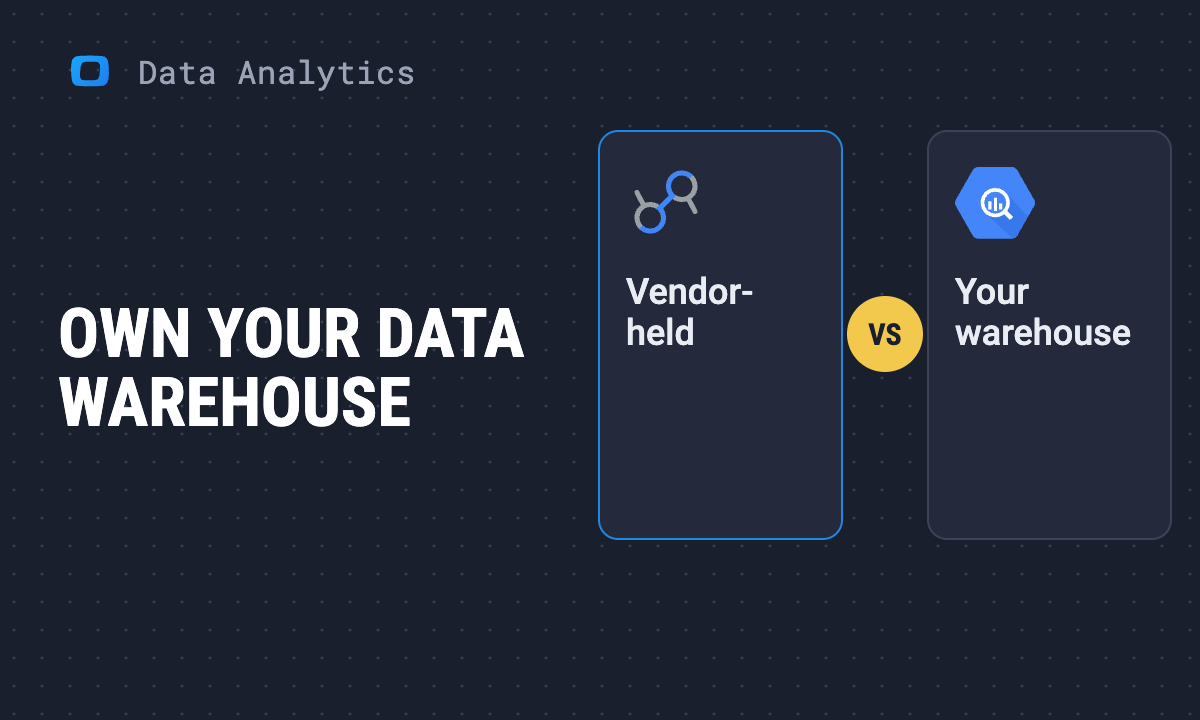 Article · Data AnalyticsYou'll switch tools one day. Will your data still be yours?
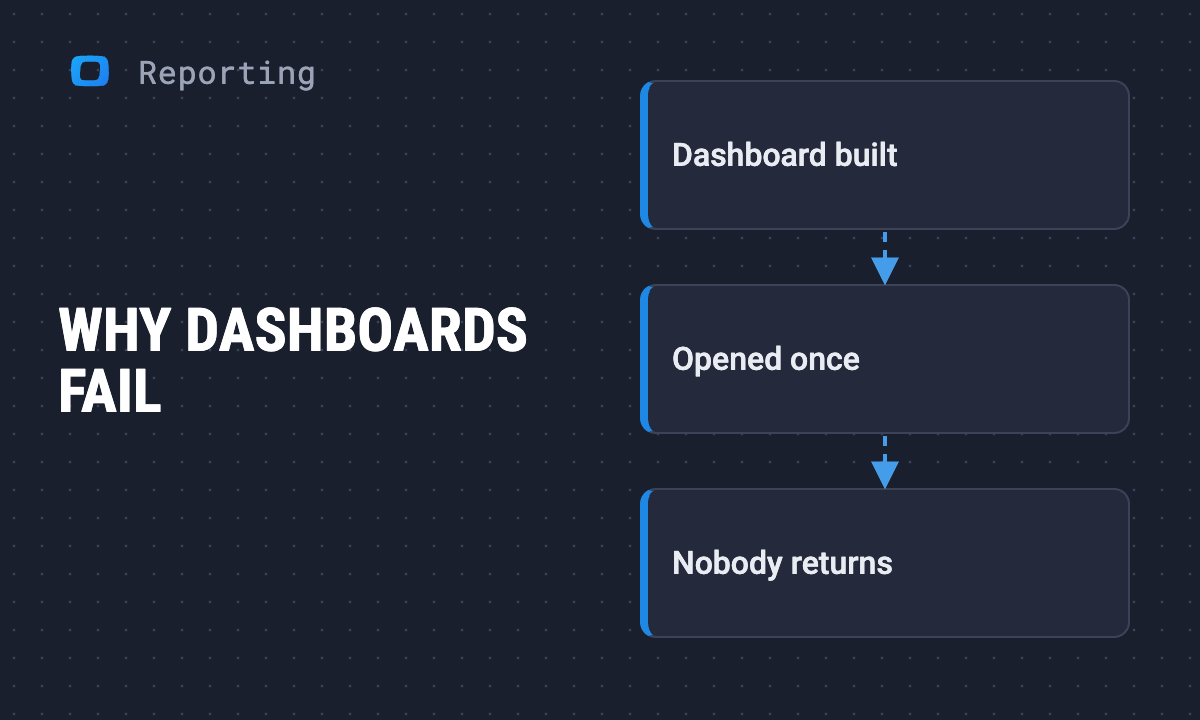 Article · ReportingDashboards nobody opens: the real reason, and the fix
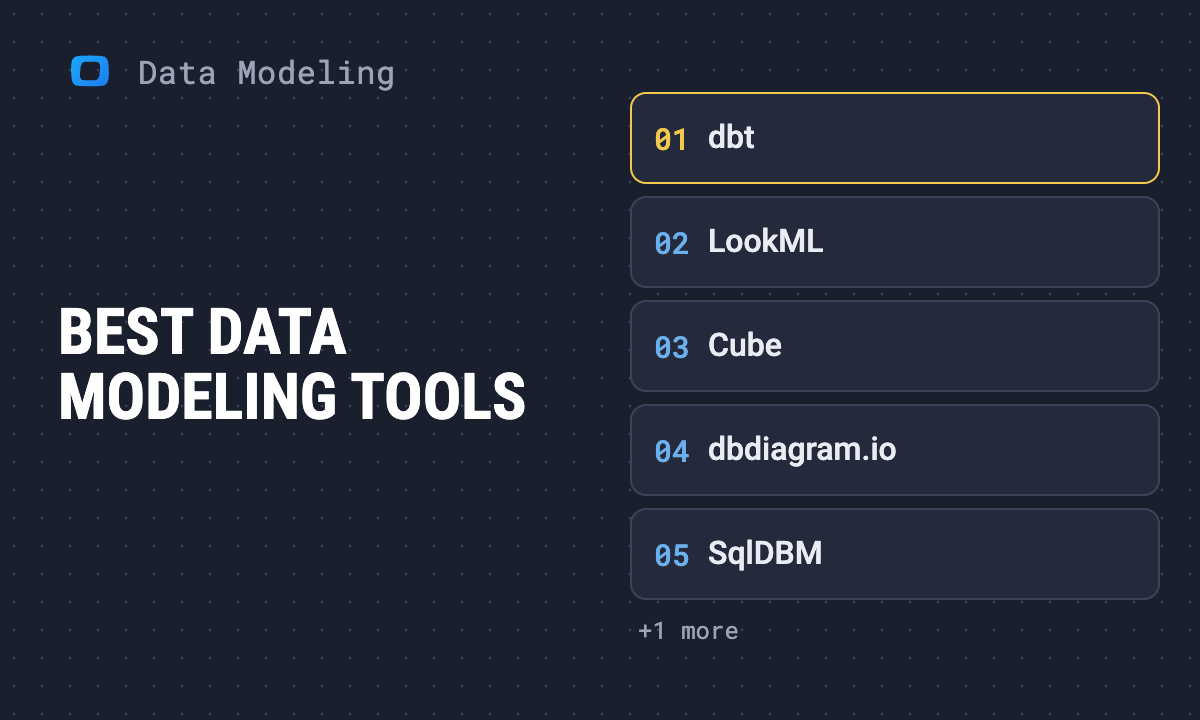 Article · Data ModelingBest data modeling tools in 2026
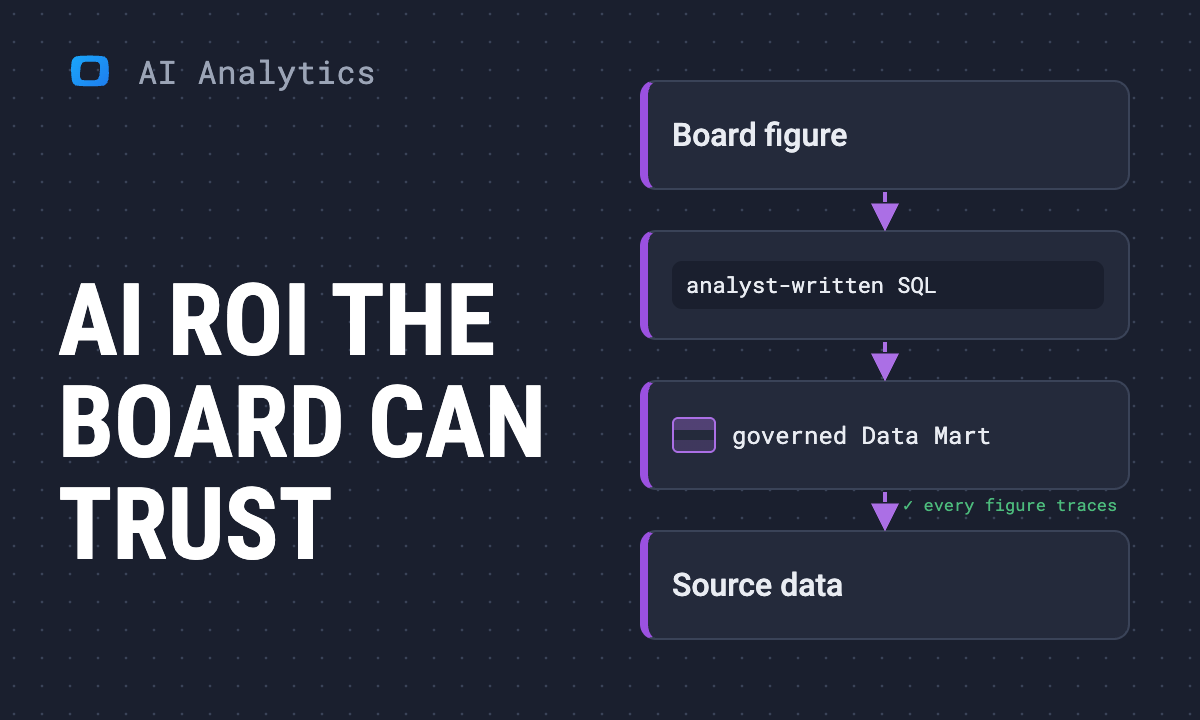 Article · AI in AnalyticsShip AI your board can trust — without betting your seat on a hallucination
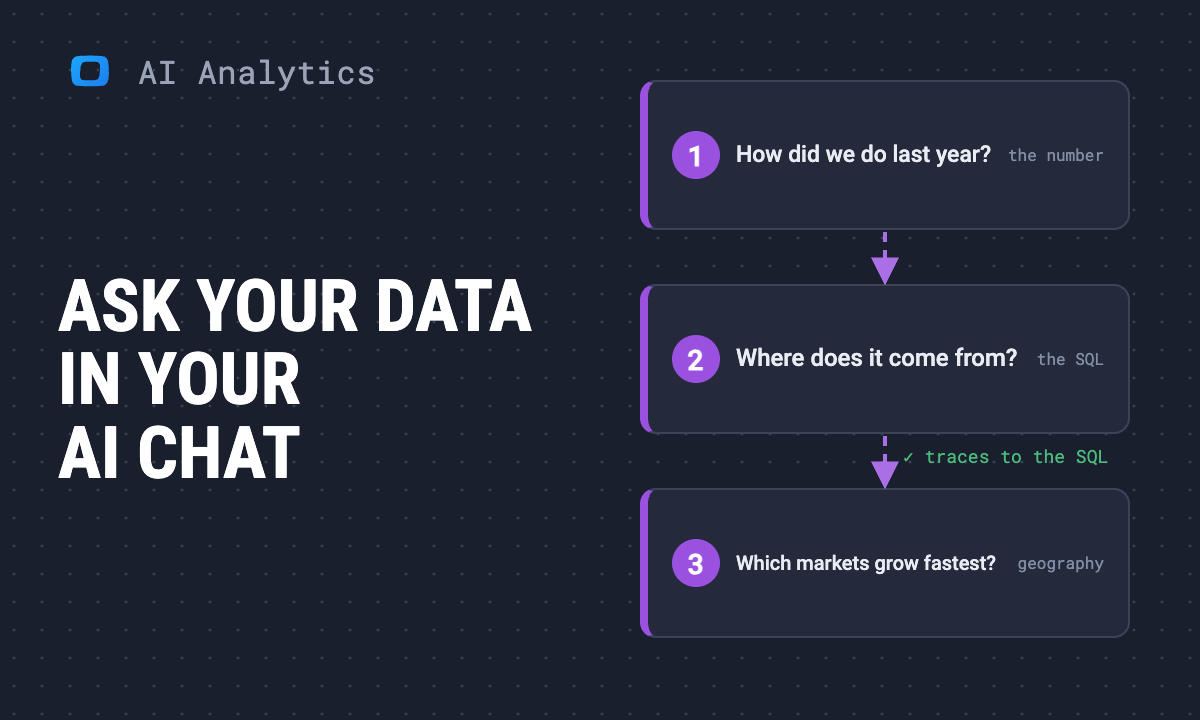 Article · AI in AnalyticsWho do you ask about your data?
 Article · ReportingYour weekly report is already wrong by the time you read it
 Article · AI in AnalyticsThe data guy will resist. Here's how to bring him along
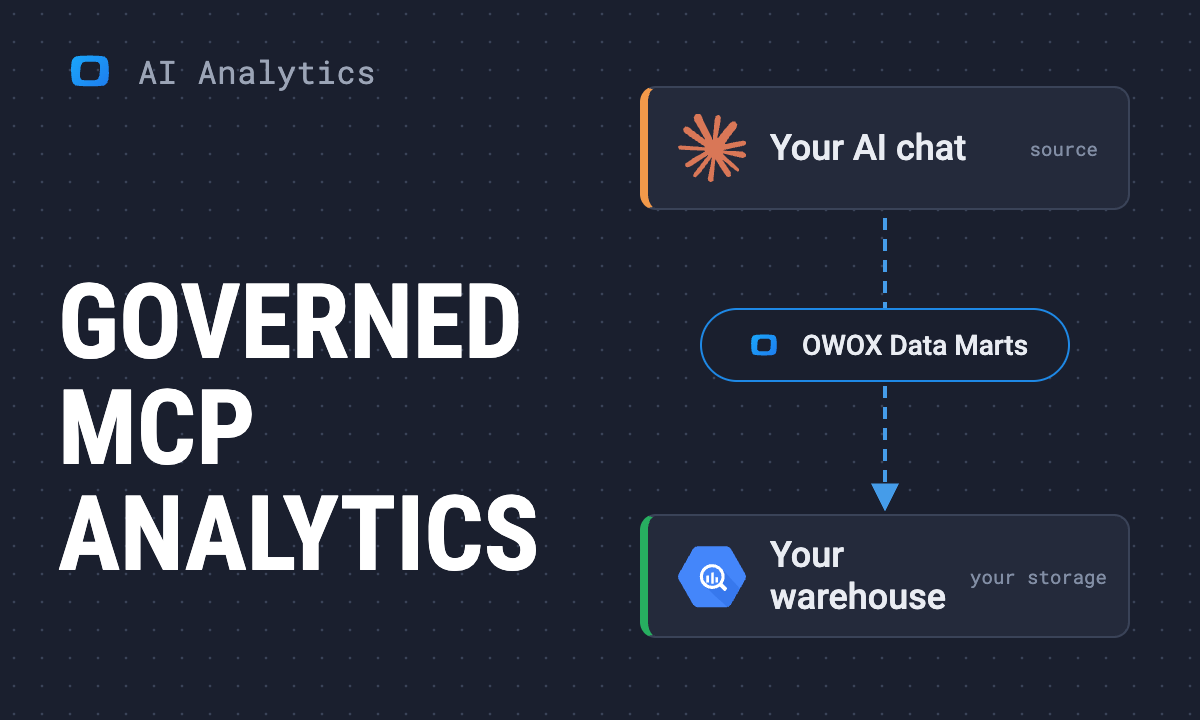 Article · AI in AnalyticsGoverned MCP Analytics: How It Works, Step by Step
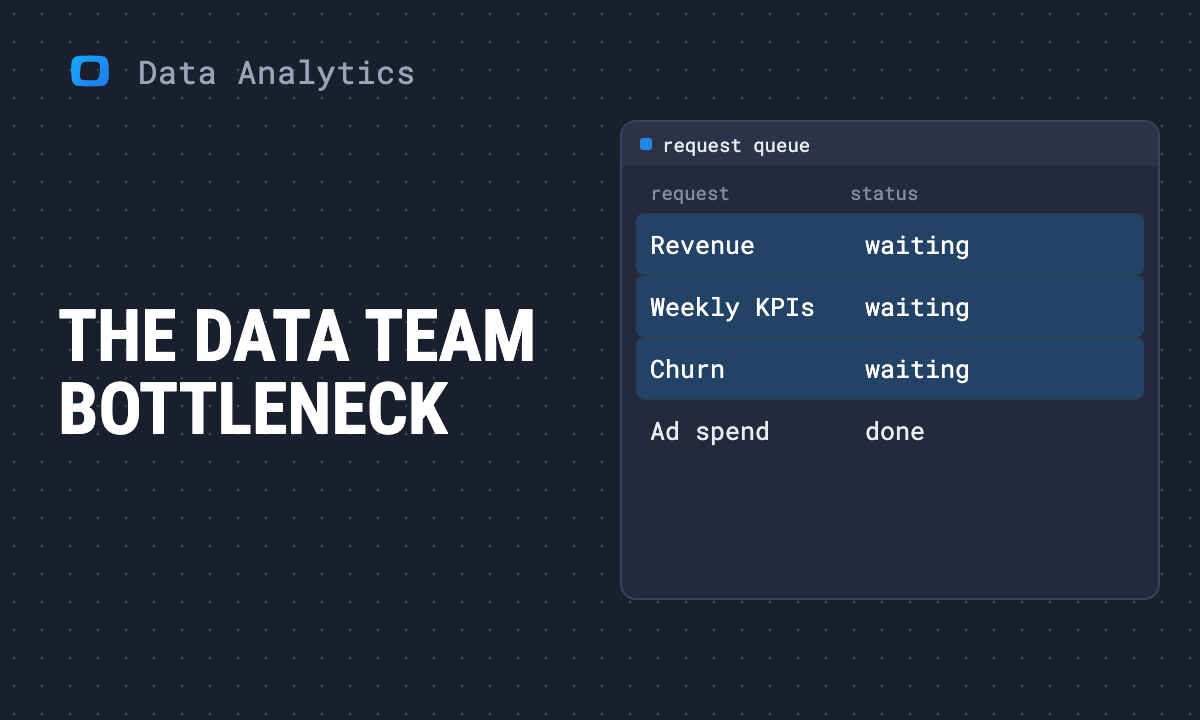 Article · Data AnalyticsThe most expensive queue in your company is in front of your one data guy
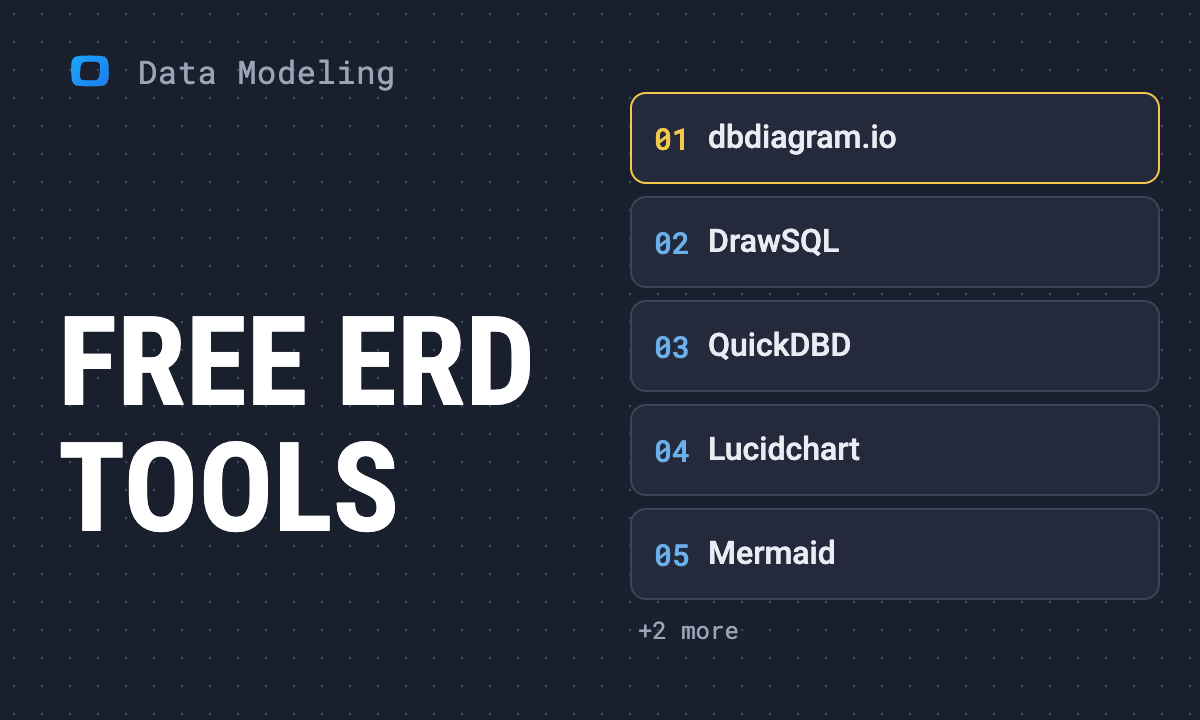 Article · Data ModelingBest free ERD tools in 2026
 Article · Data ModelingOKF vs dbt exposures vs LookML: How to describe a data model
 Article · Data ModelingOWOX Model Canvas vs dbdiagram.io: ERD tools compared
 Article · Data ModelingOWOX Model Canvas vs DrawSQL: ERD tools compared
 Article · Data ModelingOWOX Model Canvas vs Lucidchart for ERDs
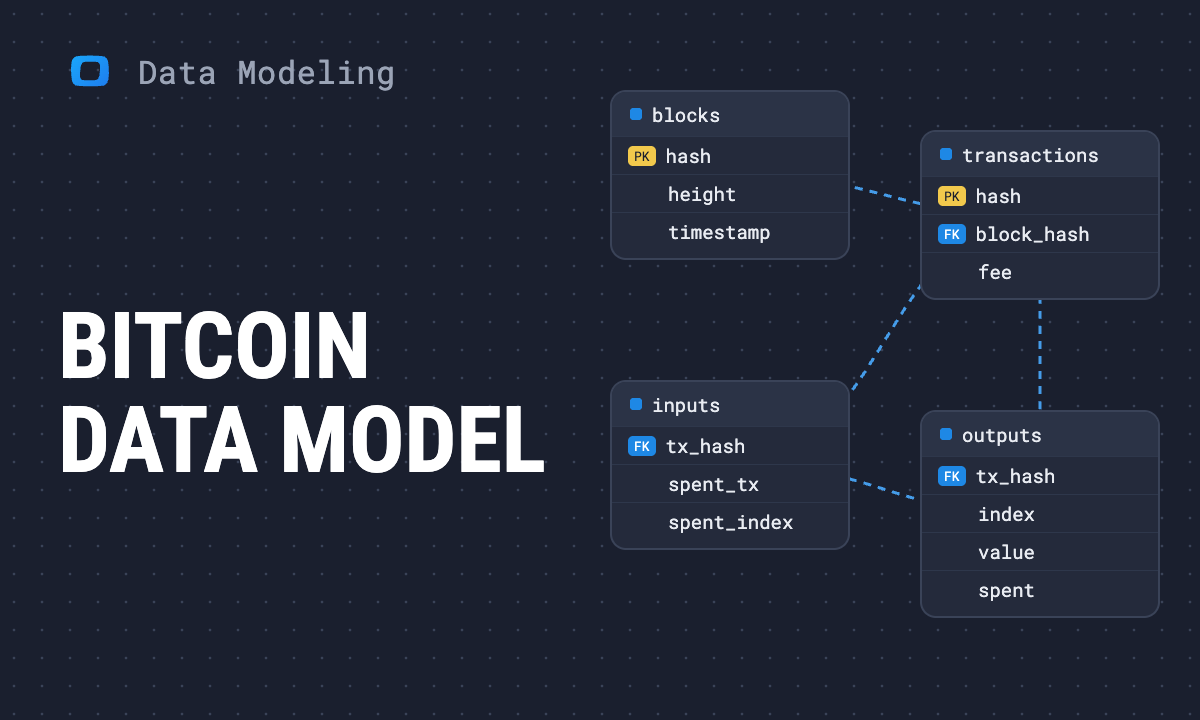 Article · Data ModelingBitcoin data model: the public BigQuery dataset, visualized
 Article · AI in AnalyticsI watched a CEO fire his weekly report — here's what he does instead
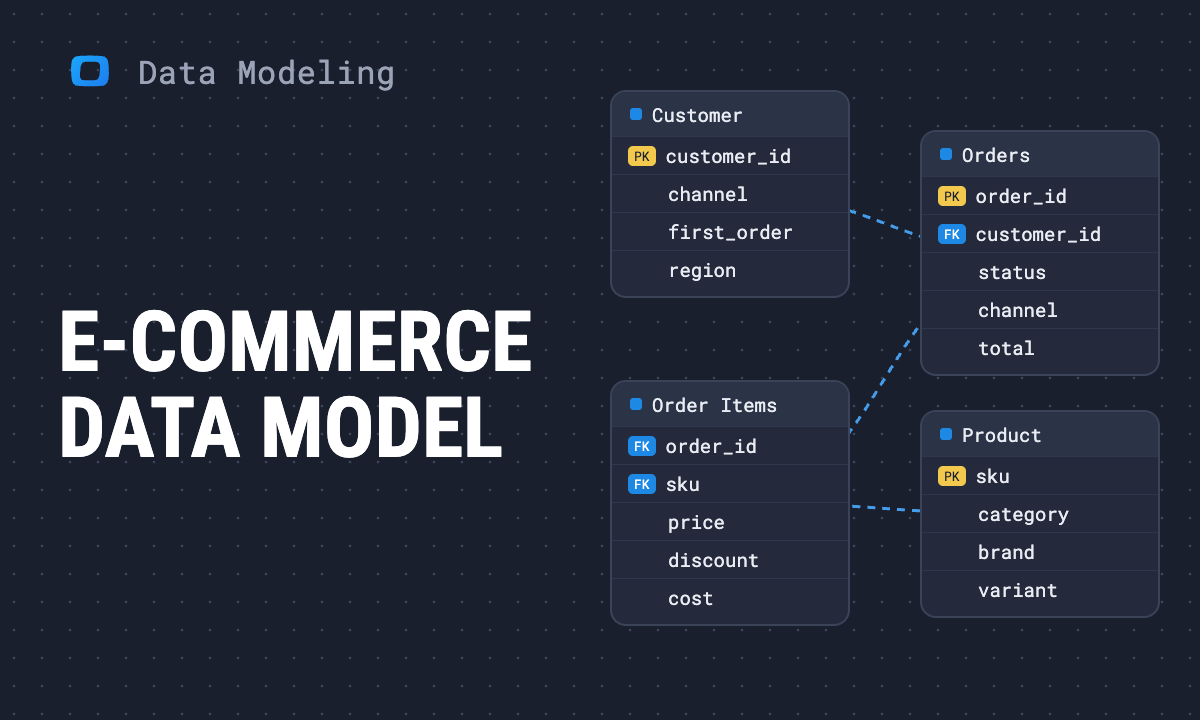 Article · Data ModelingE-commerce data model: a free template to open and edit
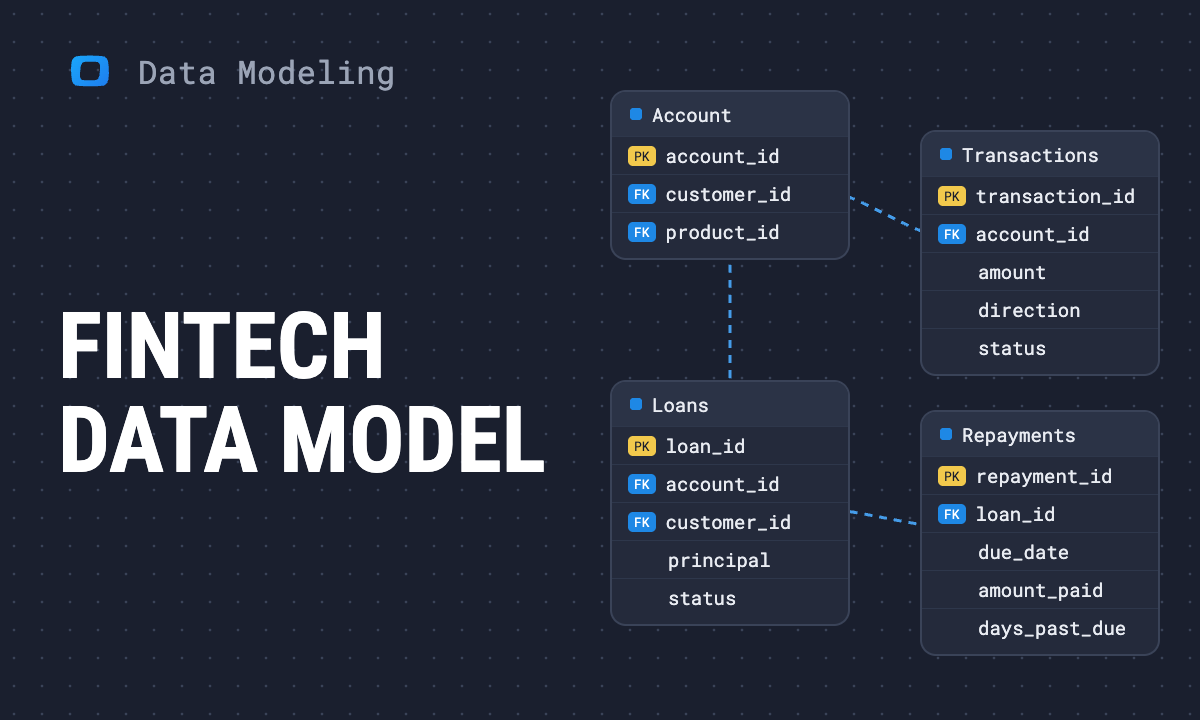 Article · Data ModelingFintech data model: a free neobank & lending template
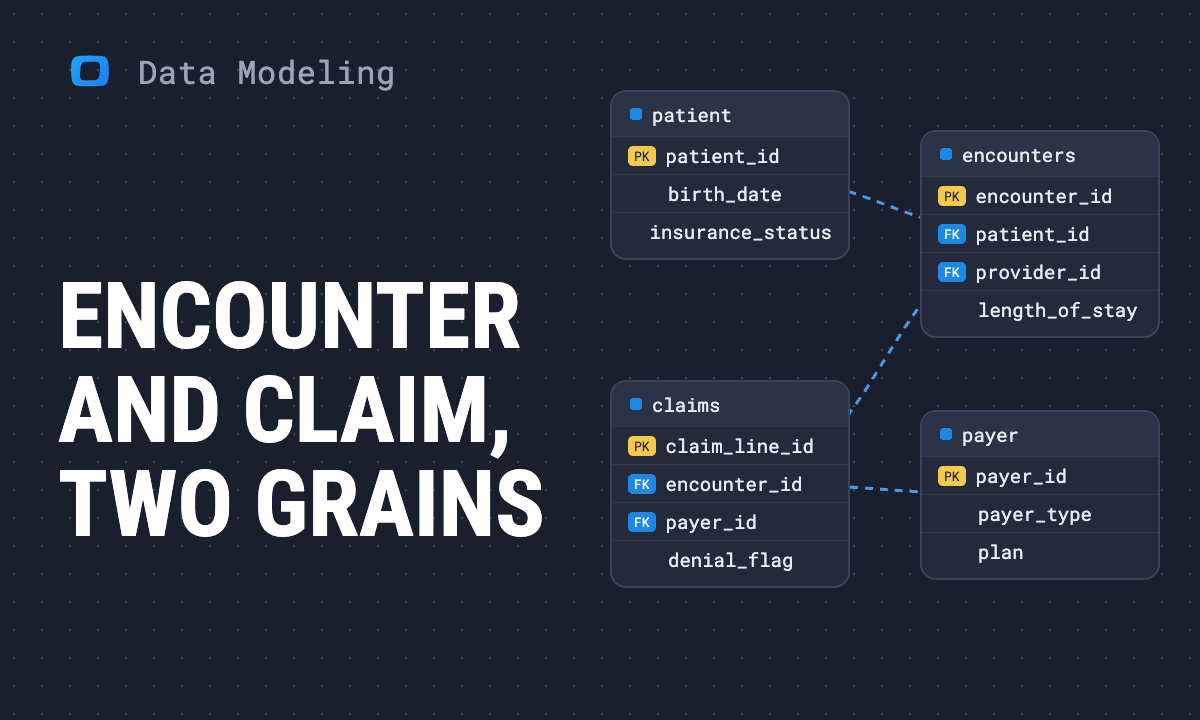 Article · Data ModelingHealthcare Data Model: Free Analytics Template
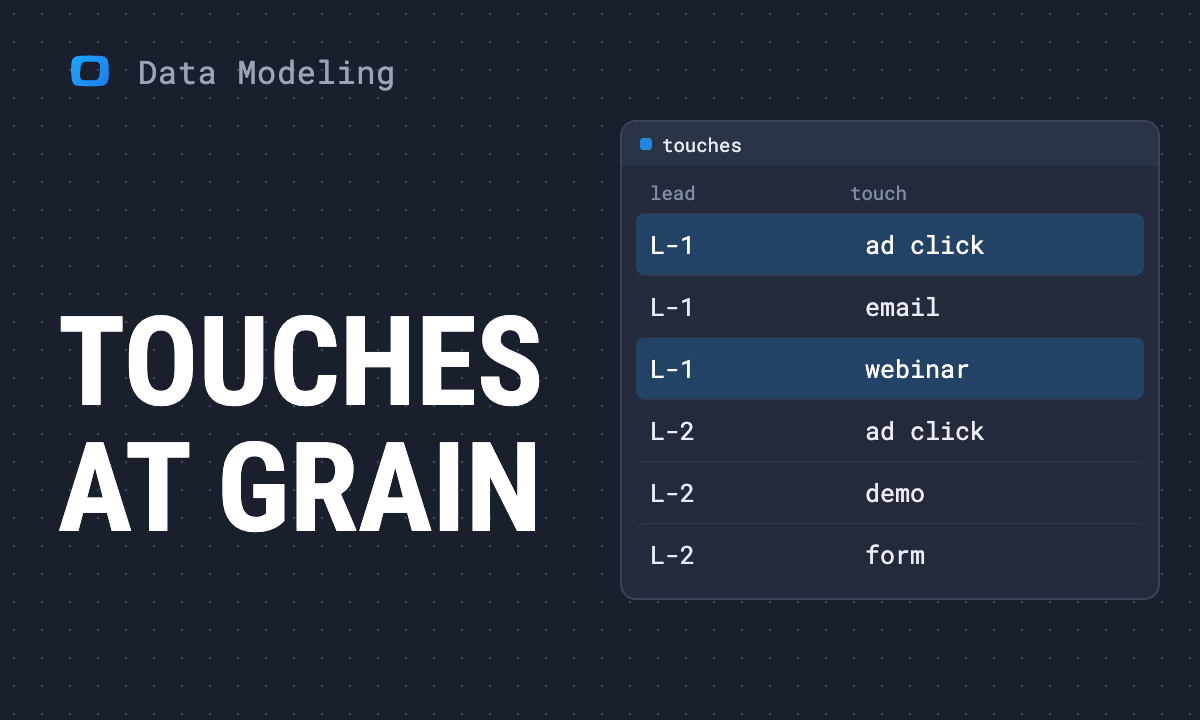 Article · Data ModelingMarketing data model: a free lead-gen funnel template
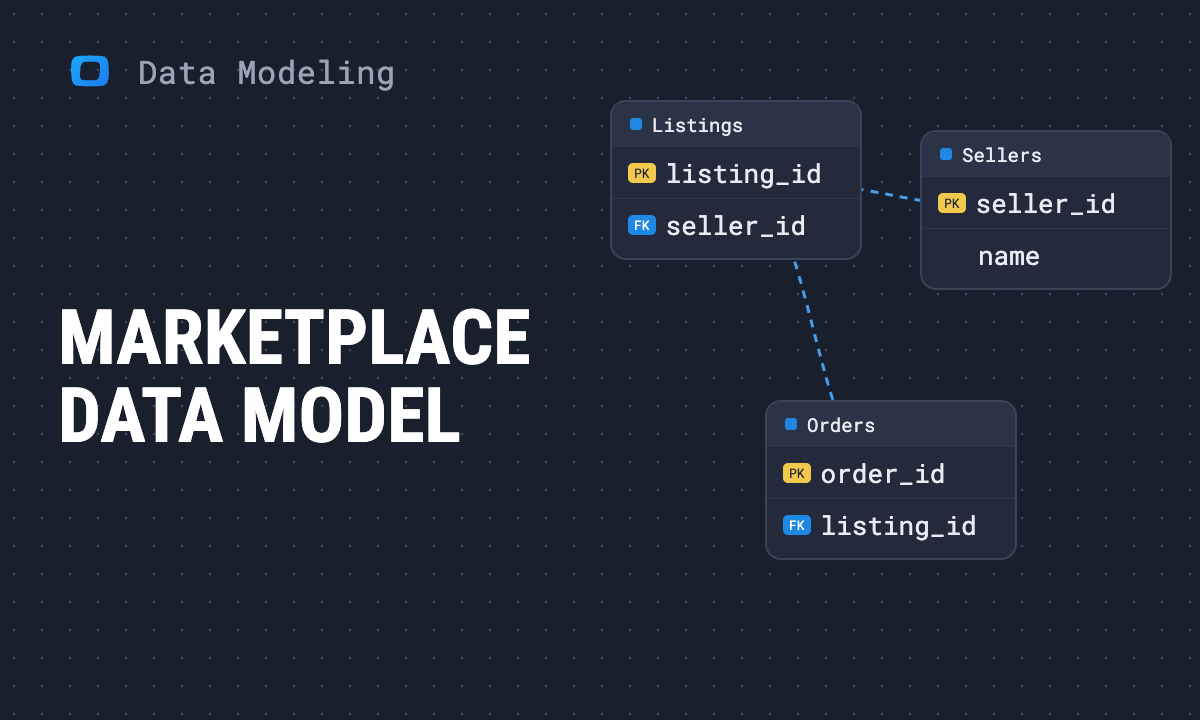 Article · Data ModelingMarketplace data model: a free two-sided template
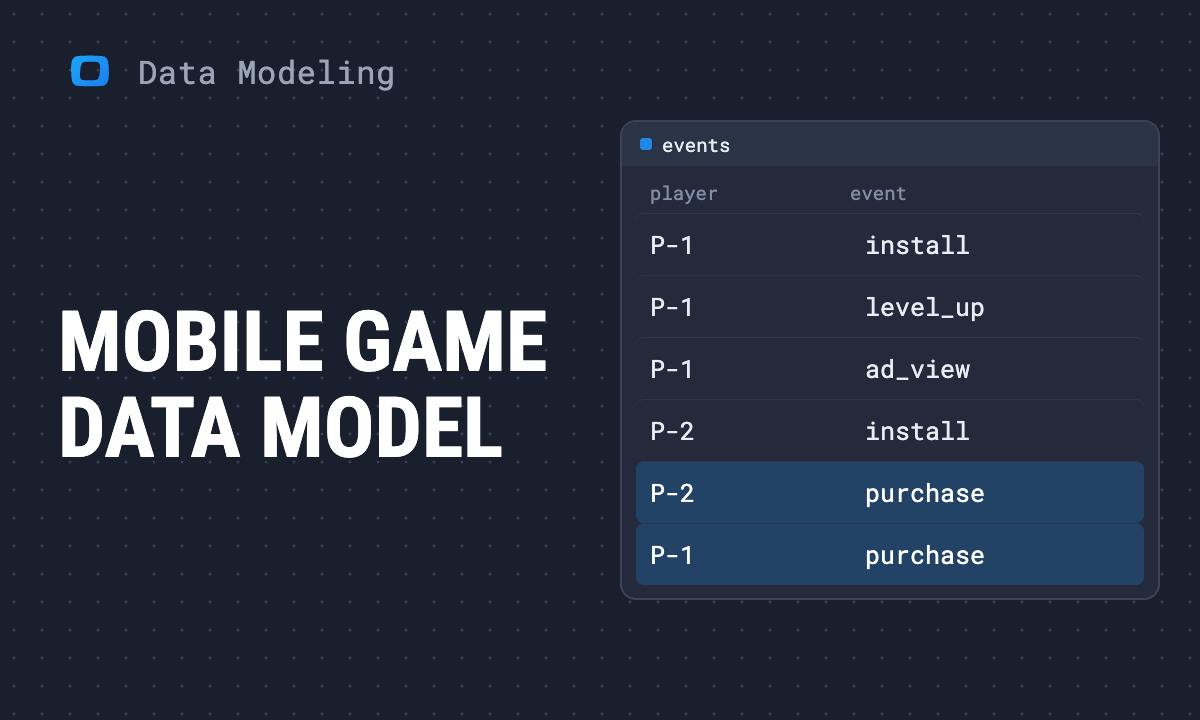 Article · Data ModelingMobile game data model: a free analytics template
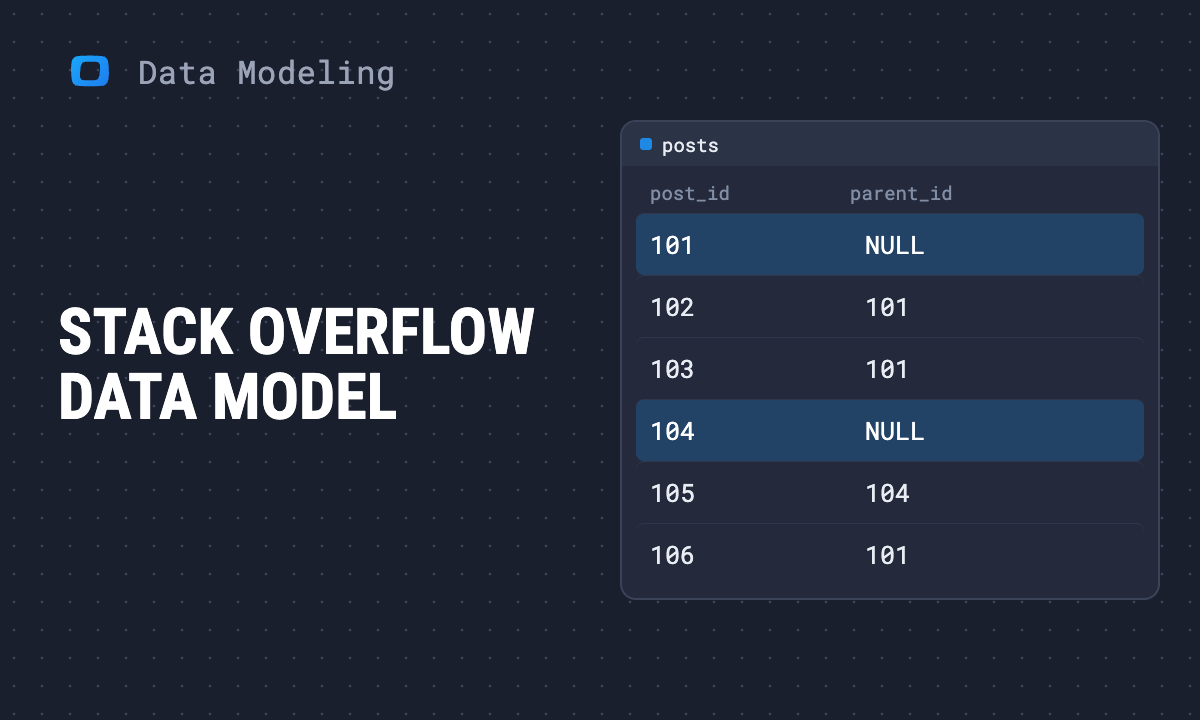 Article · Data ModelingStack Overflow data model: the public BigQuery dataset
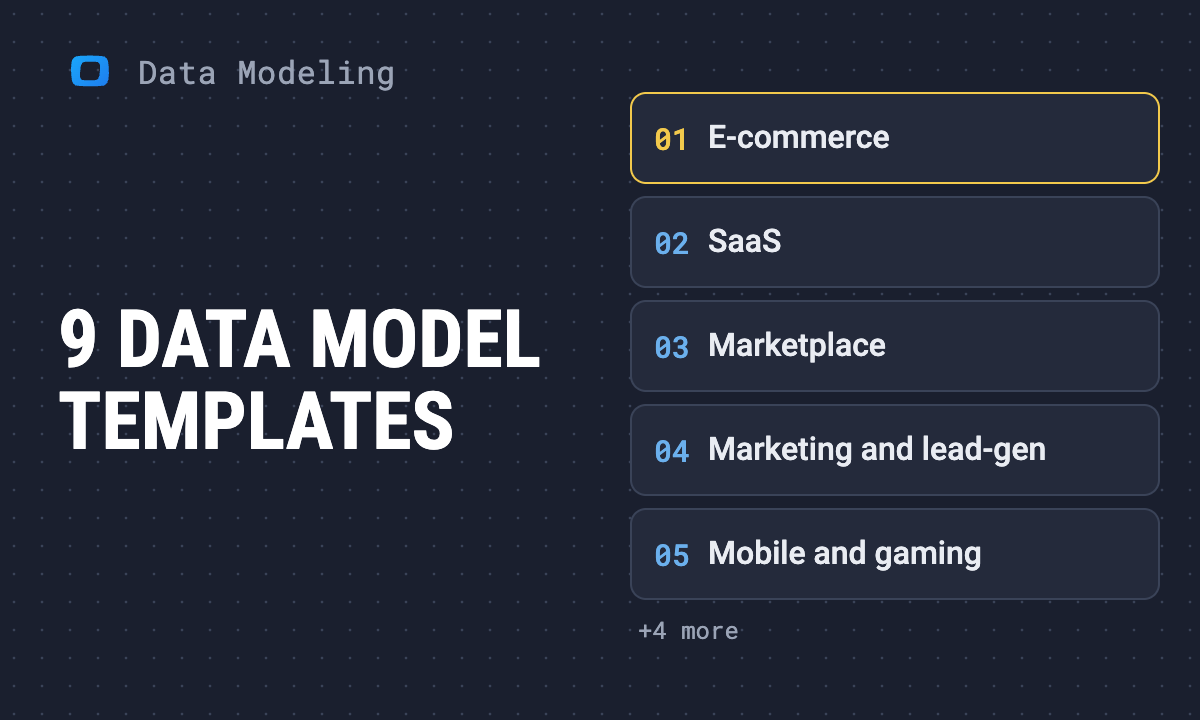 Article · Data ModelingFree data model templates: open, edit, and export OKF
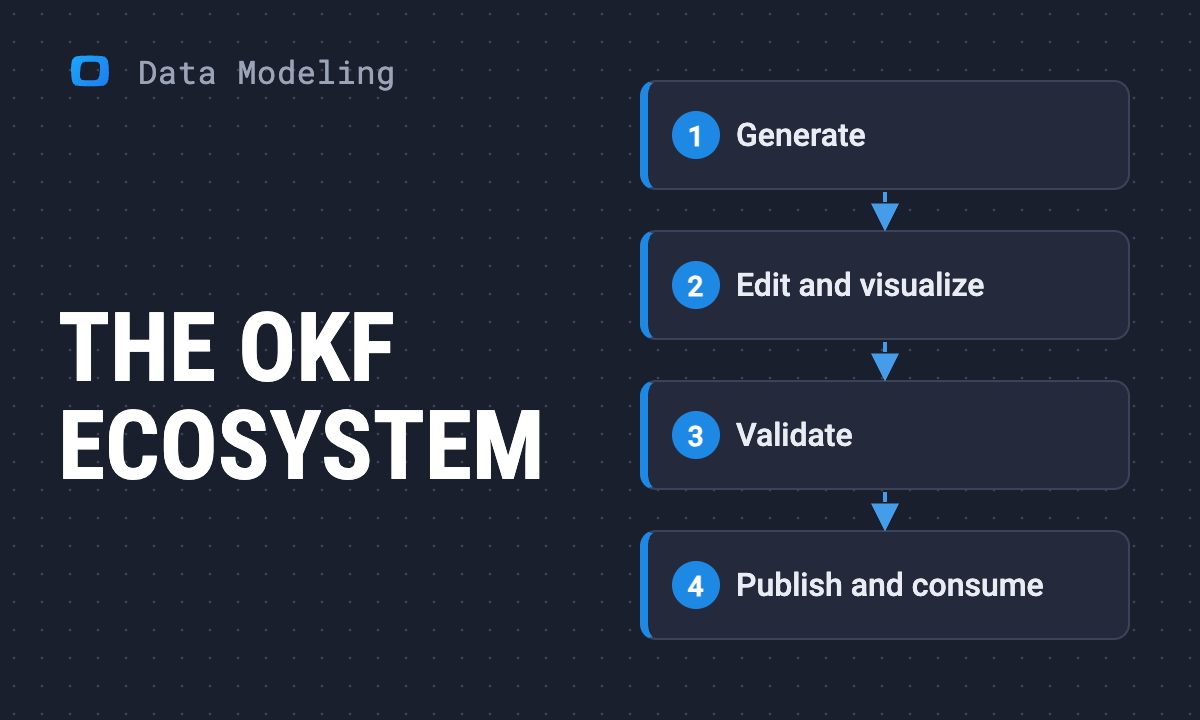 Article · Data ModelingThe OKF ecosystem: Every open-source tool for Google's Open Knowledge Format
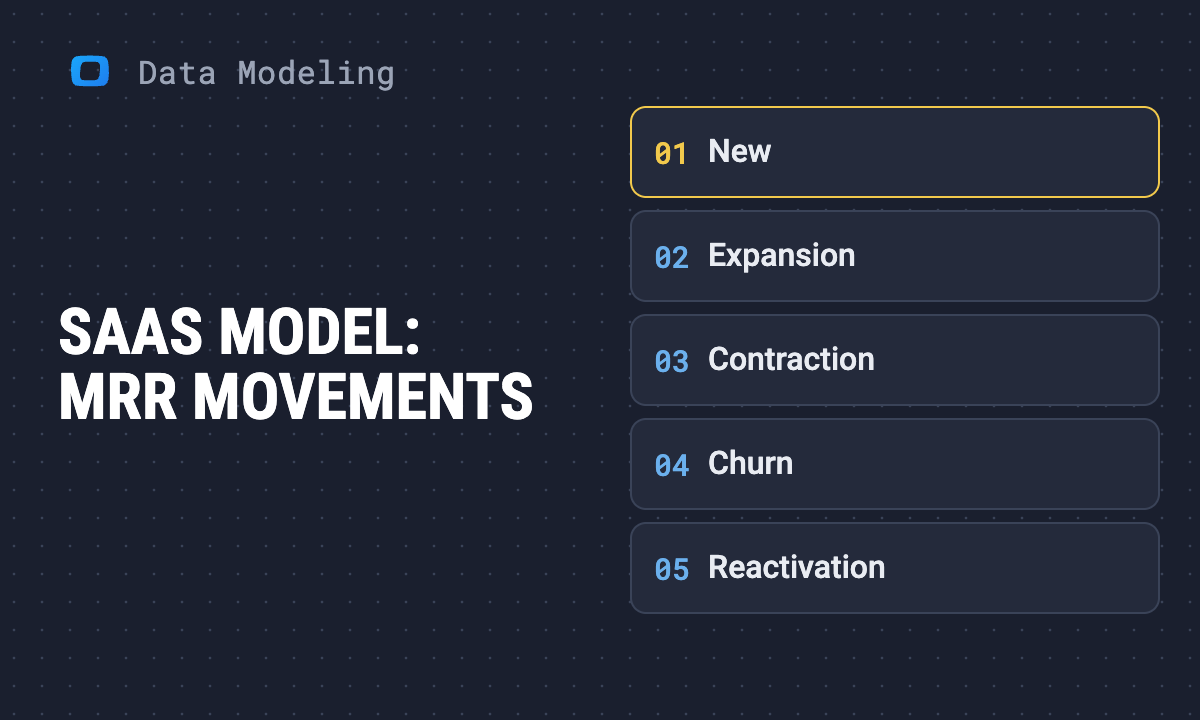 Article · Data ModelingSaaS data model: a free subscription analytics template
 Article · AI in AnalyticsAI agents don't replace your analyst — they replace your backlog
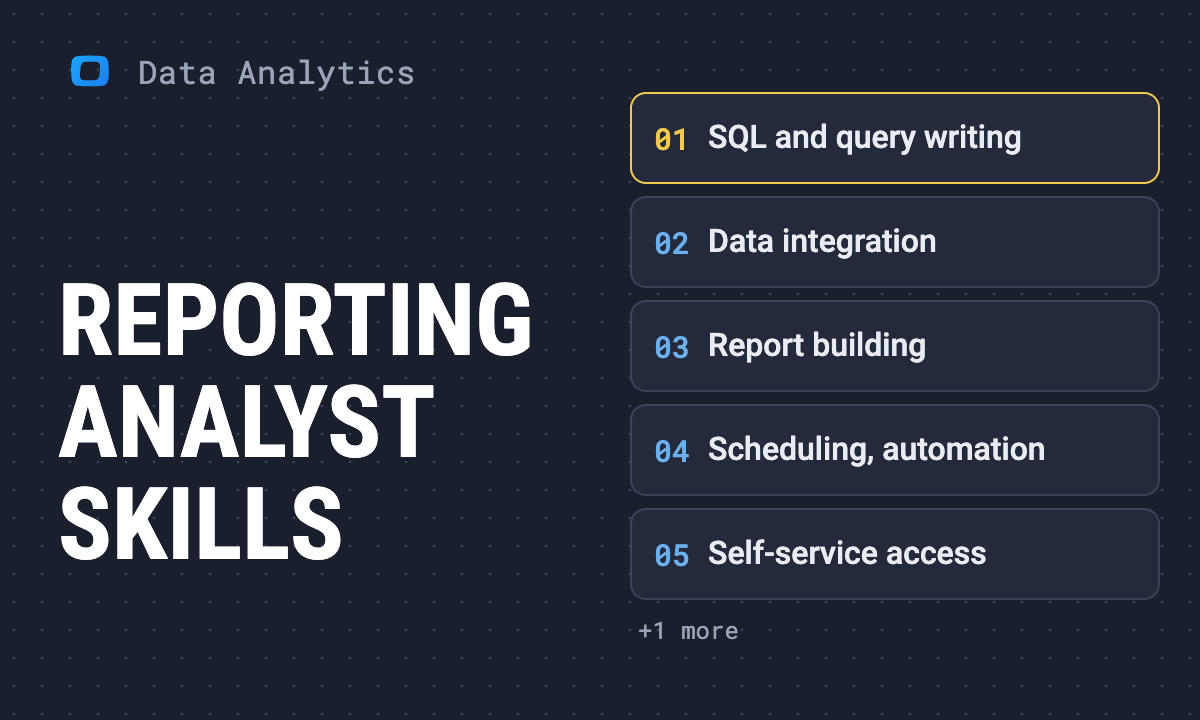 Article · Data AnalyticsWe analyzed 1,438 job postings. Here’s what reporting analysts actually do.
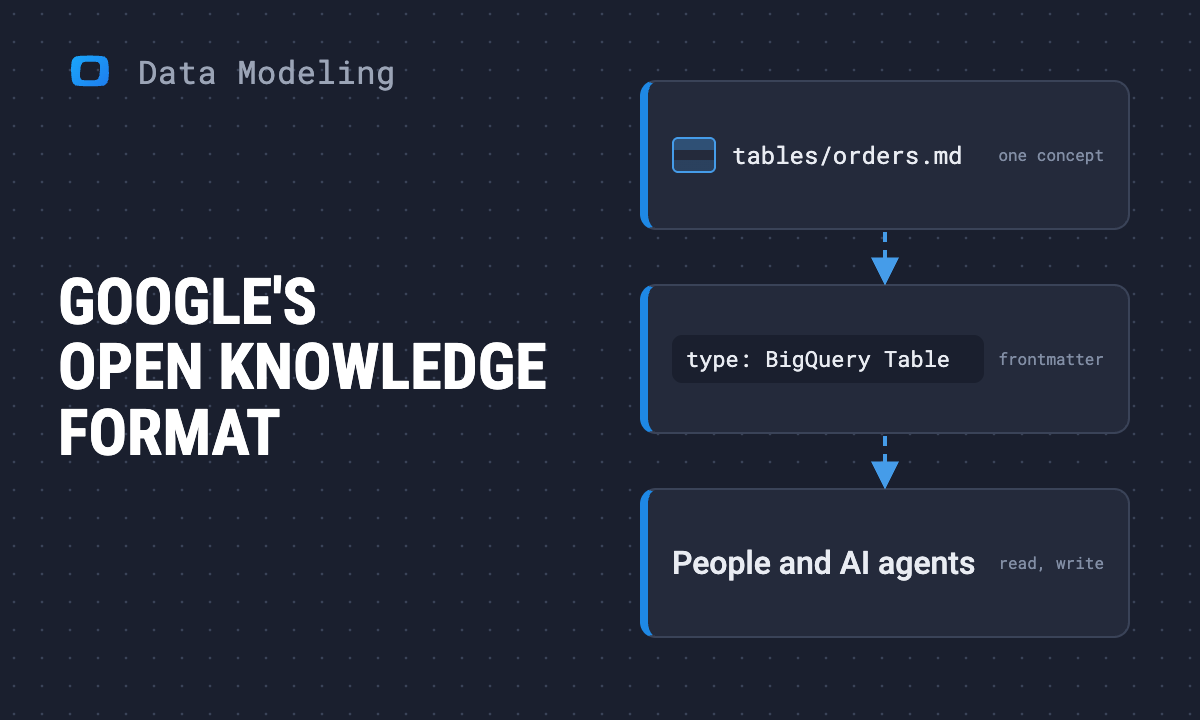 Article · Data ModelingWhat is OKF (Open Knowledge Format)? Google's new data standard, explained
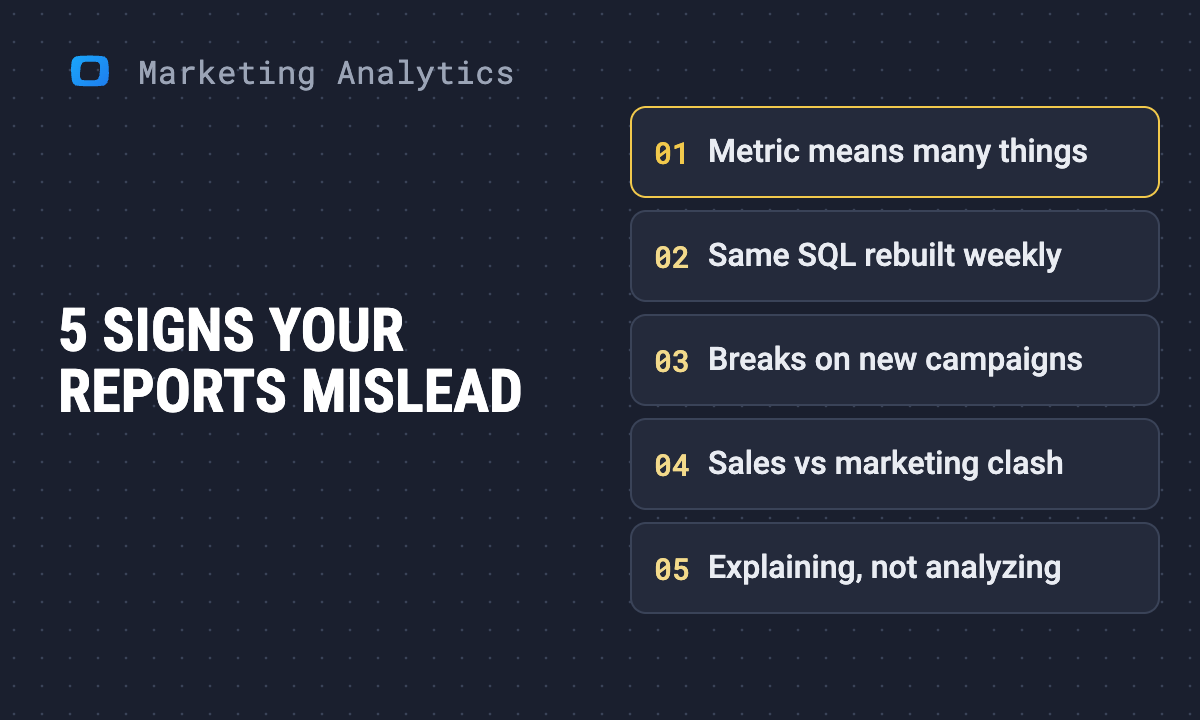 Article · Marketing AnalyticsThe 5 signs your marketing reports are lying to you
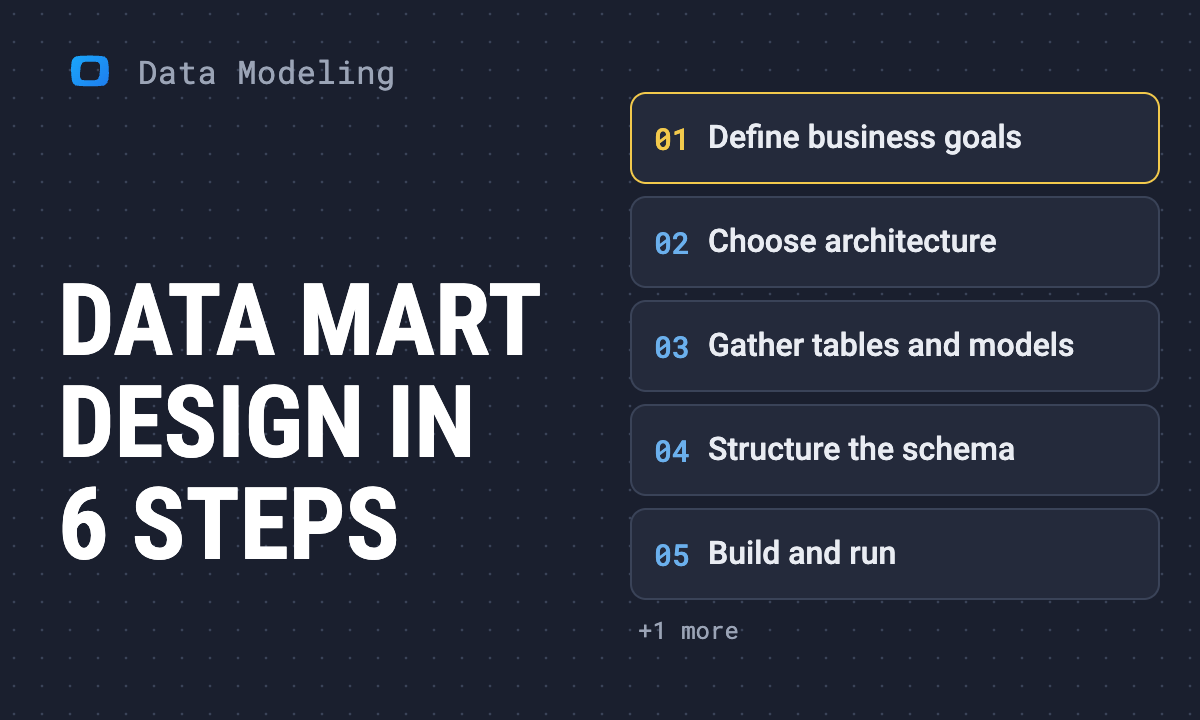 Article · Data ModelingData Mart design: structuring flat tables
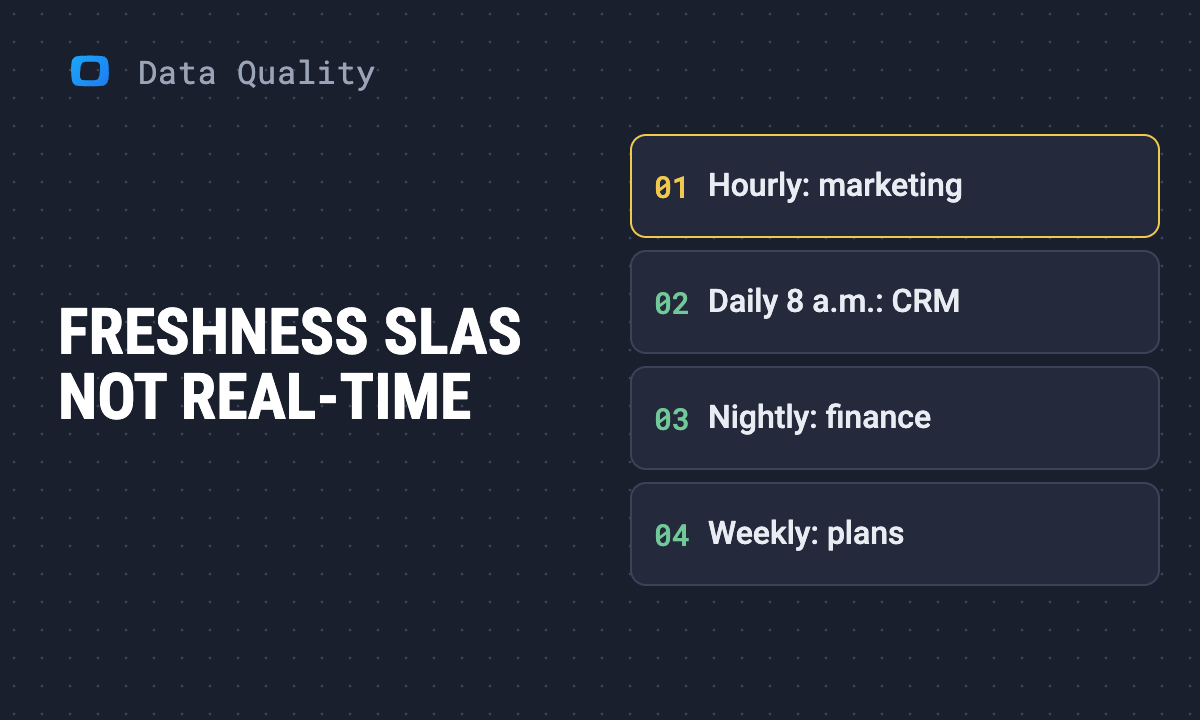 Article · Data QualityBusiness users want "real-time data": Defining freshness SLAs
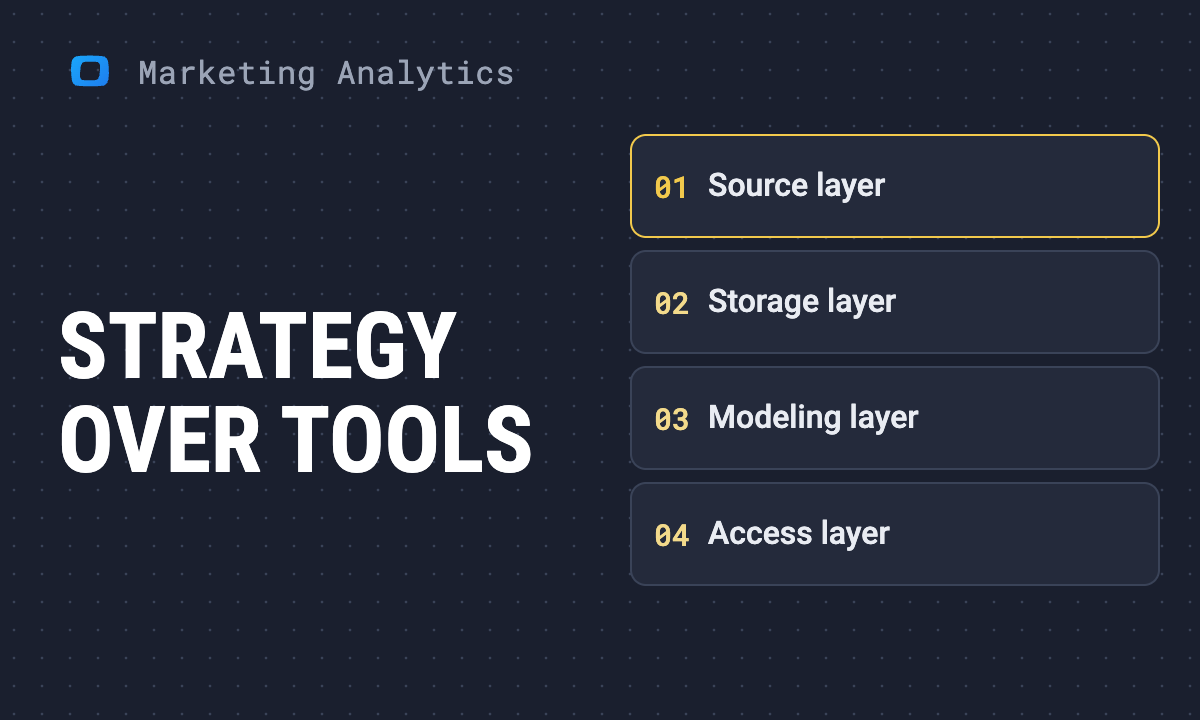 Article · Marketing AnalyticsYou don't need 17 analytics tools – You need a reporting strategy
 Article · ReportingReporting ≠ analytics: Why your dashboards aren’t telling you enough
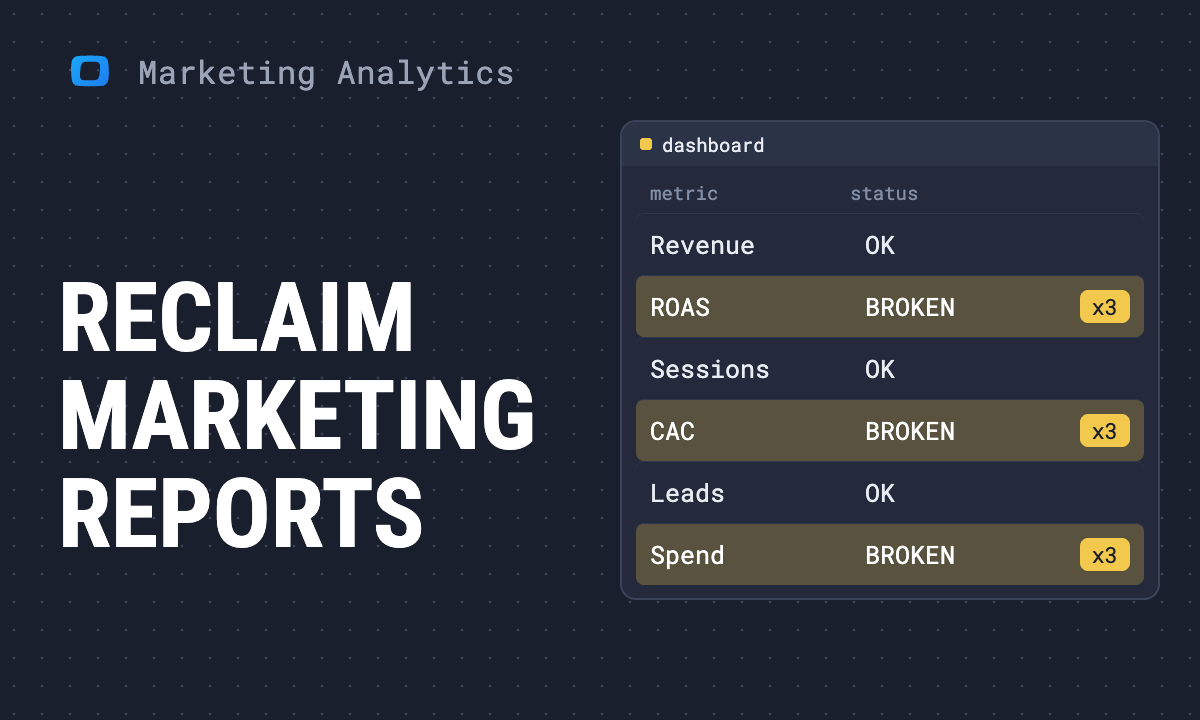 Article · Marketing AnalyticsHow digital analysts can take back control over marketing reporting
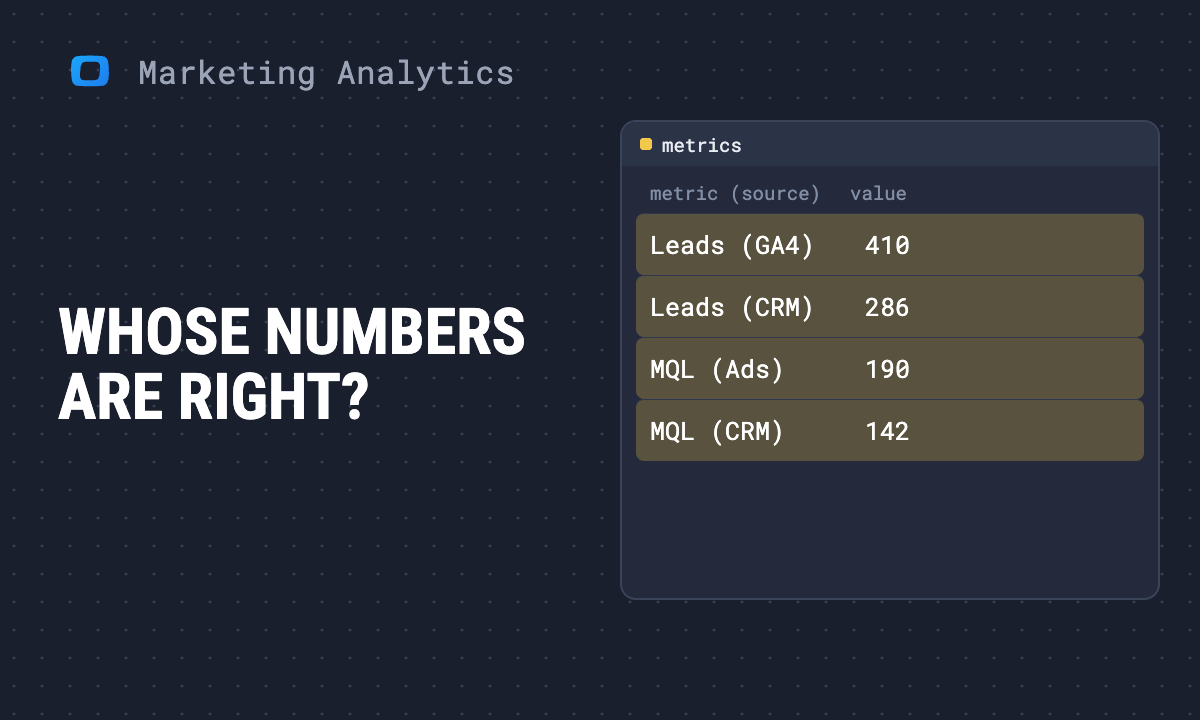 Article · Marketing AnalyticsHow to build a trusted metrics layer for marketing teams
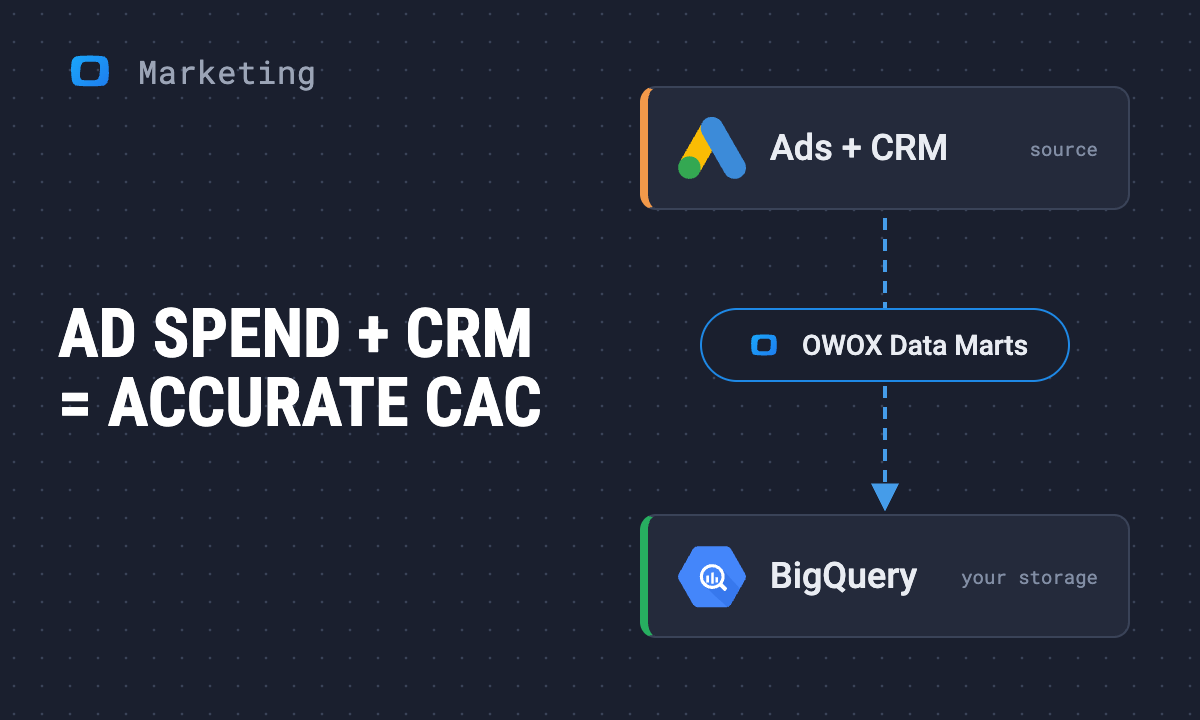 Article · Marketing StrategyHow to build a CAC report: Unify ad spend and CRM data
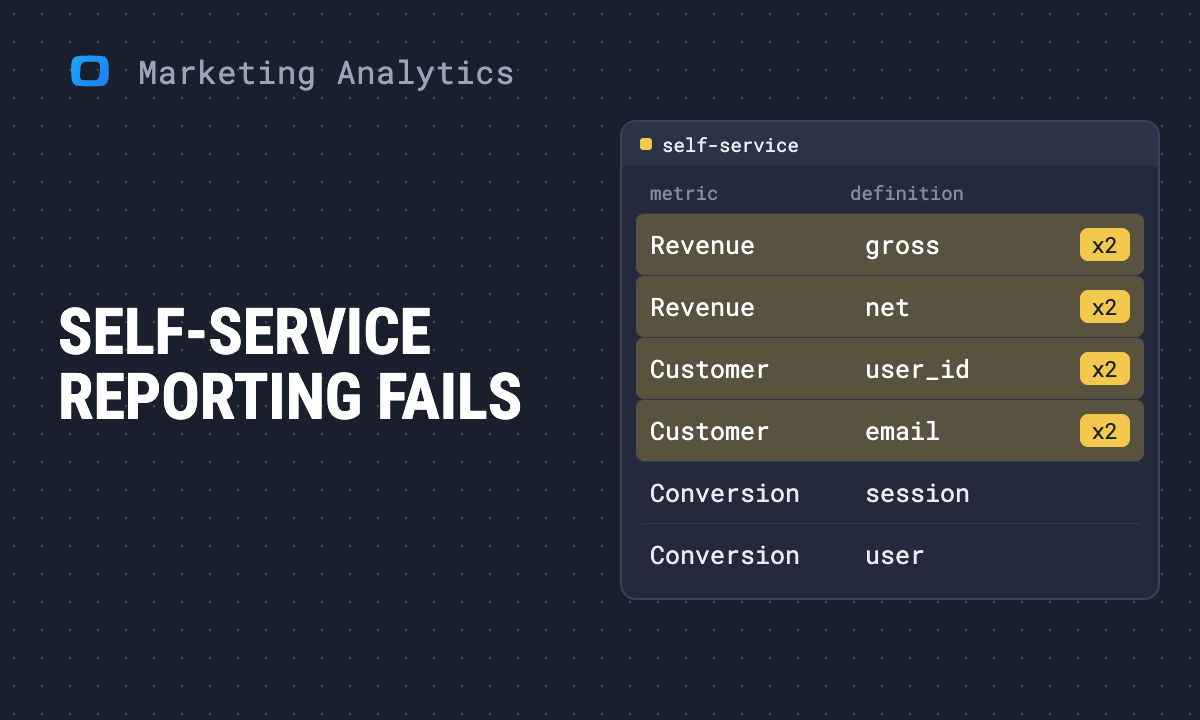 Article · Marketing AnalyticsWhy self-service reporting fails (and how to fix it)
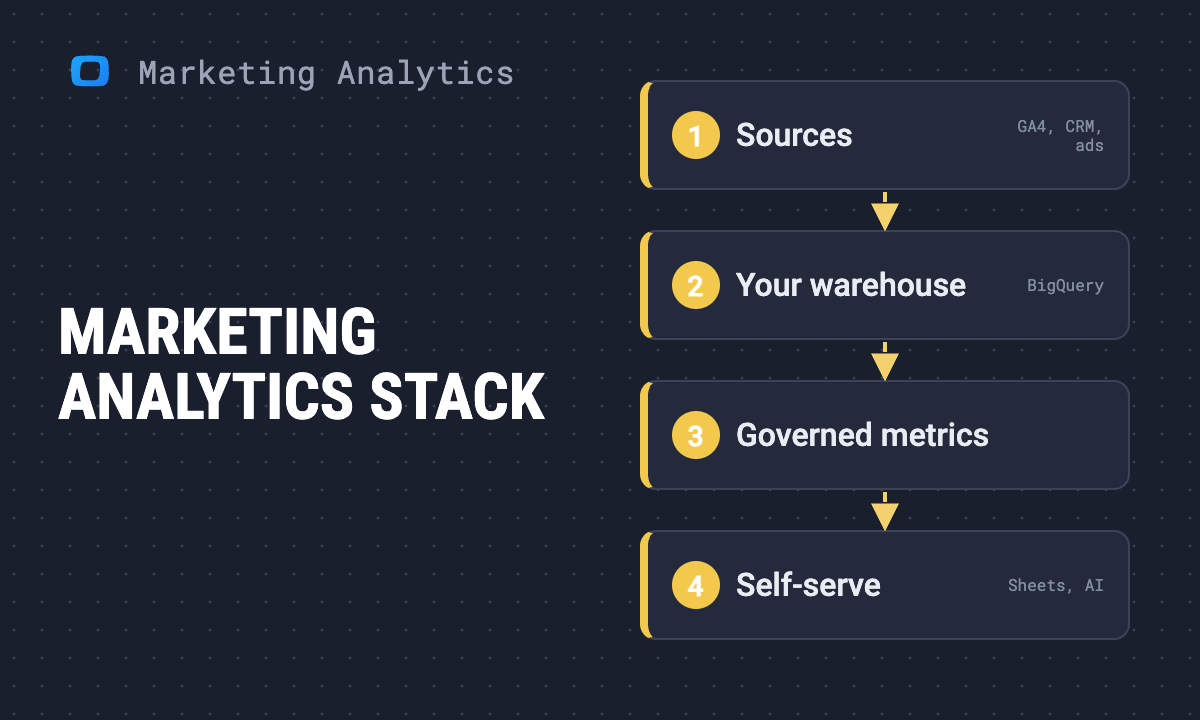 Article · Marketing AnalyticsThe anatomy of a perfect marketing analytics stack
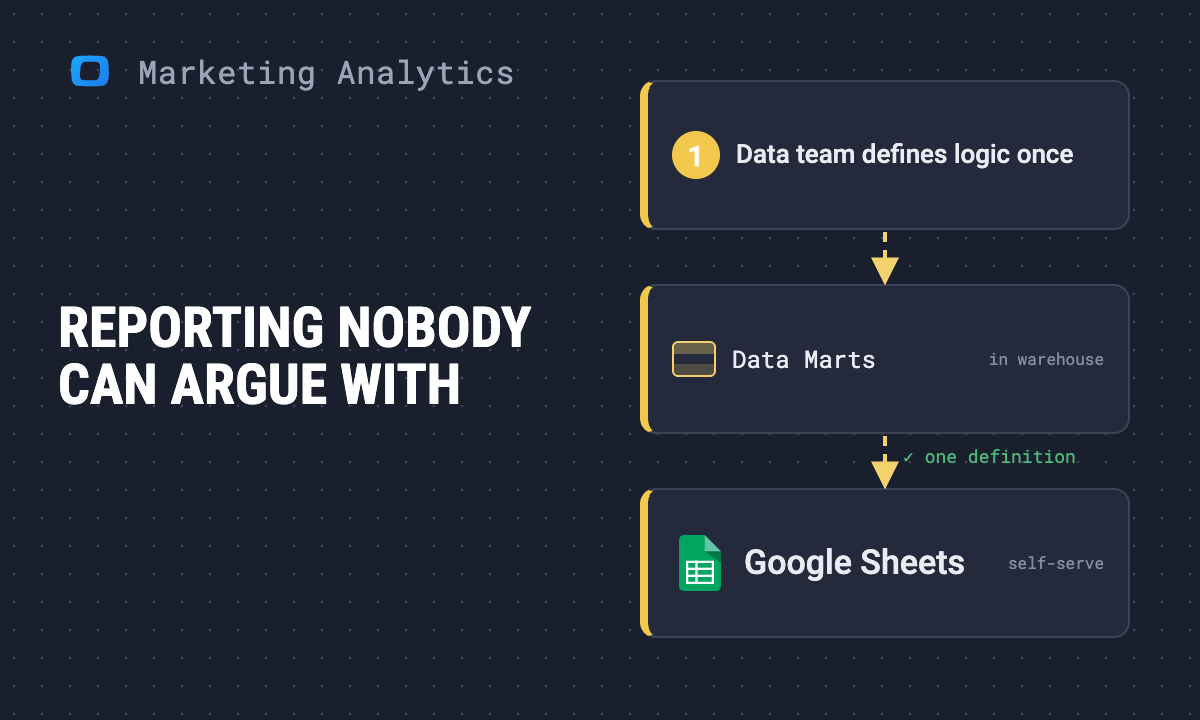 Article · Marketing AnalyticsHow to get marketing reporting nobody can argue with
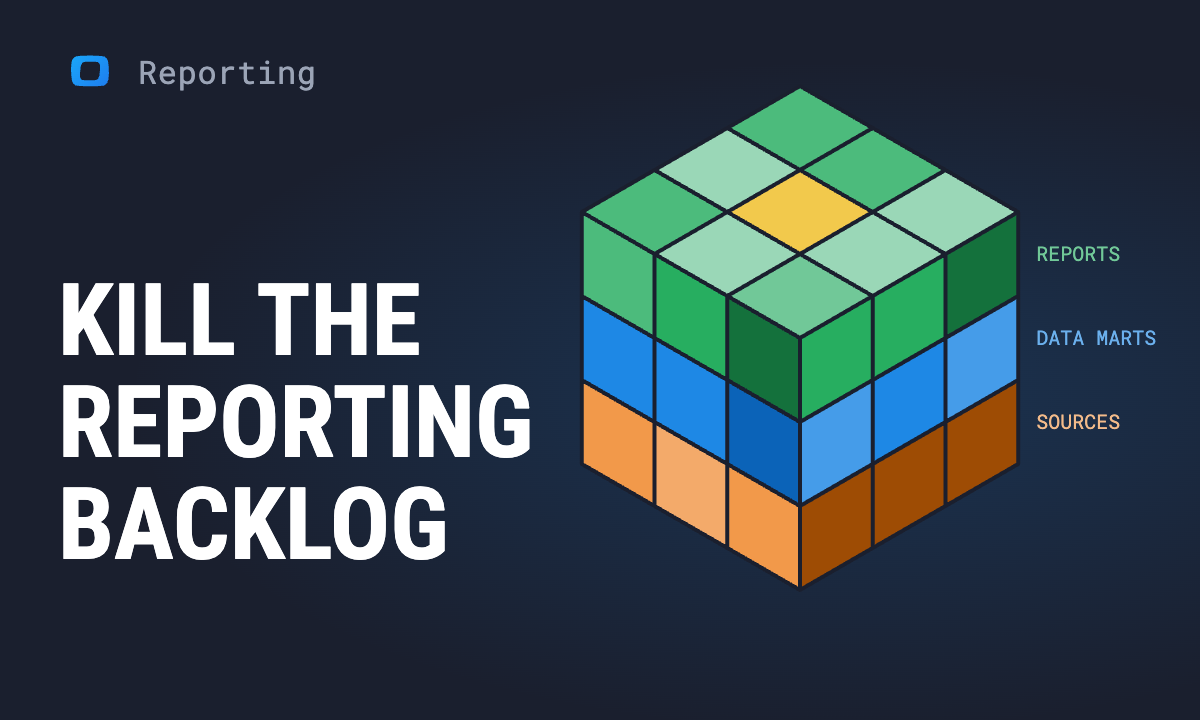 Article · ReportingThe analyst's guide to killing the reporting backlog (without hiring)
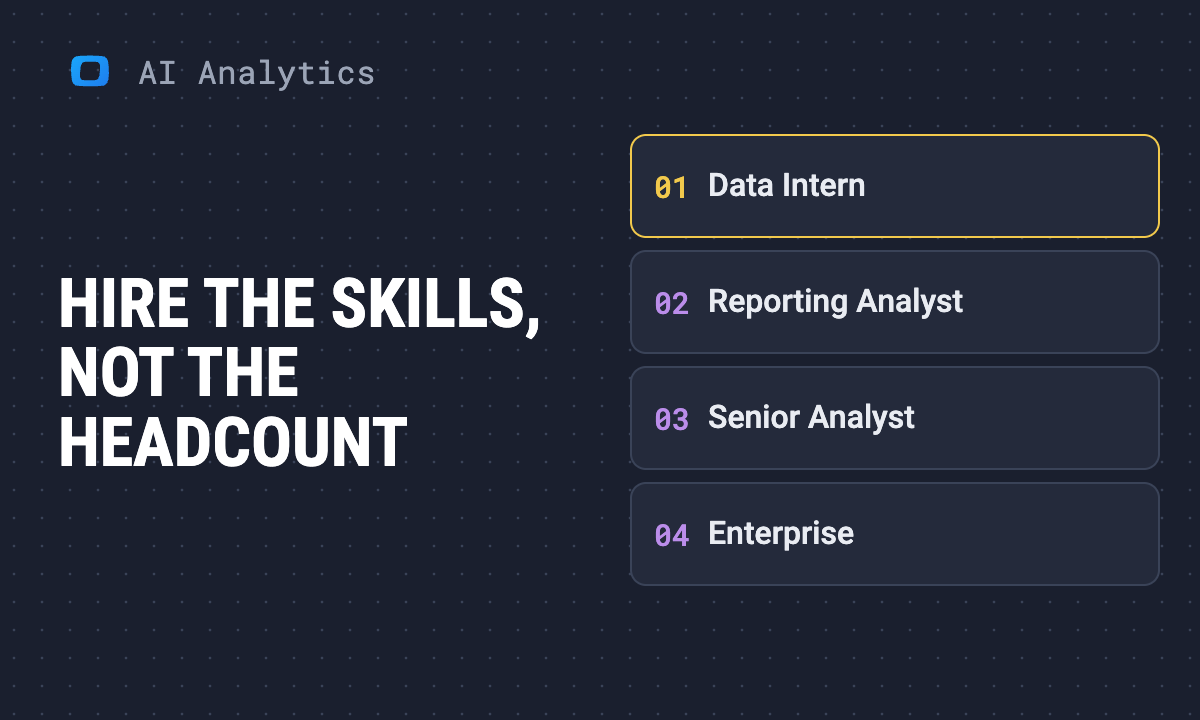 Article · AI in AnalyticsThe AI reporting analytics team that replaces your backlog, not your people
 Article · AI in AnalyticsSelf-service analytics doesn't exist. Here's the architecture that works.
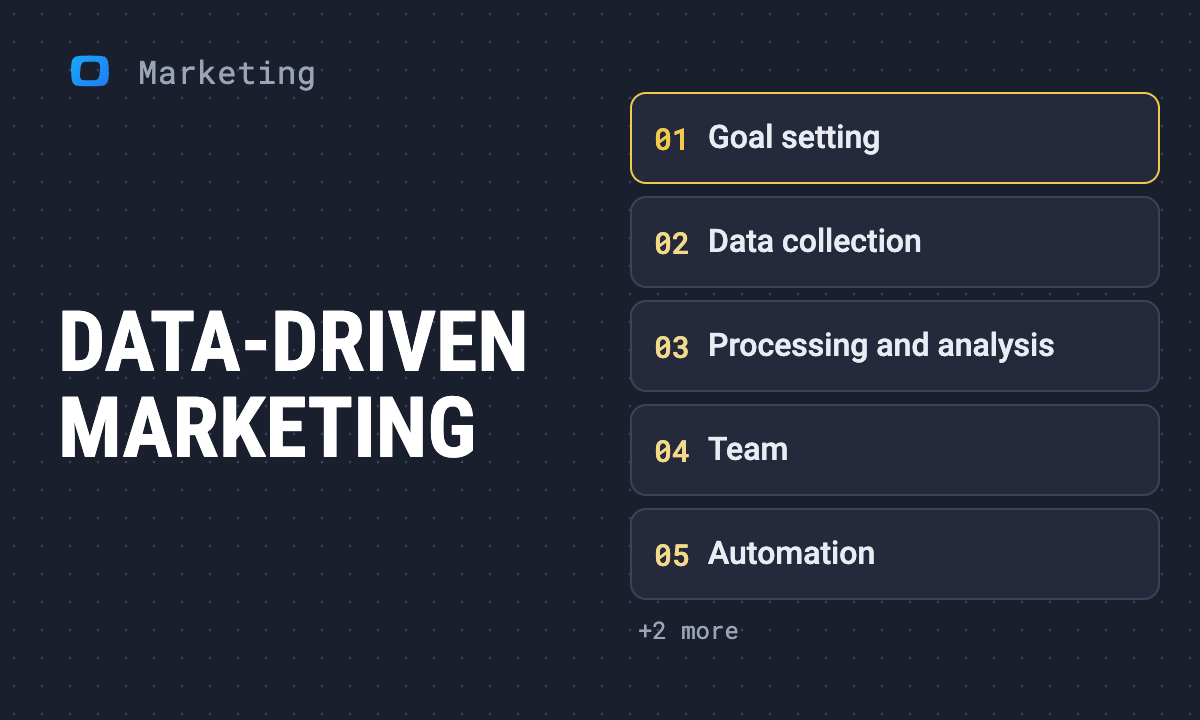 Article · Marketing StrategyData-driven marketing: The ultimate guide
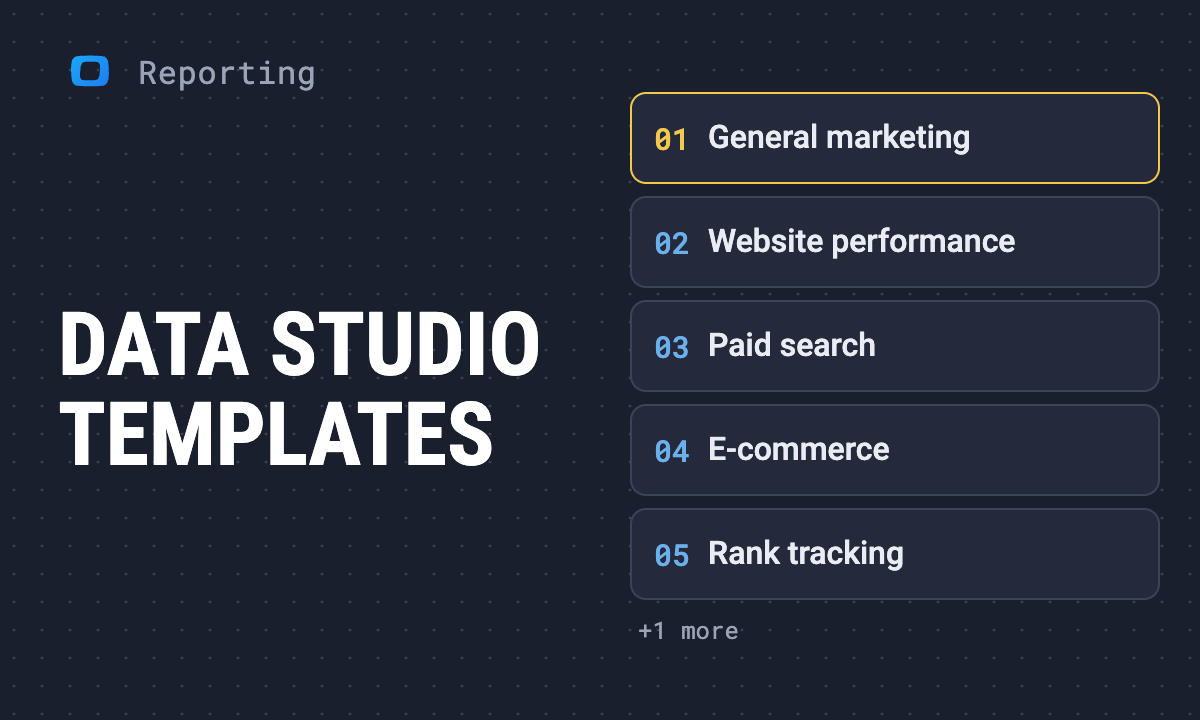 Article · ReportingLooker Studio templates for marketers in 2026
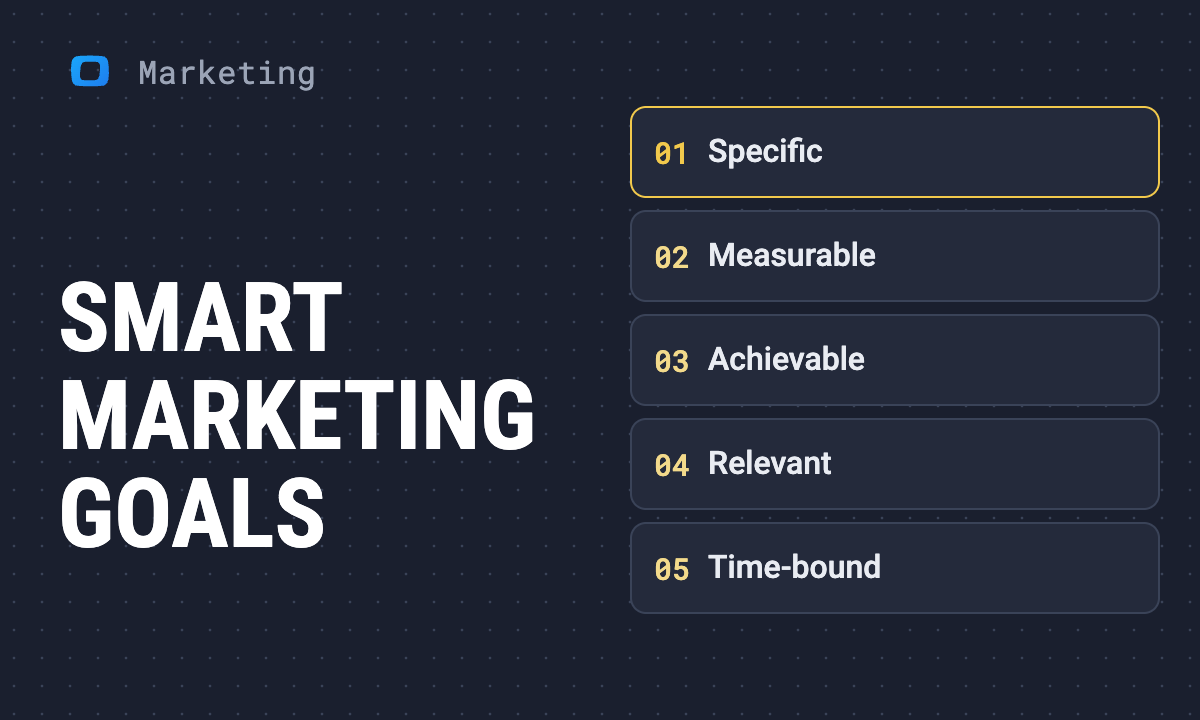 Article · Marketing StrategyAchieving success with SMART marketing goals
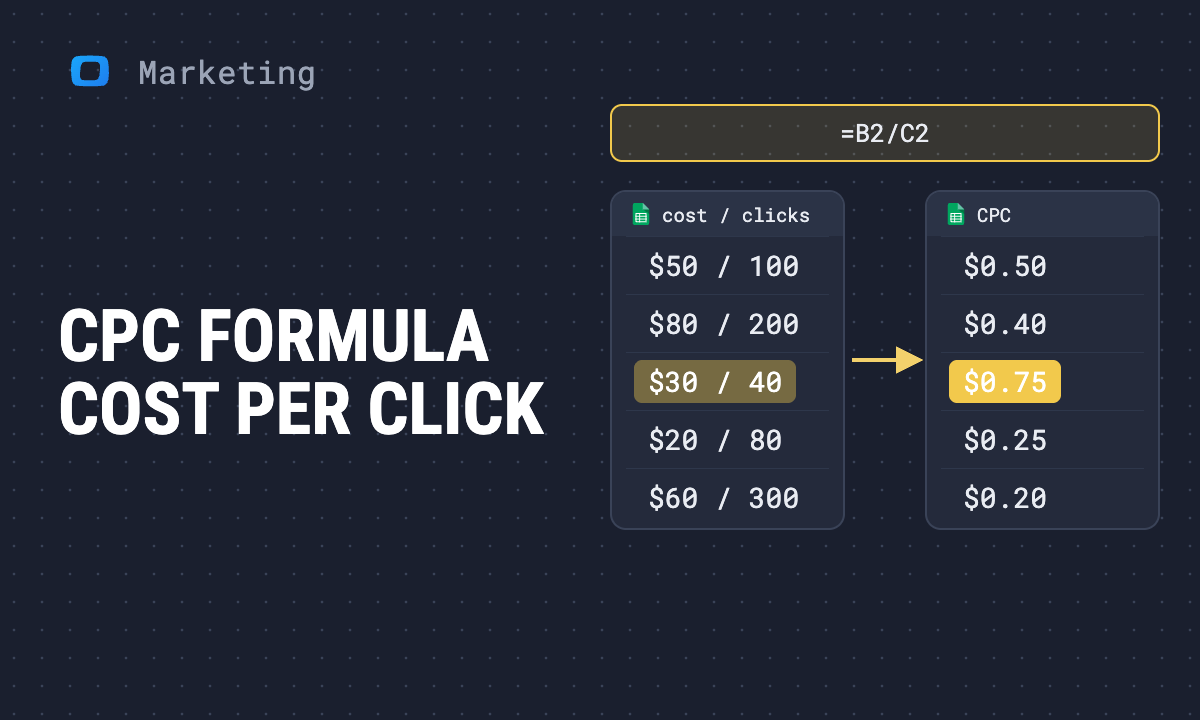 Article · Marketing StrategyWhat is cost per click in advertising: CPC formula and calculation
 Article · Marketing StrategyA comprehensive guide to cost per lead in marketing
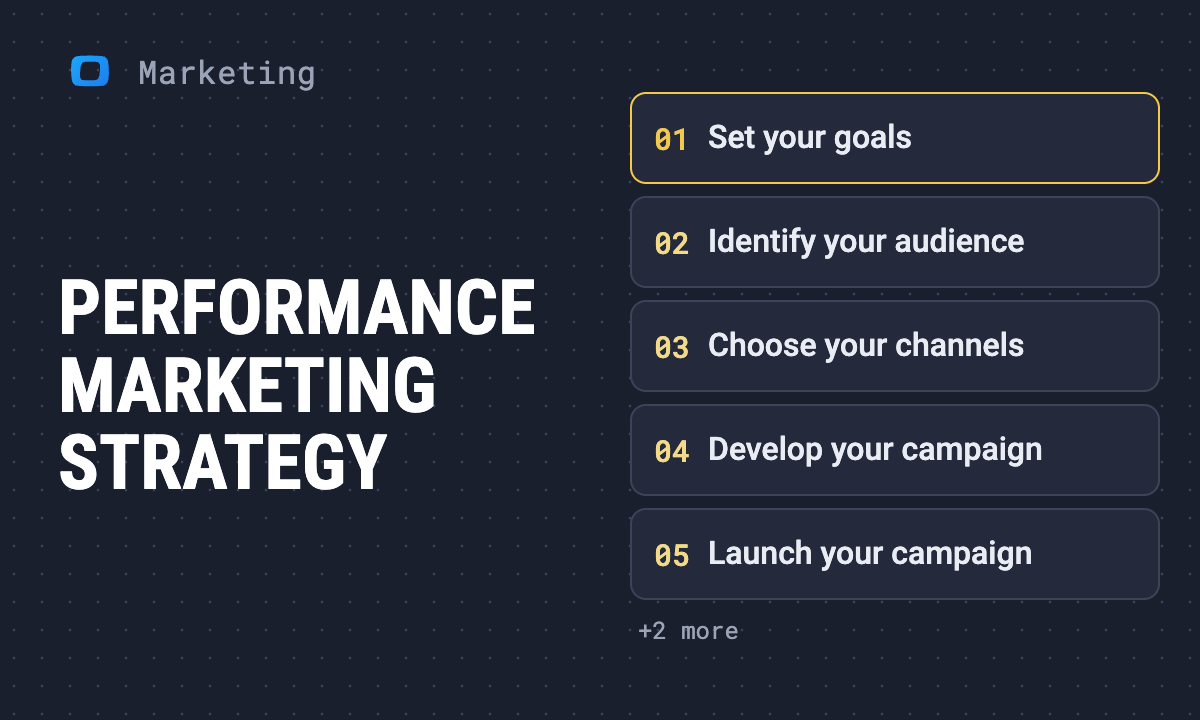 Article · Marketing StrategyPerformance marketing strategy: 7 key steps to achieve better results in 2025
 GlossaryCAST AS BOOL in SQL
 GlossaryCAST AS TIMESTAMP in SQL: Definition and Dialect Notes
 GlossaryCURRENT_DATE in SQL
 GlossaryCAST AS DATETIME in SQL
 GlossaryCAST AS FLOAT64 in SQL
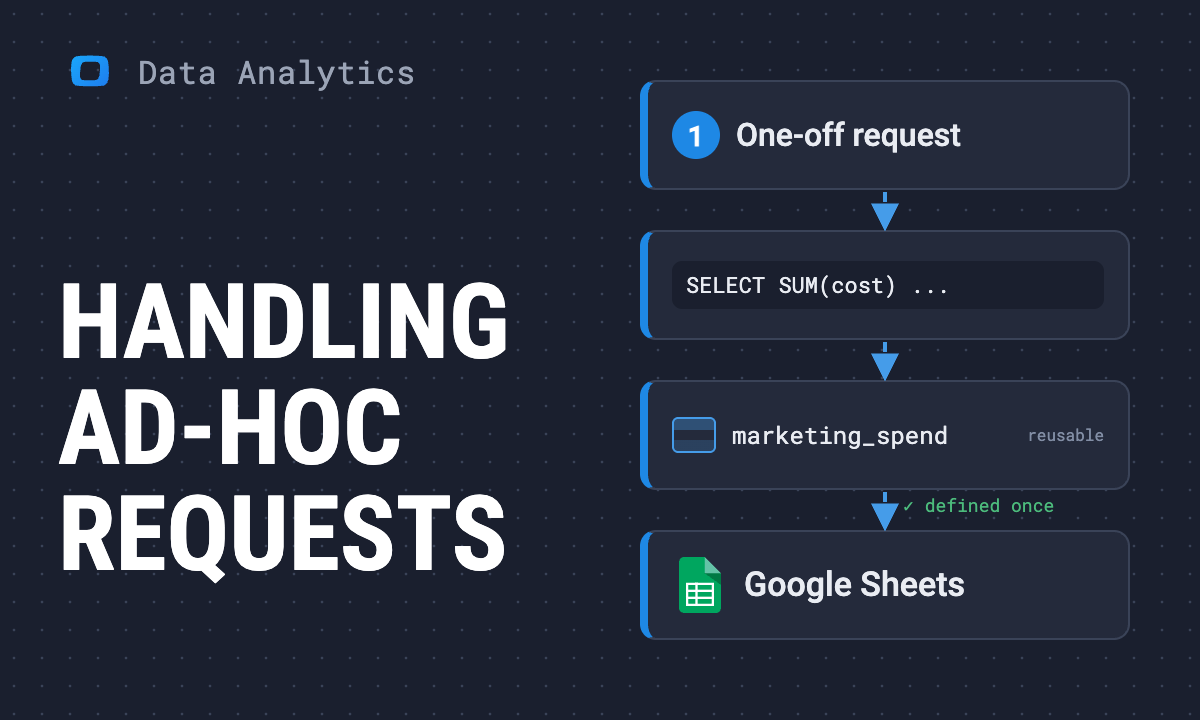 Article · Data AnalyticsThe analyst’s survival guide to ad-hoc requests from business teams
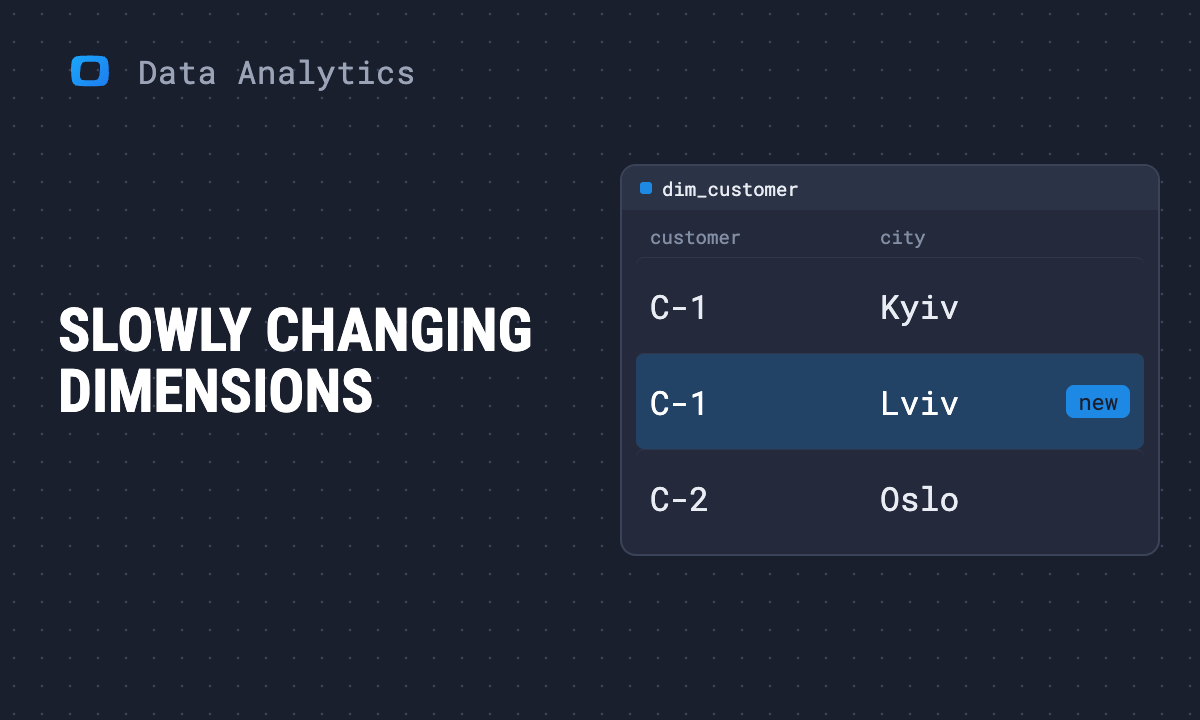 Article · Data AnalyticsWhat are slowly changing dimensions? Types, examples & best practices
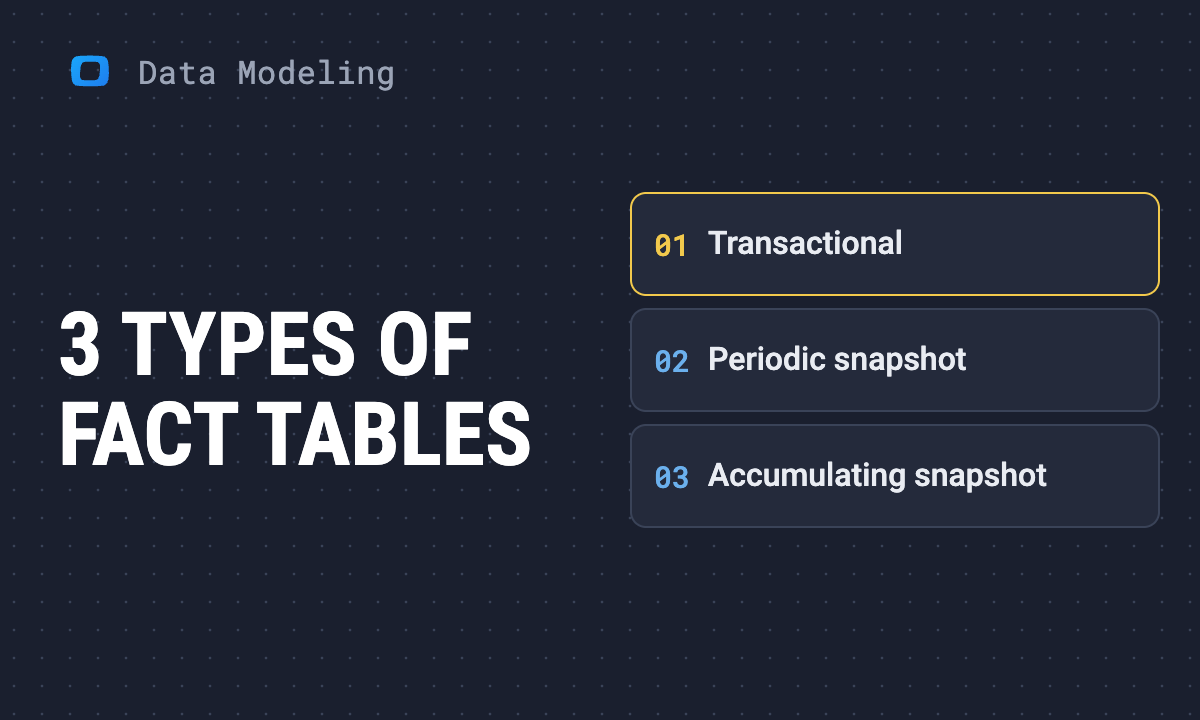 Article · Data ModelingThe three types of fact tables
 GlossaryCAST AS INTERVAL in SQL
 GlossaryData Quality Metrics
 GlossaryServer-Side Tracking
 GlossaryBYTE_LENGTH in SQL
 GlossaryWhat is Data Standardization? Methods & Benefits
 GlossaryHealthcare Analytics
 GlossaryARRAY_CONCAT in SQL
 GlossaryCustom Query Connection
 GlossaryData Ambiguity
 GlossaryTIME_DIFF Function in SQL: Syntax & Use
 GlossaryWhat is Session Merging? Definition & Guide
 GlossaryUNNEST in SQL: Flatten Arrays & Structs
 GlossaryFORMAT Function in SQL
 GlossaryWhat is a Modeled Conversion? Definition & Guide
 GlossarySupply Chain Optimization: Methods & Tools
 GlossaryDATE_FROM_UNIX_DATE in SQL
 GlossaryDATE_DIFF Function in SQL
 GlossaryFORMAT_DATETIME in SQL
 GlossaryFORMAT_TIMESTAMP in SQL
 GlossaryFacebook Ads Access Token
 GlossaryGoogle Analytics Debugger
 GlossaryCAST AS DATE in SQL
 GlossaryCHAR_LENGTH in SQL
 GlossaryFORMAT_DATE in SQL
 GlossarySAFE_CAST in SQL: Definition and Quick Reference
 GlossaryARRAY_LENGTH in SQL
 GlossaryARRAY in SQL
 GlossaryDATE_TRUNC Function in SQL
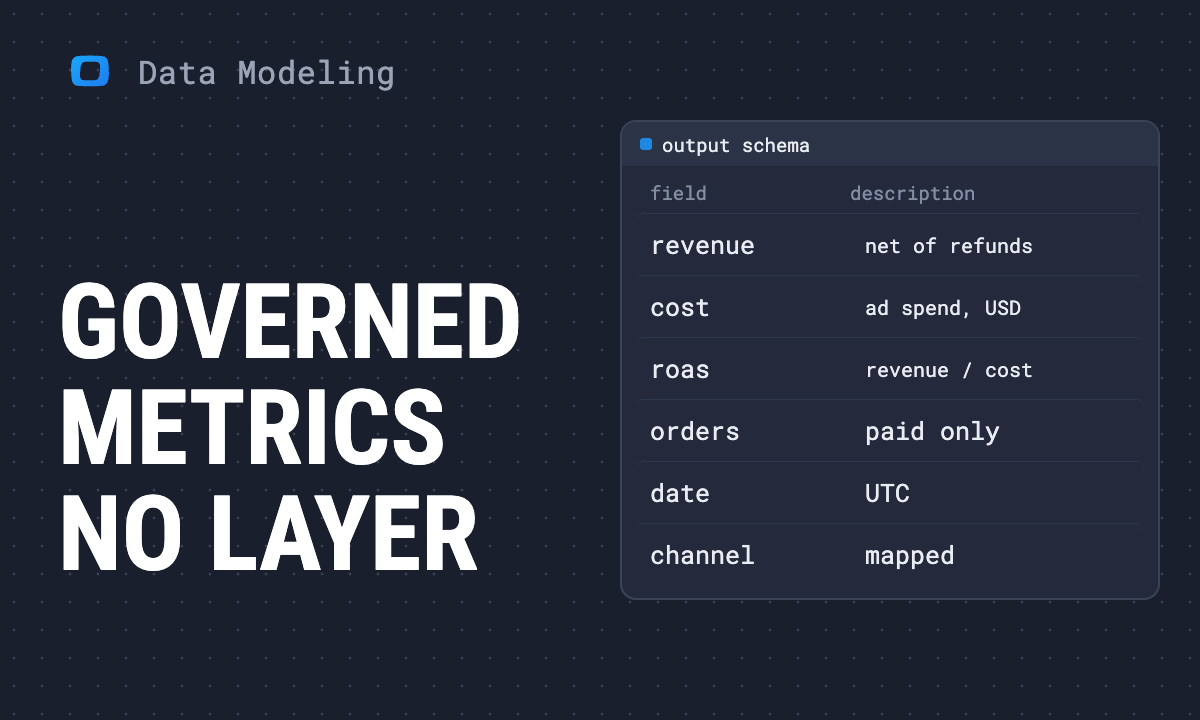 Article · Data ModelingGoverned metrics without a full semantic layer: Mastering output schemas
 GlossaryCAST AS STRUCT in SQL
 GlossaryCross-Device User Profiles
 GlossaryGENERATE_DATE_ARRAY in SQL Syntax & Examples
 GlossaryPARSE_TIMESTAMP in SQL
 GlossaryWhat is ROPO Analysis? Definition & Guide
 Article · Data AnalyticsFrom backlog to library: Turning tickets into reusable Data Marts
 GlossaryCOALESCE in ARRAY
 GlossaryCRM Data Insights
 GlossaryCustom Events in GA4
 GlossaryData Modeling in Retail
 GlossaryData Quality Framework
 GlossaryData Quality Monitoring
 GlossaryDATE_SUB Function in SQL
 GlossaryWhat is Real-Time Analytics? Tools & Use Cases
 GlossarySAFE.PARSE_DATE in SQL: Definition and Format Patterns
 GlossaryARRAY_TO_STRING in SQL
 GlossaryCAST AS ARRAY in SQL
 GlossaryCAST AS BYTES in SQL
 GlossaryUNIX_DATE Function in SQL: Syntax & Use
 GlossaryAnalytics-Ready Data
 GlossaryCAST AS NUMERIC in SQL
 GlossaryData Modeling in Healthcare
 GlossaryLAST_DAY Function in SQL
 GlossaryPARSE_DATE Function in SQL
 GlossaryWhat is a Data Product? Definition & Examples
 GlossaryGENERATE_TIMESTAMP_ARRAY in SQL
 GlossaryPARSE_NUMERIC in SQL
 GlossarySelf-Service Analytics Enablement
 GlossaryBigQuery Performance Optimization
 GlossaryBigQuery Studio
 GlossaryBusiness-Ready Data
 GlossaryCAST AS BIGNUMERIC in SQL
 GlossaryCAST AS INT64 in SQL
 GlossaryNaming Conventions in Analytics
 GlossarySELECT AS STRUCT in BigQuery
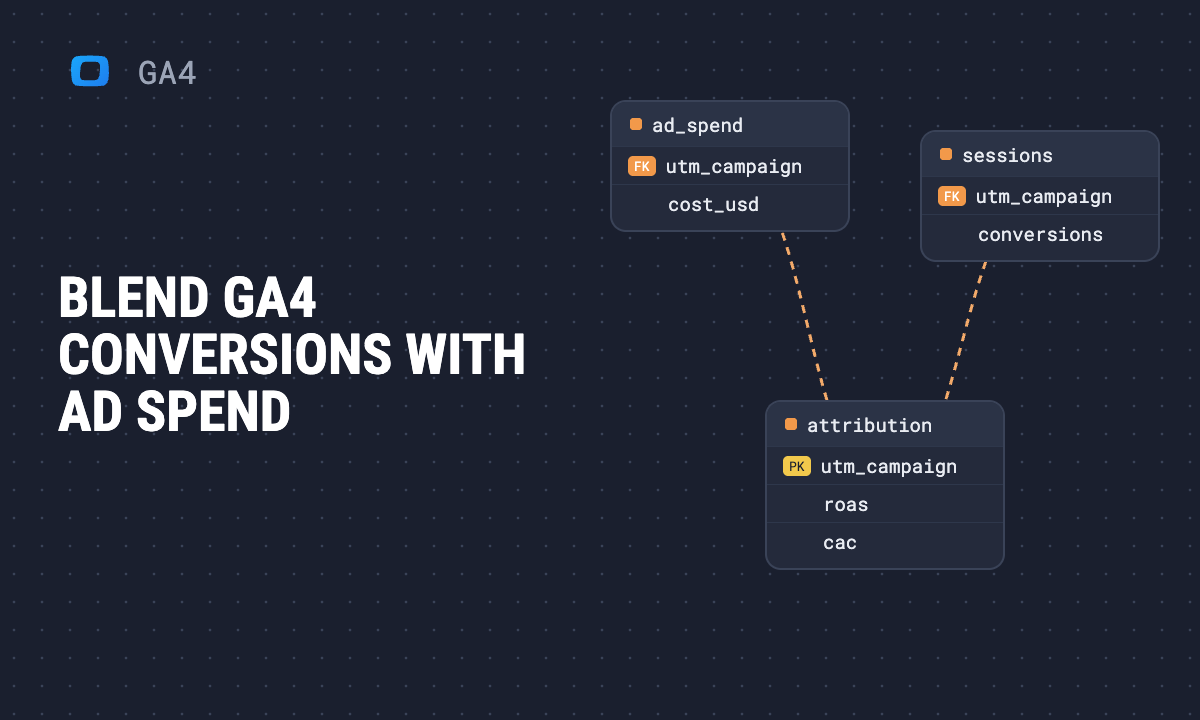 Article · GA4How to blend GA4 conversions with advertising spend
 Article · ReportingFrom analyst bottleneck to scalable reporting: Packaging data for non-SQL users
 Webinar · Marketing Analytics5 Questions Marketers Should Ask Their Data
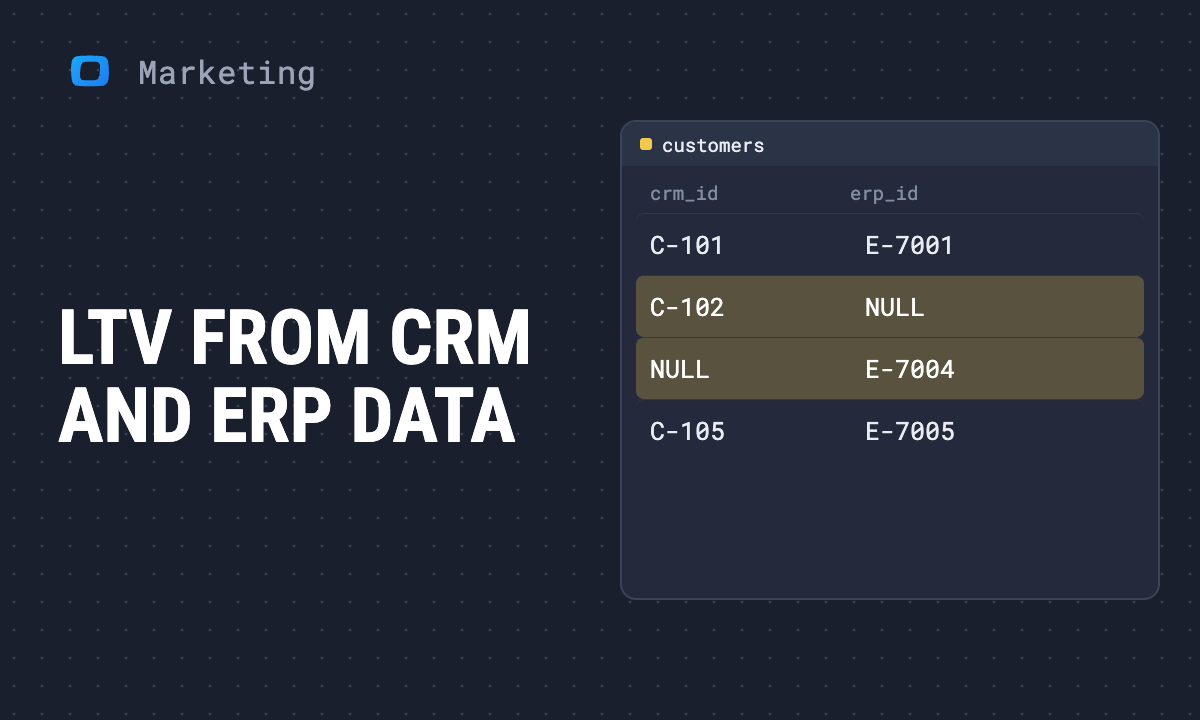 Article · Marketing StrategyHow to calculate LTV with CRM and ERP
 GlossaryCONTAINS_SUBSTR in BigQuery
 GlossaryINITCAP Function in SQL
 GlossaryINSTR Function in SQL
 GlossaryLPAD Function in SQL
 GlossaryLTRIM Function in SQL
 GlossaryNORMALIZE Function in SQL
 GlossaryREGEXP_EXTRACT_ALL in SQL
 GlossaryREGEXP_INSTR Function in SQL
 GlossaryREPEAT Function in SQL
 GlossaryREVERSE Function in SQL
 GlossaryRTRIM Function in SQL
 GlossarySTRPOS Function in BigQuery: Syntax & Use
 GlossaryData Integrity
 GlossaryData Mart Architecture
 GlossaryWhat is Data Redundancy? Definition & Examples
 GlossaryWhat is a Data Source Schema? Definition & Guide
 GlossaryWhat is a Data Vault Schema? Design & Examples
 GlossaryFact Constellation Schema
 GlossaryWhat is Grain in a Fact Table? Definition
 GlossaryWhat is an OLAP Cube? Definition & Architecture
 GlossaryOperational Data Store (ODS)
 GlossaryWhat is an Outrigger Dimension? Definition
 GlossaryWhat is Query Complexity? Types & Optimization
 GlossaryQuery Performance
 GlossaryScalability in Data Modeling
 GlossaryWhat is a Shrunken Dimension? Definition & Guide
 GlossarySubject-Oriented Design: Definition & Use
 GlossaryWhat is a Swappable Dimension?
 GlossaryTRIM Function in BigQuery: Syntax & Use
 GlossaryACID Compliance
 GlossaryCommon Table Expression (CTE)
 GlossaryCTE Query Optimization
 GlossaryCTE vs Temporary Table
 GlossaryWhat is a Dependent Data Mart? Definition & Guide
 GlossaryWhat is a Hybrid Data Mart? Definition & Guide
 GlossaryWhat is an Independent Data Mart? Definition
 GlossaryInvalid Geometry in BigQuery
 GlossaryMulti-CTE Query in SQL
 GlossaryNested CTE in SQL
 GlossaryOLAP in Data Modeling
 GlossaryRecursive CTE in SQL
 GlossaryRecursive Iteration Limit in SQL
 GlossaryST_DISTANCE in BigQuery: Syntax & Examples
 GlossaryStep-by-Step CTE Debugging in SQL
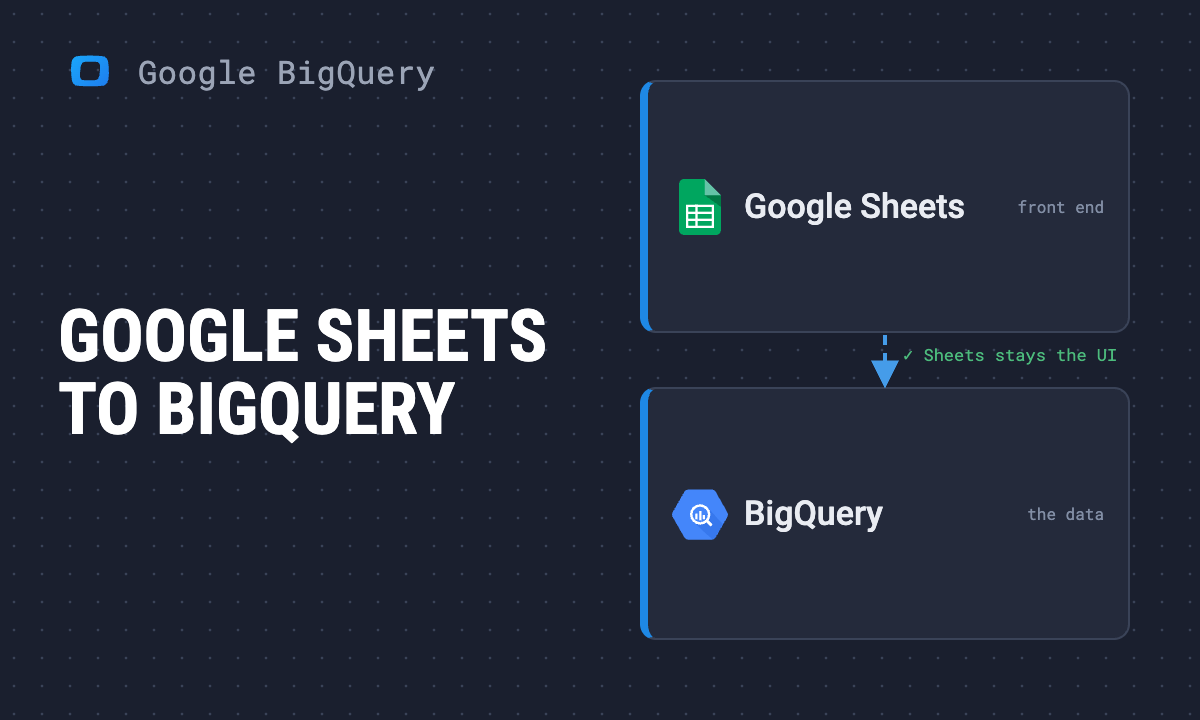 Article · Google BigQueryGoogle Sheets to BigQuery: How to scale your analyst workflow without buying new tools
 GlossaryData Modeling Best Practices
 GlossaryLogical to Physical Model Transformation
 GlossaryData Mart in OWOX
 GlossaryAttribute Hierarchy
 GlossaryClustering in BigQuery Views
 GlossaryData Drift
 GlossaryData Modeling Stages
 GlossaryWhat is Data Skew? Causes, Types & Fixes
 GlossaryEntity-Relationship Modeling (ERM)
 GlossaryWhat is a Fact Table? Definition & Examples
 GlossaryWhat is Granularity in Data? Definition & Guide
 GlossaryJensen-Shannon Divergence
 GlossaryML.TFDV_DESCRIBE in BigQuery
 GlossaryML.VALIDATE_DATA_DRIFT in BigQuery
 GlossaryWhat is an OLAP System? Architecture & Use Cases
 GlossaryOpen Source ETL Tools
 GlossaryWhat are Partitioned Views? Definition & Guide
 GlossaryQualified Table Reference
 GlossaryREGEXP_REPLACE in SQL
 GlossaryStatic Schema in BigQuery Views
 GlossarySurrogate Key: Definition & Examples
 GlossaryWasserstein Distance: Definition & Use Cases
 GlossaryData Modeling Process
 GlossaryData Modeling Techniques
 GlossaryWhat is a Dimension Table? Definition & Examples
 GlossaryALTER MATERIALIZED VIEW in BigQuery
 GlossaryBigQuery Data Source
 GlossaryCREATE MATERIALIZED VIEW in BigQuery
 GlossaryDROP MATERIALIZED VIEW in BigQuery
 GlossaryML.EVALUATE in BigQuery
 GlossaryML.FORECAST in BigQuery
 GlossaryML.PREDICT in BigQuery
 GlossaryPartitioned Tables in BigQuery
 GlossaryPre-Calculated Reporting Table
 GlossaryBigQuery SQL Query Editor: Features & Tips
 Webinar · Data AnalyticsAnalytics Career Survival Hackathon 2025
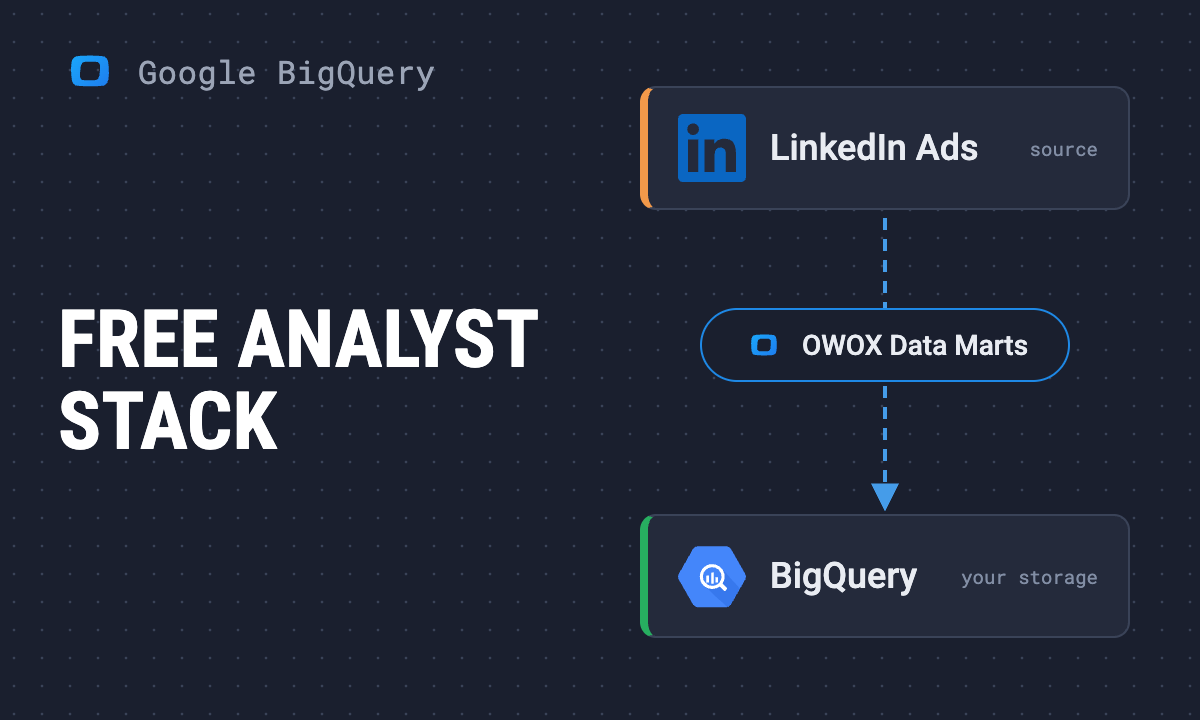 Article · Google BigQueryHow to build a free modern analytics stack with JavaScript, SQL, BigQuery & OWOX
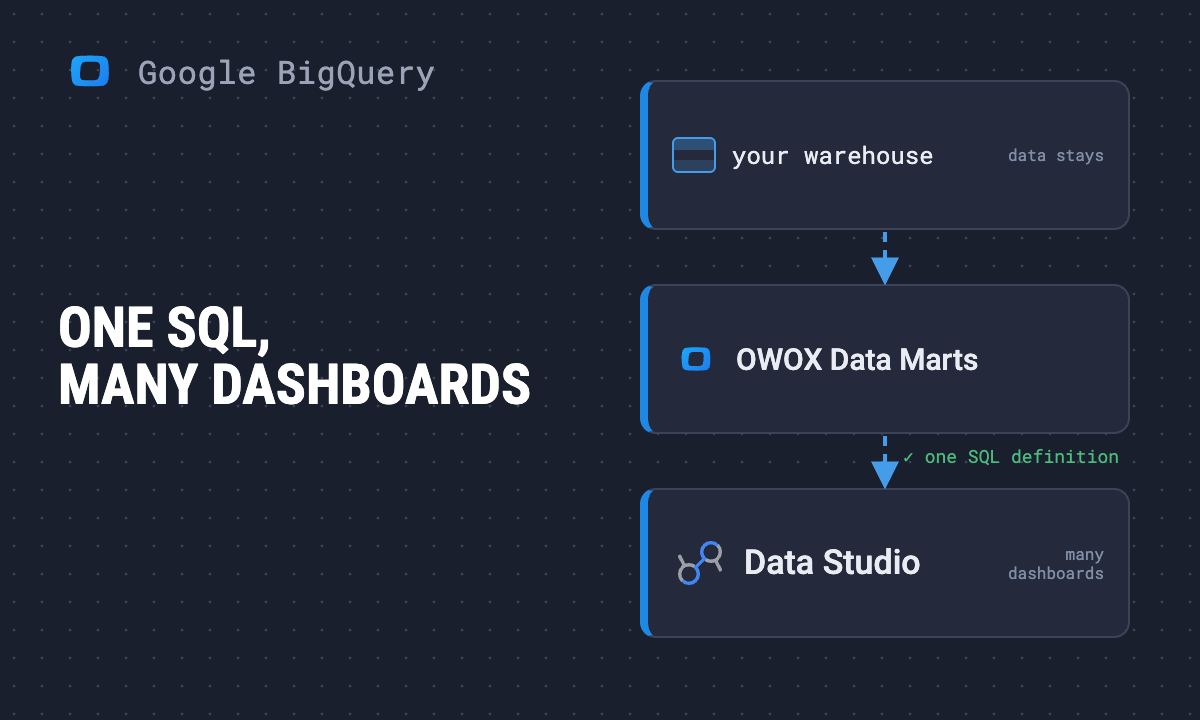 Article · Google BigQueryWhy you should store your BigQuery SQL for Looker Studio in OWOX Data Marts
 GlossaryAbstraction in Data Modeling
 GlossaryClass in Data Modeling
 GlossaryEncapsulation in Data Modeling
 GlossaryObject-Oriented Data Model (OODM)
 GlossaryOODBMS
 GlossaryObject Query Language (OQL)
 GlossaryPolymorphism in Data Modeling
 GlossaryArray Fields
 GlossaryBigQuery Connector for Looker Studio
 GlossaryCREATE MODEL in BigQuery ML
 GlossaryWhat is Schema-on-Read? Definition & Guide
 GlossaryTime Travel in Data Lakehouses Explained
 GlossarySelf-Service BI Tools
 GlossaryWhat is Qualitative Research? Methods & Guide
 GlossarySampling Techniques
 Podcast · Data AnalyticsWhy Analysts Hate SaaS Tools
 GlossaryData Security Cost Considerations
 GlossaryData Security Governance
 GlossaryData Security Standards
 GlossaryWhat is Looker? Features & Use Cases
 GlossaryRole-Based Access Control (RBAC)
 GlossarySQL Injection: Risks, Types & Prevention
 Podcast · Data AnalyticsFrom Firefighting to Strategy
 GlossaryData Privacy for BigQuery
 GlossaryData Privacy for dbt
 GlossaryData Privacy for Snowflake
 GlossaryData Privacy Governance
 GlossaryAI-Powered Data Modeling
 GlossaryBI Dashboards
 GlossaryData Analysis Tools
 GlossaryData Anomaly Detection
 GlossaryData Anonymization
 GlossaryData-Driven Decision Making
 GlossaryData Exploration
 GlossaryData Graph
 GlossaryWarehousing Solutions: Types & Comparison
 Podcast · Data AnalyticsTrain Business Users for Data Exploration
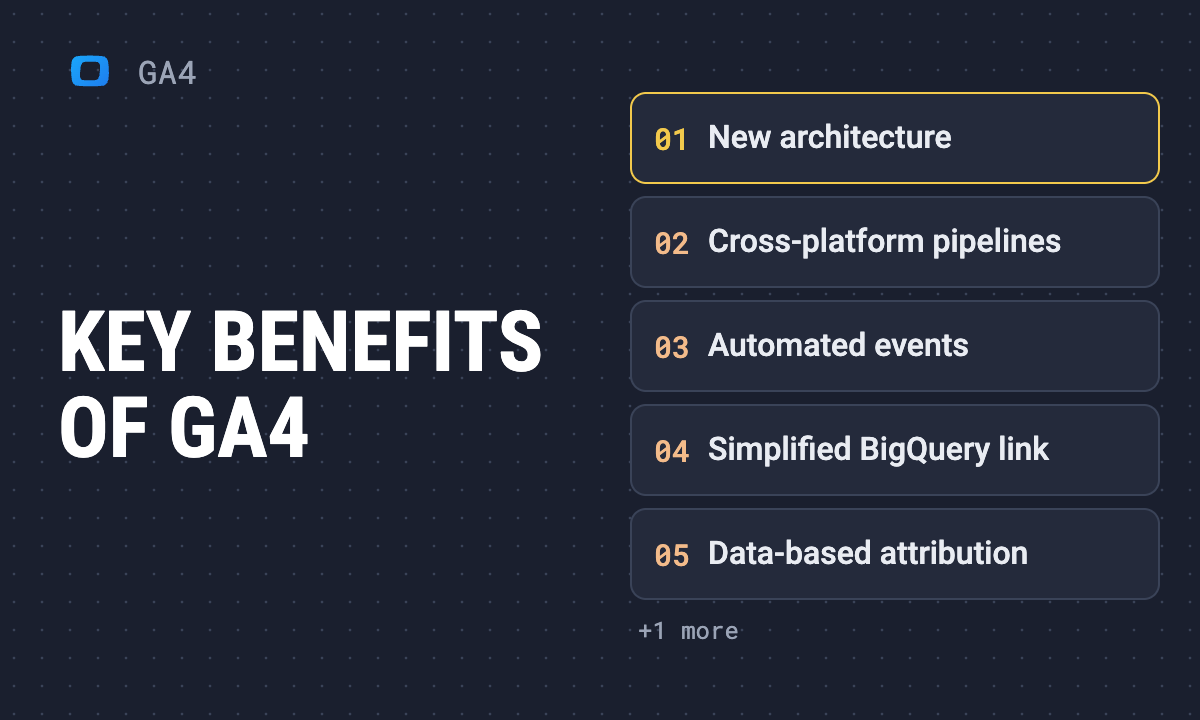 Article · GA4Key benefits of Google Analytics 4
 GlossaryStored Procedures in SQL: Guide & Examples
 GlossarySystem Stored Procedures in SQL
 GlossaryT-SQL (Transact-SQL): Overview & Guide
 GlossaryVersion Control for Databases Explained
 GlossaryView Management in Databases: Best Practices
 GlossaryVisual Representation in Data Modeling
 GlossarySQL Logic: Meaning & Use Cases
 GlossaryWhat is SQLMesh? Data Modeling Framework
 GlossaryWhat are Standard Views in SQL?
 GlossaryWhat is a Relational Database? Definition & Guide
 GlossaryReverse Engineering Databases
 GlossarySchema Comparison
 GlossarySchema Reporting
 GlossarySchema Visualization
 GlossarySemi-Structured Data Model
 GlossarySQL Functions: Types, Syntax & Examples
 GlossaryWhat is SQL Generation? Purpose & Examples
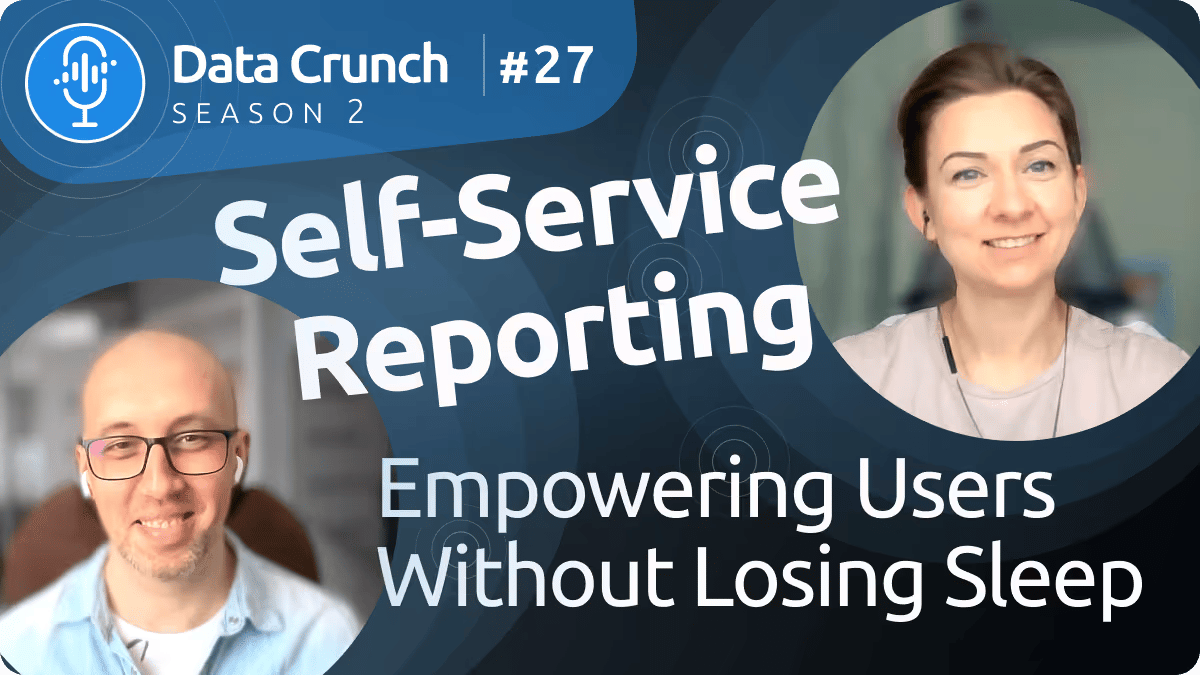 Podcast · ReportingSelf-Service Reporting Done Right
 GlossaryWhat is Parameterization? Definition & Examples
 GlossaryParameterized Query
 GlossaryWhat is Precompiled SQL? Definition & Benefits
 GlossaryQuery Efficiency
 GlossaryQuery Parameter Support
 GlossaryQuery Tuning
 GlossaryReal-Time Collaboration in Data Teams
 GlossaryRelational Database Design
 Podcast · ReportingHidden Costs of Copy-Paste Reporting
 GlossaryGovernance Strategies
 GlossaryIDE Integration for Data Tools
 GlossaryWhat is an Identified Relationship? Definition
 GlossaryWhat is a Materialized View? Definition & Guide
 GlossaryModel Iteration in Data Modeling
 GlossaryModern Data Catalog Tools
 GlossaryMulti-Step Transformation
 GlossaryNon-Identified Relationship
 GlossaryDrag-and-Drop Interface
 GlossaryWhat is Dynamic SQL? Definition & Examples
 GlossaryEnterprise Conceptual Data Model
 GlossaryWhat is Execute Permission? Definition & Guide
 GlossaryWhat is an Execution Plan? SQL Query Optimization
 GlossaryWhat is Forward Engineering? Database Guide
 GlossaryGitOps for Database Management
 GlossaryStar Schema: Definition & Examples
 Podcast · Data AnalyticsBuild a Reusable SQL Library
 GlossaryWhat is a Derived Attribute? Definition & Examples
 Podcast · Data AnalyticsControl vs. Collaboration in Analytics
 GlossaryData Layer
 GlossaryData Model Optimization
 GlossaryData Model Partitioning
 GlossaryData Model Versioning
 GlossaryData Modeling Conventions
 GlossaryData Modeling Documentation
 GlossaryData Modeling Granularity
 Webinar · Data IntegrationOwn Your Data
 GlossaryData Transformation Frameworks
 GlossaryDatabase Logic in SQL
 GlossaryDatabase Schema Diagram
 GlossaryDatabase Schema Lineage
 GlossaryData Modeling Tools
 GlossaryData Profiling for Redshift
 GlossaryData Profiling for Snowflake
 GlossaryData Quality for dbt
 GlossaryData Quality for Snowflake
 GlossaryWhat is Data Streaming? Definition & Use Cases
 Podcast · Data AnalyticsVersion Control in Analytics
 Podcast · Data AnalyticsAugmented Analytics for Smarter Insights
 GlossaryBind Variables in SQL
 GlossaryCaller’s vs. Owner’s Rights in SQL Stored Procedures
 GlossaryCLR Stored Procedures in SQL Server
 GlossaryCollaborative Diagramming
 GlossaryConceptual Diagram
 GlossaryConceptual Model in DBMS
 GlossaryCrow’s Foot Notation
 GlossaryData Architecture Diagram
 GlossaryData Duplication
 Podcast · Data AnalyticsFacepalm Moments in Analytics
 GlossaryBest Data Orchestration Tools
 GlossaryWhat are Data Practices? Standards & Implementation
 GlossaryData Quality Checks
 GlossaryData Retention Policies
 GlossaryWho are Data Stakeholders? Roles & Responsibilities
 GlossaryData Teams
 GlossaryWhat is DataOps? Definition, Benefits & Examples
 GlossaryWhat are Metadata Standards? Types & Examples
 GlossaryOrchestration Tools
 GlossaryScalable Infrastructure
 Success story · Case StudiesReformation: How OWOX Helped Reformation Make Smarter Decisions
 GlossaryBigQuery Views
 GlossaryData Ingestion
 GlossaryData Latency
 GlossaryData Lineage for BigQuery
 GlossaryData Lineage for Databricks
 GlossaryData Lineage for dbt
 GlossaryData Lineage for Redshift
 GlossaryData Mart Layer
 GlossaryData Model Integrity
 Podcast · Data AnalyticsBuilding Trust Through Data Lineage
 Video · Marketing Analytics5 Data Mistakes Even Smart Marketers Make All the Time
 GlossaryData Governance for Databricks
 GlossaryData Governance for Redshift
 GlossaryData Governance for Snowflake
 GlossaryData Governance Framework
 GlossaryData Infrastructure
 GlossaryData Documentation for dbt
 GlossaryData Documentation for Redshift
 GlossaryData Enrichment
 GlossaryData Federation
 GlossaryData Governance for BigQuery
 Podcast · Data AnalyticsSpot and Fix Hidden Data Issues
 GlossaryData Dictionary for BigQuery
 GlossaryData Discovery for BigQuery
 GlossaryData Discovery for Databricks
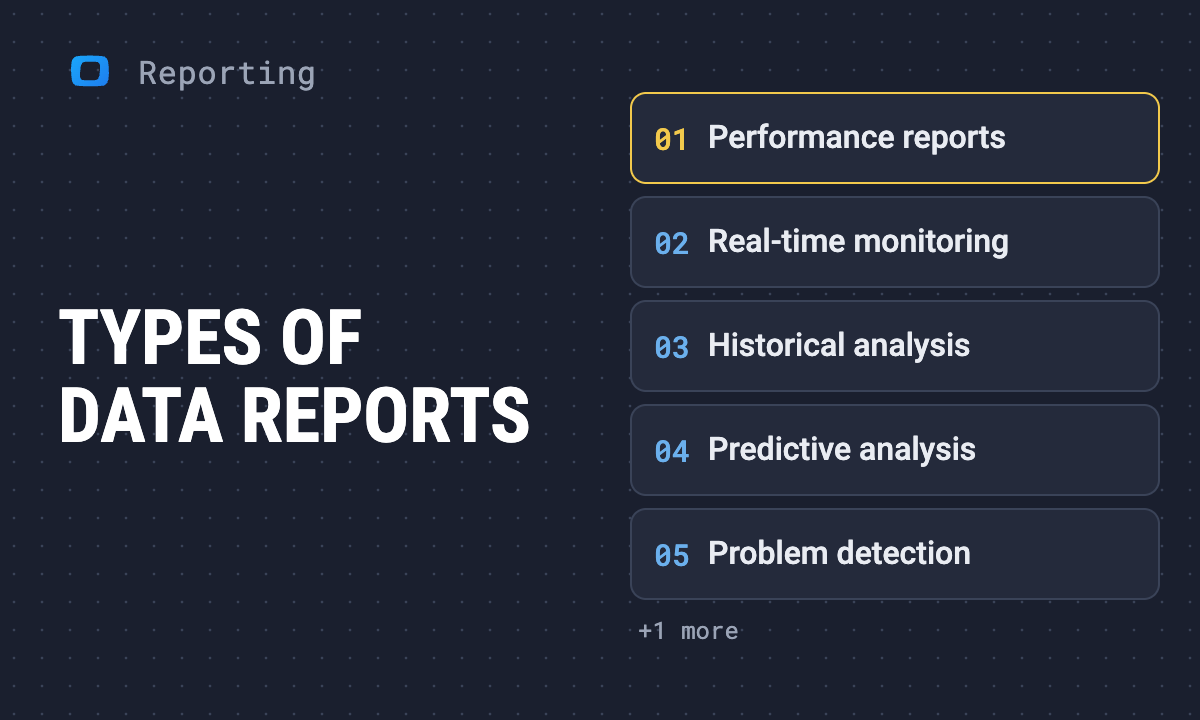 Article · ReportingWhat is data reporting and how to create data reports for your business
 GlossaryData Catalog
 GlossaryData Catalog for Snowflake
 GlossaryData Cleansing
 GlossaryData Cost Optimization
 GlossaryData Democratization
 GlossaryData Dictionary for Redshift
 GlossaryData Documentation for BigQuery
 Podcast · Data AnalyticsThe Self-Service Analytics Paradox
 GlossaryAssociative Entity
 GlossaryBusiness Rules in Data Models
 GlossaryCentralized Data Team
 GlossaryCost-Effective Data Management
 GlossaryData Catalog for BigQuery
 GlossaryData Catalog for Databricks
 GlossaryData Catalog for dbt
 GlossaryData Catalog for Redshift
 GlossaryWhat is a Weak Entity? Definition & Examples
 Podcast · Data ModelingData Preparation Challenges
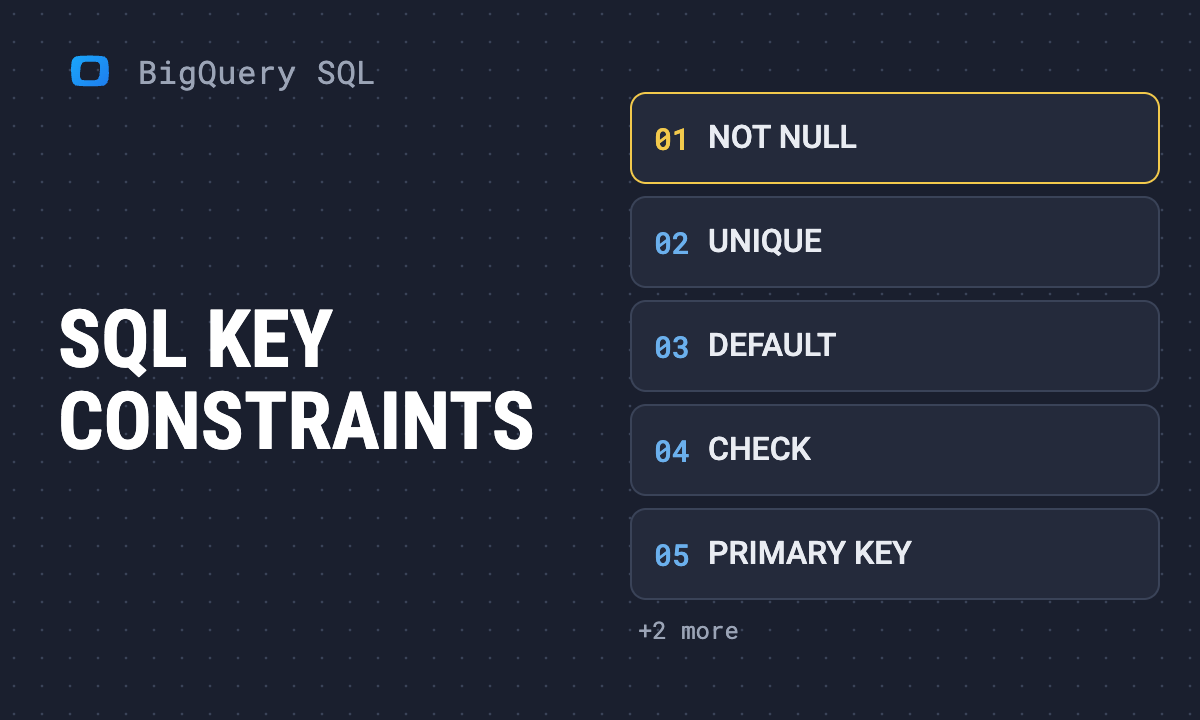 Article · SQL for AnalyticsUnderstanding key constraints in SQL for data integrity
 GlossaryWhat is a Subschema? Definition & Guide
 GlossaryWhat is Temporal Data? Definition & Guide
 GlossaryWhat is a View in a Database?
 PodcastProduct Analytics Culture in SaaS
 GlossaryOne-to-One Relationship (1:1)
 GlossaryWhat is Persistent Data? Definition & Examples
 GlossaryWhat is a Physical Data Model? Definition & Guide
 GlossaryWhat is Quality Assurance? Definition & Practices
 GlossaryRecursive Data Model
 GlossaryRecursive Relationship
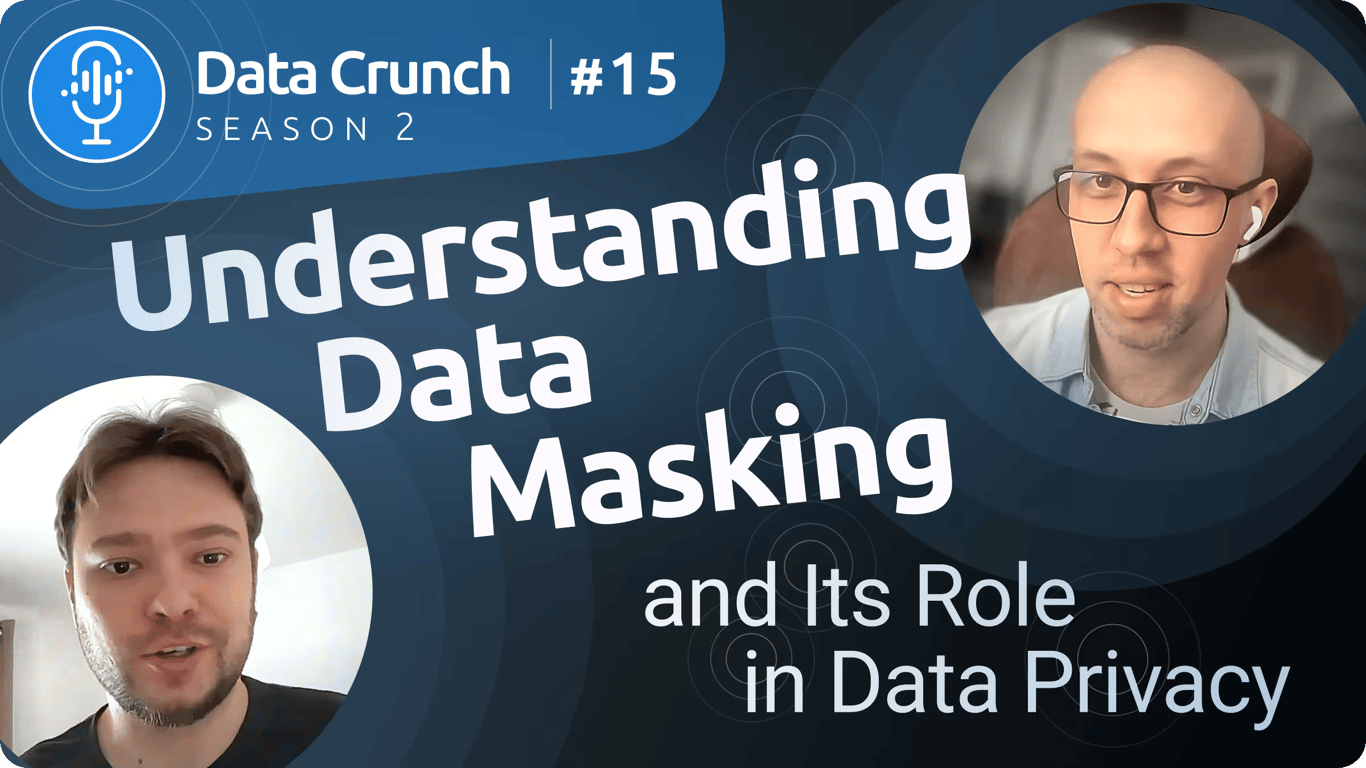 Podcast · SQL for AnalyticsData Masking for Privacy & Security
 GlossaryAnchor Modeling
 GlossaryBridge Table
 GlossaryData Model Abstraction
 GlossaryDatabase Schema
 GlossaryWhat is a Degenerate Dimension? Definition
 GlossaryDimensional Fact Model
 GlossaryWhat is a JOIN Key in SQL? Definition & Examples
 GlossaryWhat is a Logical Data Model? Definition & Guide
 GlossaryMany-to-Many Relationship (N:N)
 GlossaryOne-to-Many Relationship (1:N)
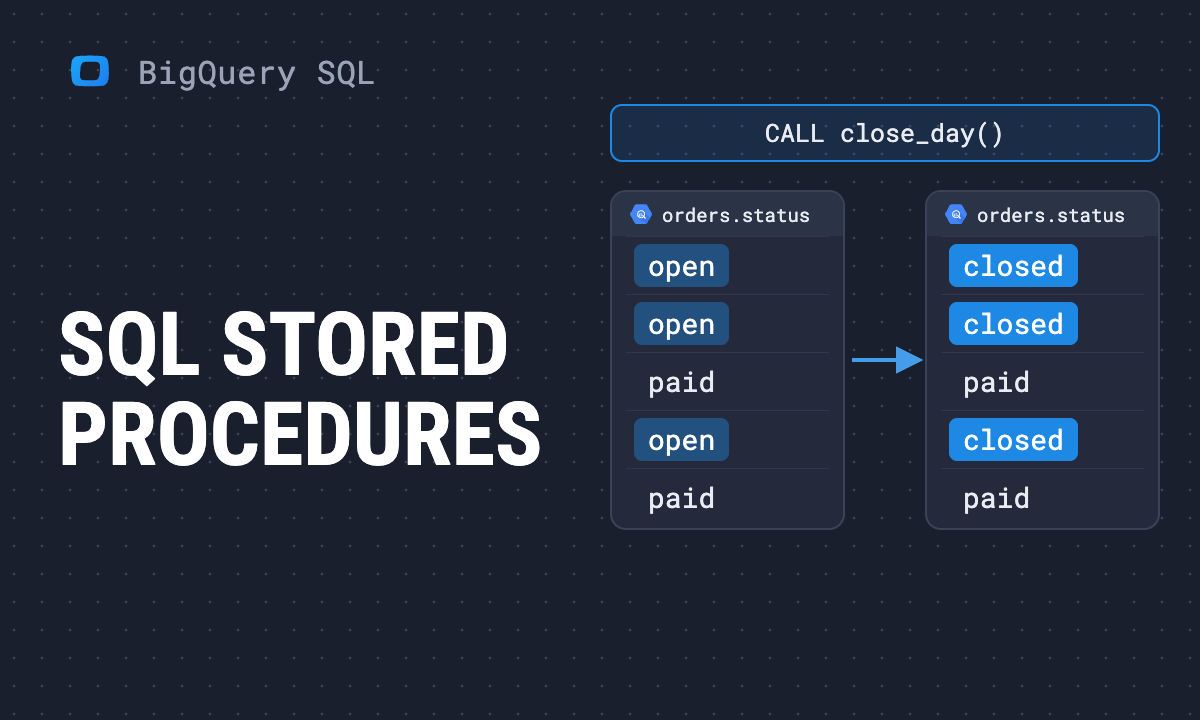 Article · SQL for AnalyticsStored procedures in SQL explained: Benefits, examples, and use cases
 GlossaryCardinality in Data Modeling
 GlossaryComposite Key
 GlossaryWhat is Data Orchestration? Tools & Examples
 GlossaryWhat is an Entity in Data Modeling? Definition
 GlossaryRelationships in Data Modeling
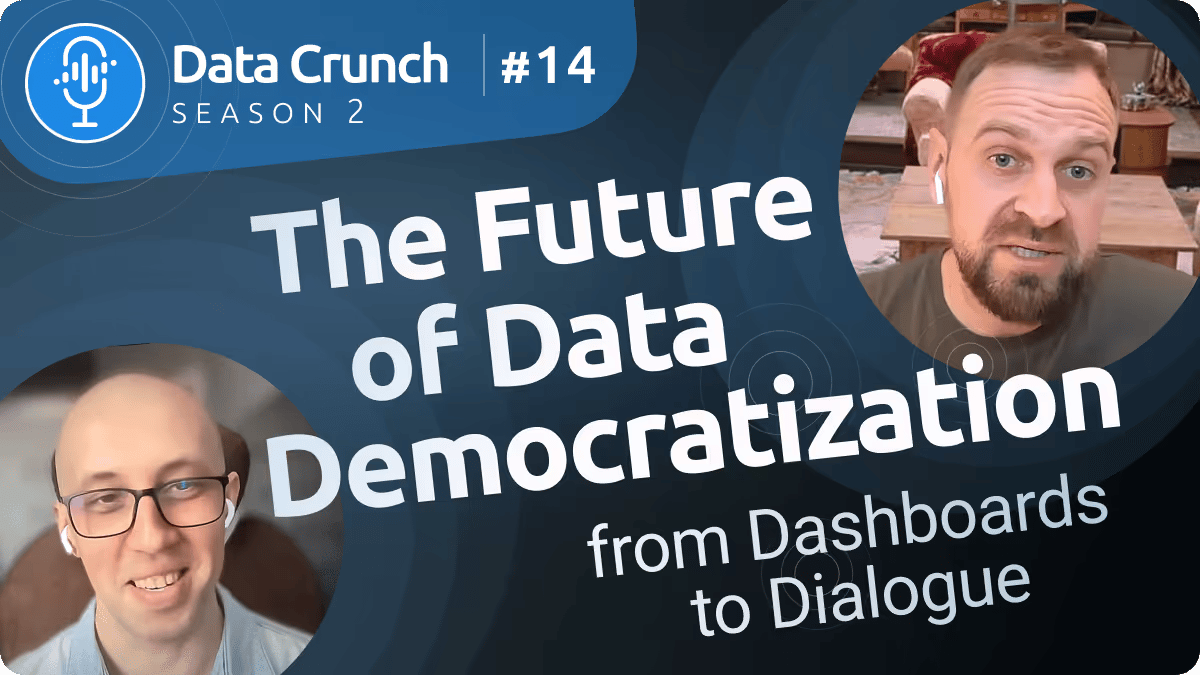 Podcast · Data AnalyticsFrom Dashboards to Dialogue
 GlossaryAttribute in Data Modeling
 GlossaryWhat is the ELT Process? Definition & Guide
 GlossaryWhat is an Object in Data Modeling? Definition
 GlossaryData Mesh
 GlossaryWhat is a Metadata Extractor? Tools & Use Cases
 GlossaryCost Analysis
 GlossaryData Architecture Design
 GlossaryData Backup
 GlossaryData Batch Processing
 GlossaryData Center
 GlossaryData Encryption
 GlossaryWhat is DevSecOps? Definition & Best Practices
 Podcast · Data ModelingData Modeling for Better Analytics
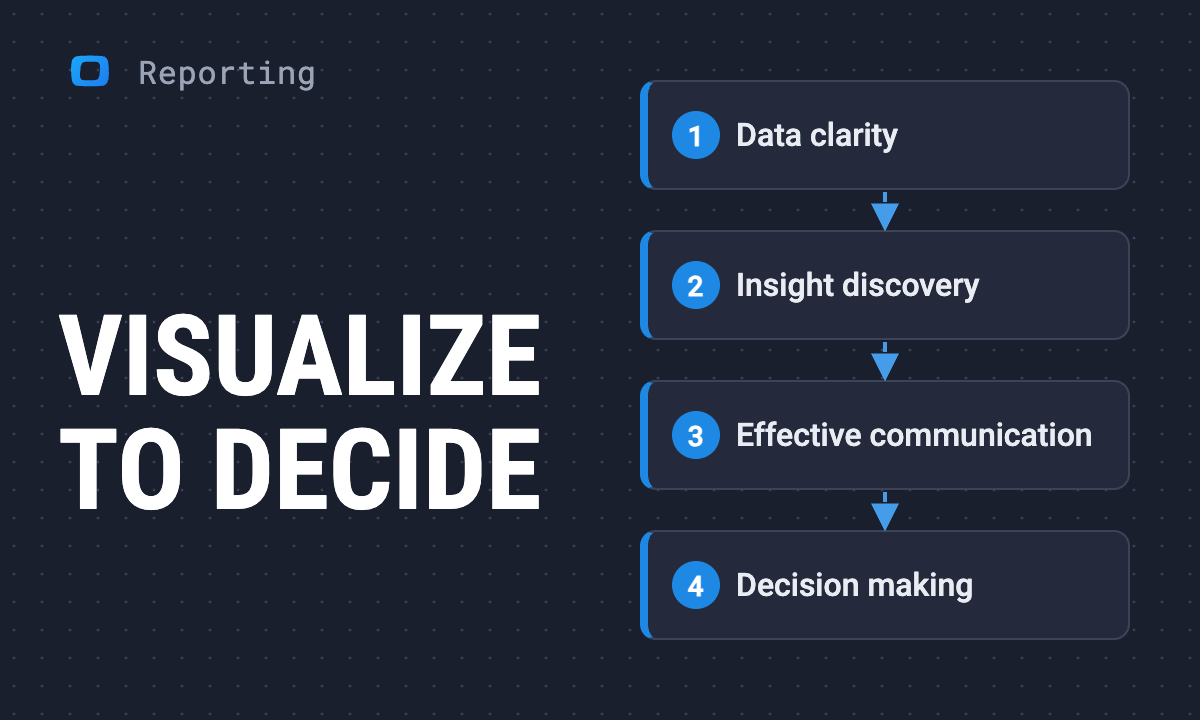 Article · ReportingData visualization: Your gateway to enhanced decision-making strategy
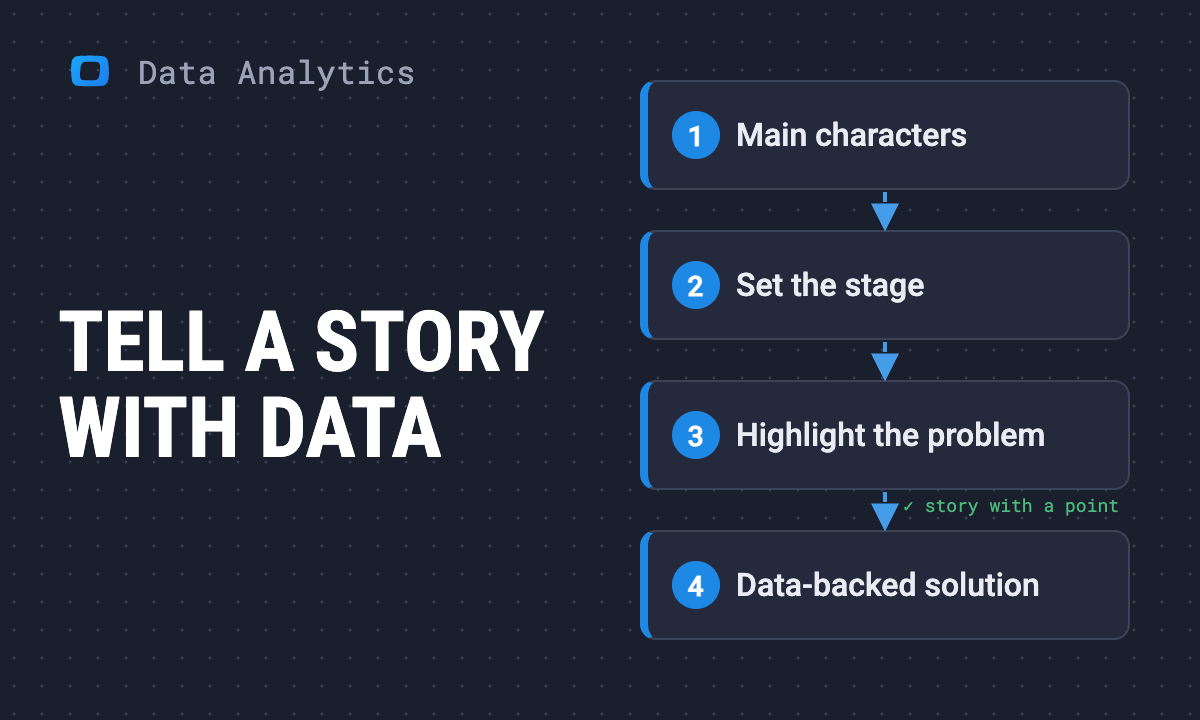 Article · Data AnalyticsHow to tell a great story with data: A complete data storytelling guide
 GlossaryData Consumption
 GlossaryData Discovery
 GlossaryWhat is Data Validation? Methods & Best Practices
 Podcast · Data AnalyticsData-Driven Decision-Making
 GlossaryCloud Migration
 GlossaryWhat is Data Visualization? Types & Best Practices
 GlossaryMachine Learning Models
 Podcast · Data AnalyticsAsk Better Data Questions
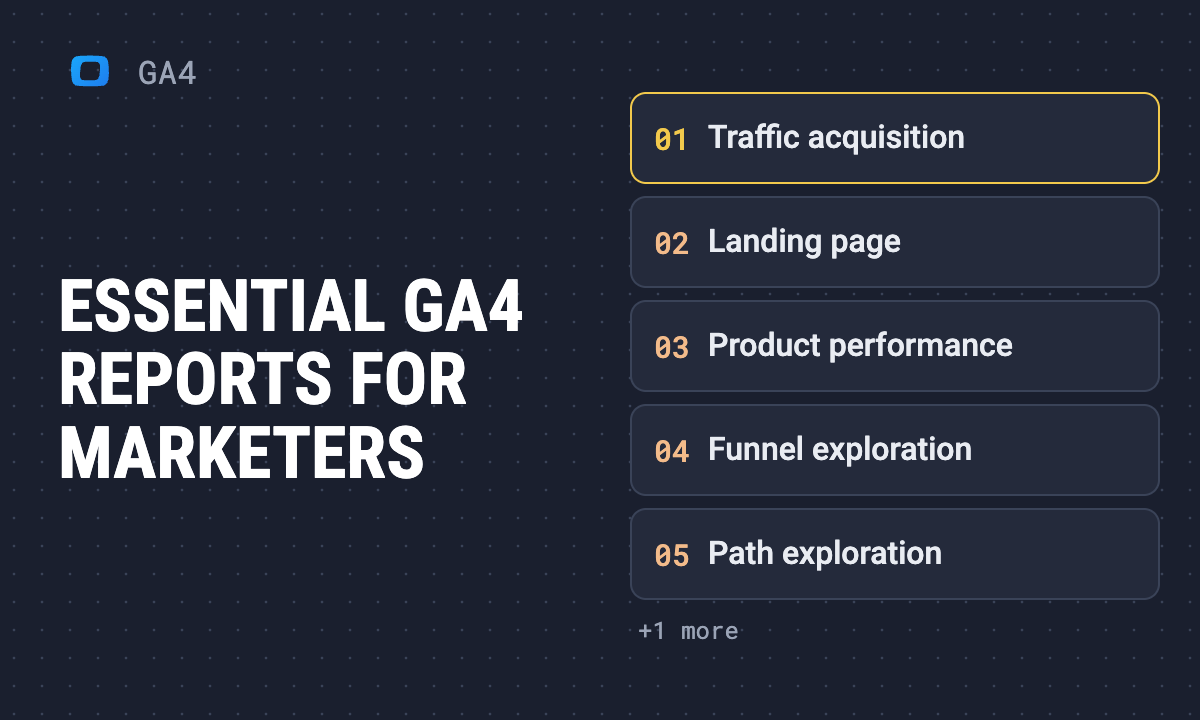 Article · GA4Essential Google Analytics 4 reports every marketer should know
 Podcast · Data AnalyticsData Activation Strategies
 GlossaryWhat is Deep Learning? Definition & Use Cases
 GlossaryMachine Learning Algorithms
 GlossaryMachine Learning and AI
 GlossaryML Classification
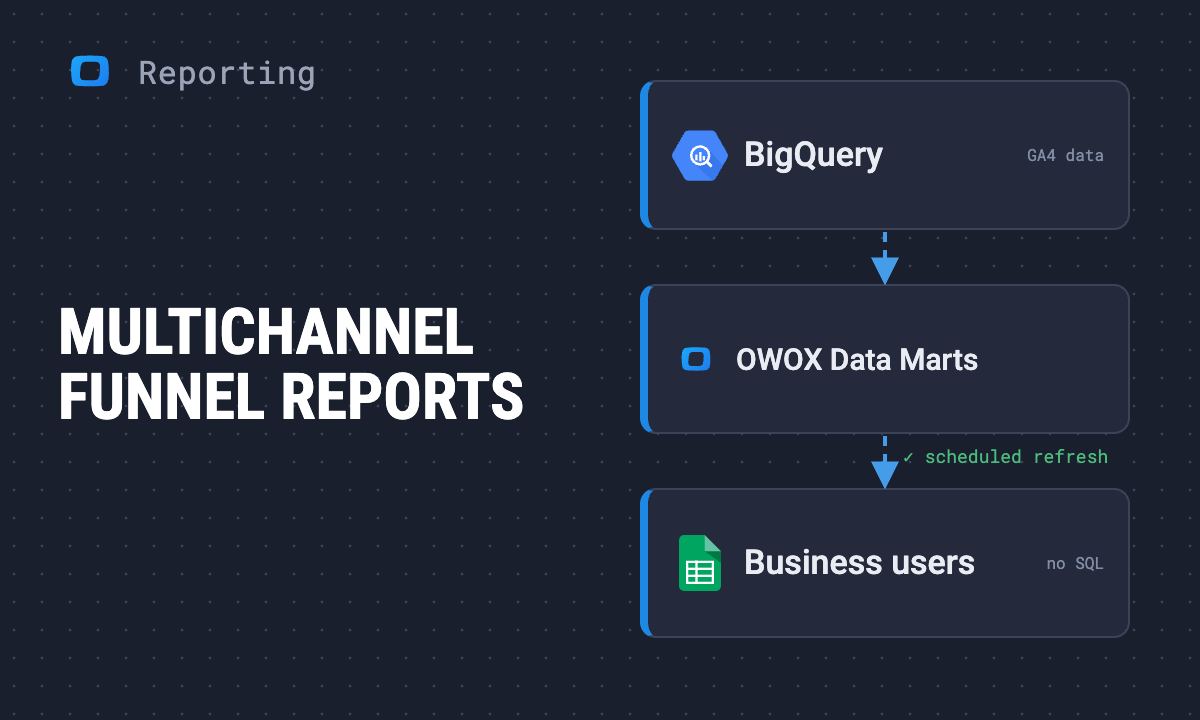 Article · ReportingHow to get the most from your multichannel funnel reports
 GlossaryData Analytics
 GlossaryData Migration
 GlossaryData Mining
 GlossaryWhat is Sentiment Analysis? Methods & Tools
 GlossarySnowflake Data Warehouse: Overview & Guide
 GlossaryWhat is Unstructured Data? Guide & Examples
 Podcast · Data AnalyticsData Analytics Implementation Guide
 GlossaryArtificial Intelligence
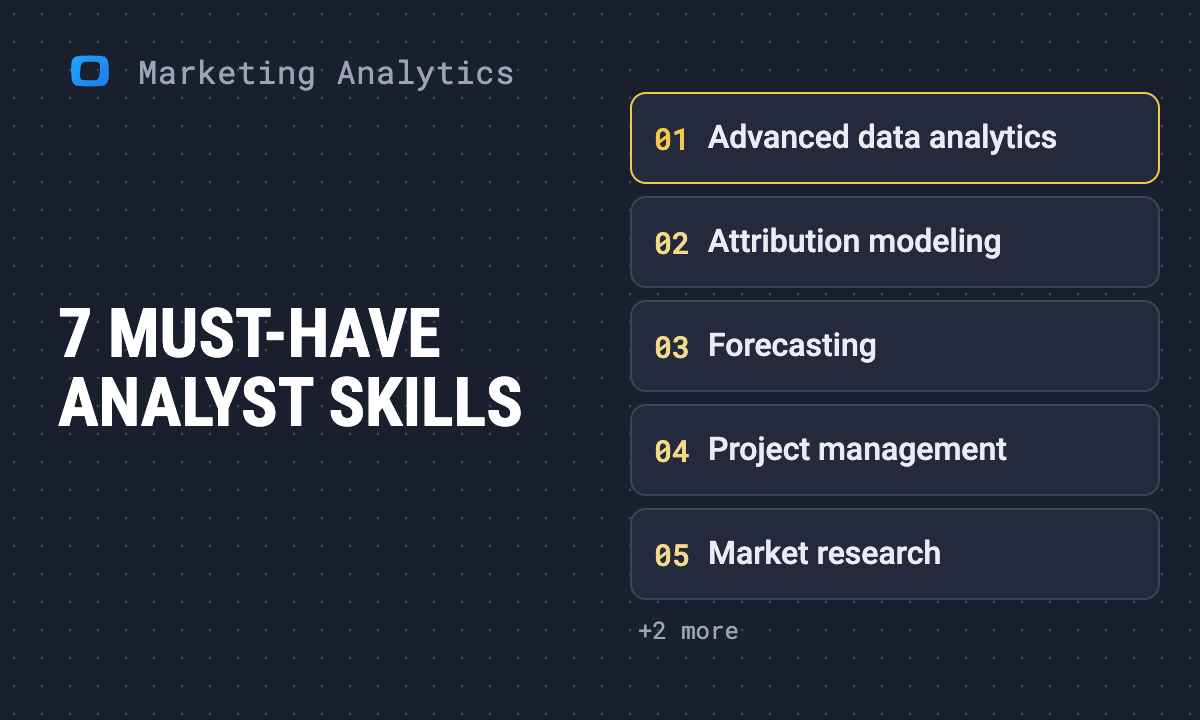 Article · Marketing AnalyticsThe modern marketing analyst: 7 must-have skills for success
 GlossaryWhat is Metadata? Definition, Types & Examples
 GlossaryWhat is Metadata Management? Guide & Tools
 GlossaryWhat is Modularity in Data? Definition & Benefits
 GlossaryPipeline Development
 GlossaryWhat is Predictive Analytics? Methods & Tools
 GlossaryWhat is Data Wrangling? Steps & Tools
 GlossaryWhat is an ETL Pipeline? Architecture & Guide
 Podcast · Data AnalyticsFirst, Second, Third & Zero-Party Data
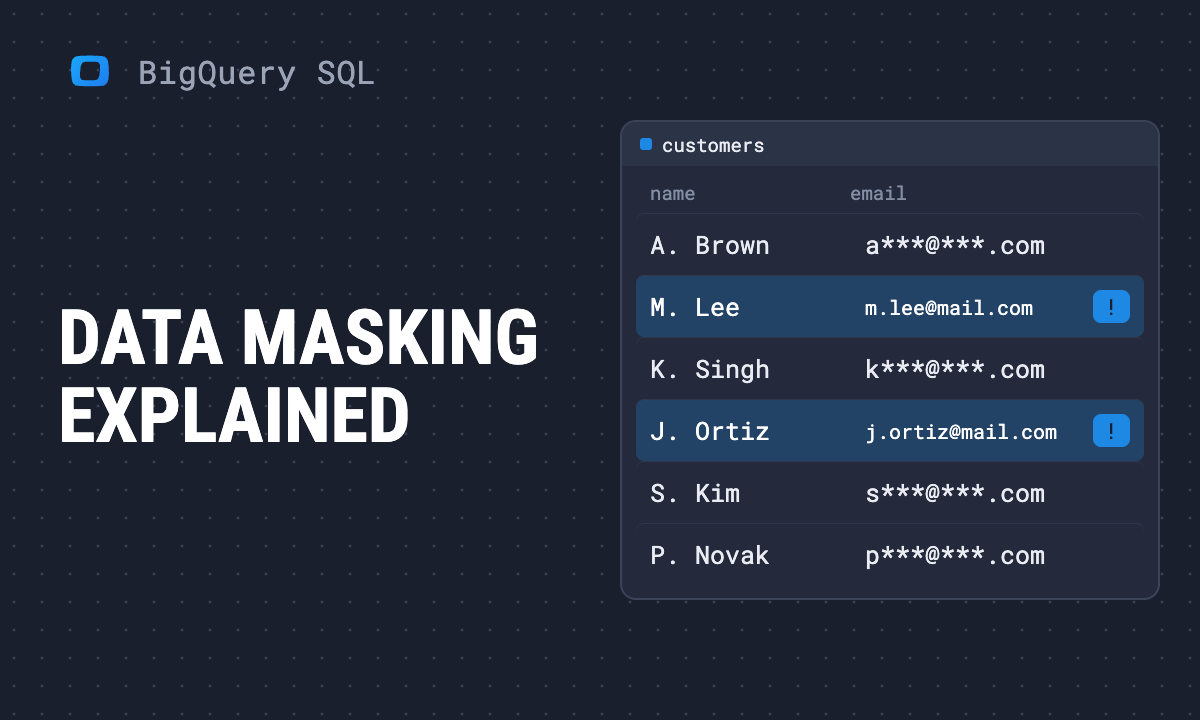 Article · SQL for AnalyticsData masking explained: Secure your sensitive data
 Podcast · Marketing AnalyticsTop Business KPIs Every Company Should Track
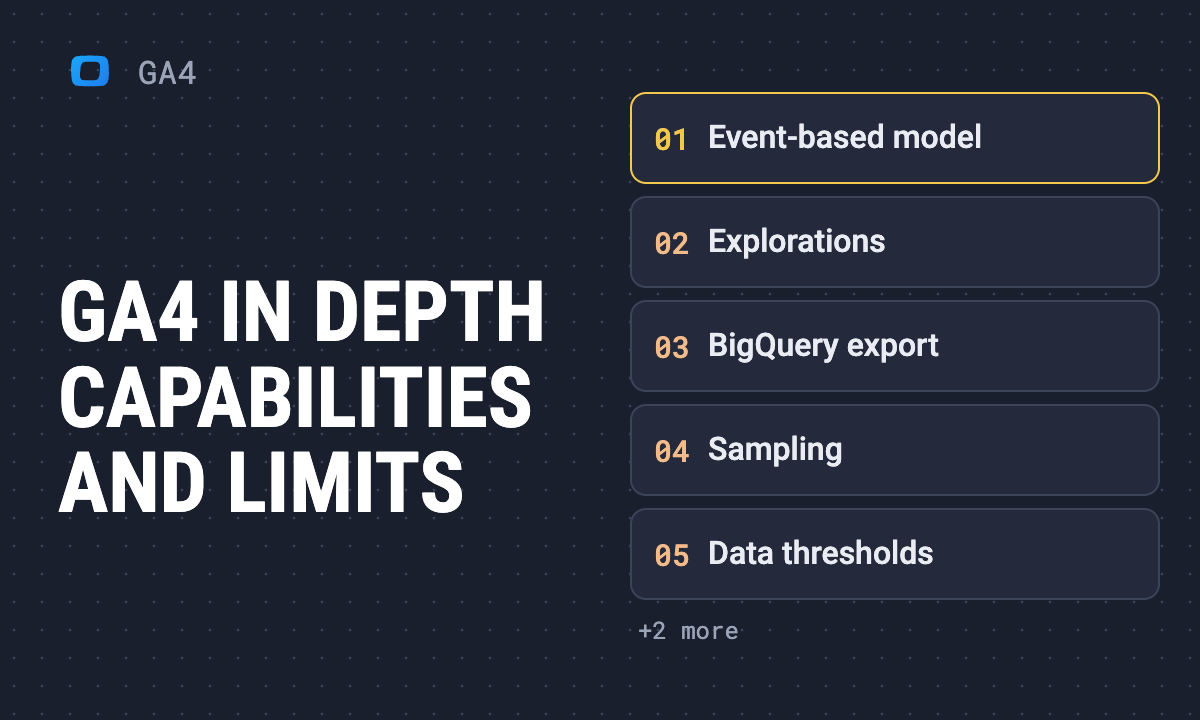 Article · GA4Google Analytics 4 in depth: capabilities, benefits and limits
 Podcast · Data TrackingFour Horsemen of Marketing Analytics
 GlossaryData Compliance
 GlossaryData Interoperability
 GlossaryData Lineage
 GlossaryWhat is a Data Pipeline? Types, Use Cases & Benefits
 GlossaryWhat is a Data Platform? Components & Benefits
 GlossaryWhat is Data Profiling? Definition & Techniques
 GlossaryWhat is Data Quality? Definition & Best Practices
 GlossaryBusiness Intelligence Applications
 GlossaryData Documentation for Looker
 GlossaryData Engineering
 GlossaryData Flow Diagram
 GlossaryWhat is Data Reporting? Tools & Best Practices
 Podcast · Data AnalyticsCommon Data Analysis Mistakes
 Podcast · Data AnalyticsTop Data Analyst Skills in 2025
 Podcast · Data AnalyticsData Culture's Impact on Growth
 Podcast · Marketing AnalyticsTop 3 Marketing Blind Spots in 2025
 Podcast · ReportingRedefine Reporting with Data Marts
 GlossaryData Auditing
 GlossaryData Collaboration
 GlossaryData Engineer
 Podcast · Data Analytics7 Gifts from OWOX in 2024
 Podcast · Marketing AnalyticsMarketing Mix Modeling for Better ROI
 Article · Data TrackingFirst-party, second-party and third-party data explained
 Podcast · Data AnalyticsAd Hoc Reporting Explained
 GlossaryWhat is Raw Data? Definition & How to Use It
 GlossaryWhat is Amazon Redshift? Features & Use Cases
 GlossaryBig Data
 GlossaryData Consumer
 GlossaryWhat is Data Transformation? Methods & Tools
 Podcast · Marketing AnalyticsThe Art of Marketing Analytics
 Podcast · Data AnalyticsData Democratization for Business
 GlossaryCloud Computing
 GlossaryData Architecture
 GlossaryData Breach Prevention
 GlossaryData Denormalization
 GlossaryData Integration
 GlossaryWhat is Data Security? Principles & Best Practices
 GlossaryData Security Governance Framework
 GlossaryData Storage Solutions
 Podcast · Data AnalyticsTop 5 Data Analytics Problems
 Podcast · GA4GA4 Tactics for More Traffic & Sales
 Podcast · Data AnalyticsData Freshness in Business Decisions
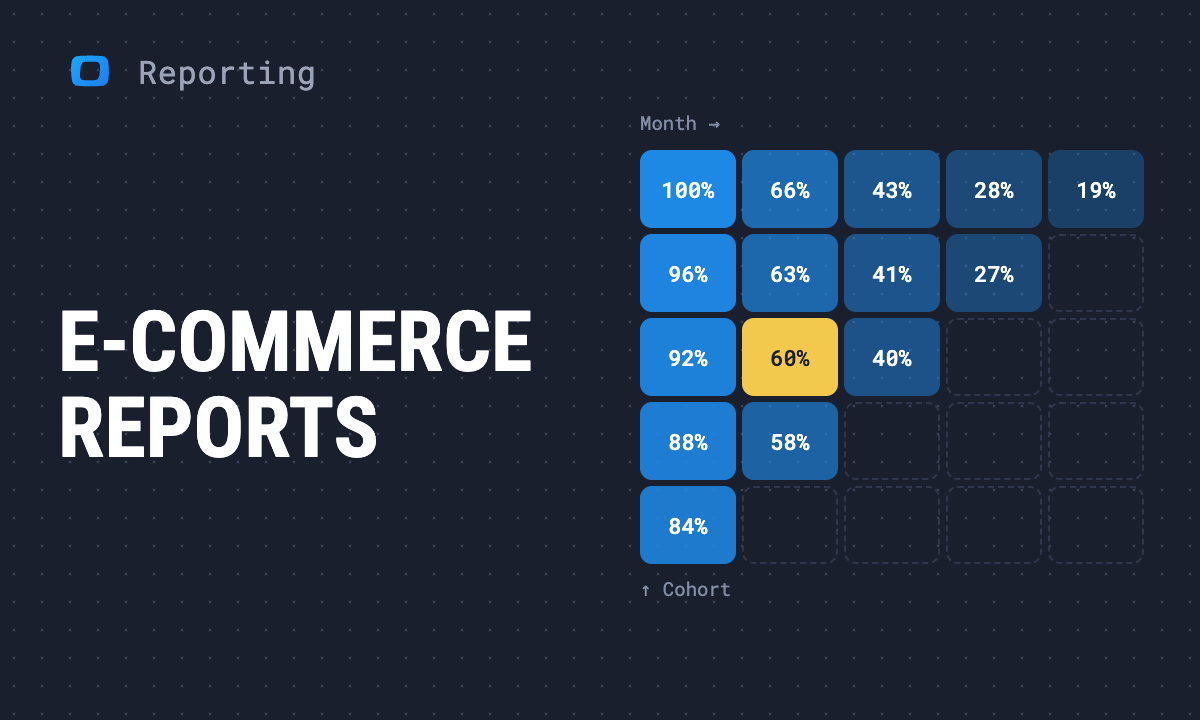 Article · ReportingComprehensive guide to ecommerce reports for enhanced business performance
 Podcast · Marketing AnalyticsMarketing Analytics Dos and Don'ts
 GlossaryWhat is Data Restoration? Methods & Practices
 GlossaryWhat are Data Silos? Causes & How to Break Them
 GlossaryWhat is the Modern Data Stack? Components & Guide
 Podcast · Marketing AnalyticsPost-Cookie Marketing Strategies
 GlossaryData Confidentiality
 GlossaryWhat is Data Privacy? Principles & Best Practices
 Success story · Case StudiesWorkSimpli: Streamlining SaaS Reporting at WorkSimpli with OWOX
 GlossaryAnonymized Data
 GlossaryData Curation
 GlossaryDDL in SQL
 GlossaryData Dictionary
 GlossaryWhat is Data Obfuscation? Techniques & Use Cases
 GlossaryWhat is Data Preparation? Steps, Tools & Best Practices
 GlossaryWhat is Data Provisioning? Architecture & Uses
 GlossaryWhat is Data Stewardship? Role & Best Practices
 GlossaryWhat is Deduplication? Methods & Best Practices
 Video · Data Analytics#2 Data Collection: Gathering the Right Data for Better Insights | 12-step data analytics roadmap
 Video · Data Analytics#3 Data Preparation: Turning Raw Data into Gold | 12-step data analytics roadmap
 Video · Data Analytics#4 Delivering Insights: From Data to Decisions – Step-by-Step | 12-step data analytics roadmap
 Video · Data Analytics#1: The Analytics Plan. Crafting a Winning Strategy from Scratch | 12-step data analytics roadmap
 Video · Data AnalyticsTop 5 Problems Every Business Face in Data Analytics (And How to Fix Them)
 GlossaryCloud Native
 GlossaryCommand Line Interface (CLI)
 GlossaryData Normalization
 GlossaryWhat is Data Sharing? Methods & Best Practices
 GlossaryDatabase
 GlossaryWhat is a Dataset? Definition & Examples
 GlossaryWhat is a NoSQL Database? Types & Use Cases
 GlossaryWhat is an RDBMS? Definition & Examples
 Article · Marketing AnalyticsWhat is a website conversion?
 GlossaryWhat is Data Value? How to Measure & Maximize It
 GlossaryData Analytics Tools
 GlossaryData Documentation for Snowflake
 GlossaryEntity Relationship Diagram
 GlossaryOpen-Source Datasets
 Video · Google Sheets TipsMastering the UNIQUE Function in Google Sheets
 Video · Google Sheets TipsExploring QUERY Function in Google Sheets: The Full Guide
 GlossaryAPI
 GlossaryData Governance
 GlossaryData Modeling
 GlossaryWhat is Data Science? Definition & Use Cases
 GlossaryWhat is a Primary Key? Definition & Examples
 Article · Data AnalyticsMastering website statistics analysis: Path to becoming a data science expert
 Video · Google Sheets TipsMastering ARRAYFORMULA in Google Sheets: A Complete Guide
 GlossaryCloud Storage
 GlossaryData Lake
 GlossaryWhat is a Data Warehouse? Definition & Guide
 GlossaryWhat is dbt? Definition, Features & Use Cases
 GlossaryWhat is ETL? Extract, Transform, Load Explained
 GlossaryWhat is a Query? SQL Definition & Examples
 GlossaryWhat is SQL? Definition & Key Concepts
 Video · Google Sheets TipsHow to Split Cells in Google Sheets
 Video · Google Sheets TipsEverything About VLOOKUP in Google Sheets
 GlossaryBigQuery
 Video · SQL for AnalyticsHow to Use SUBQUERIES in SQL with Examples
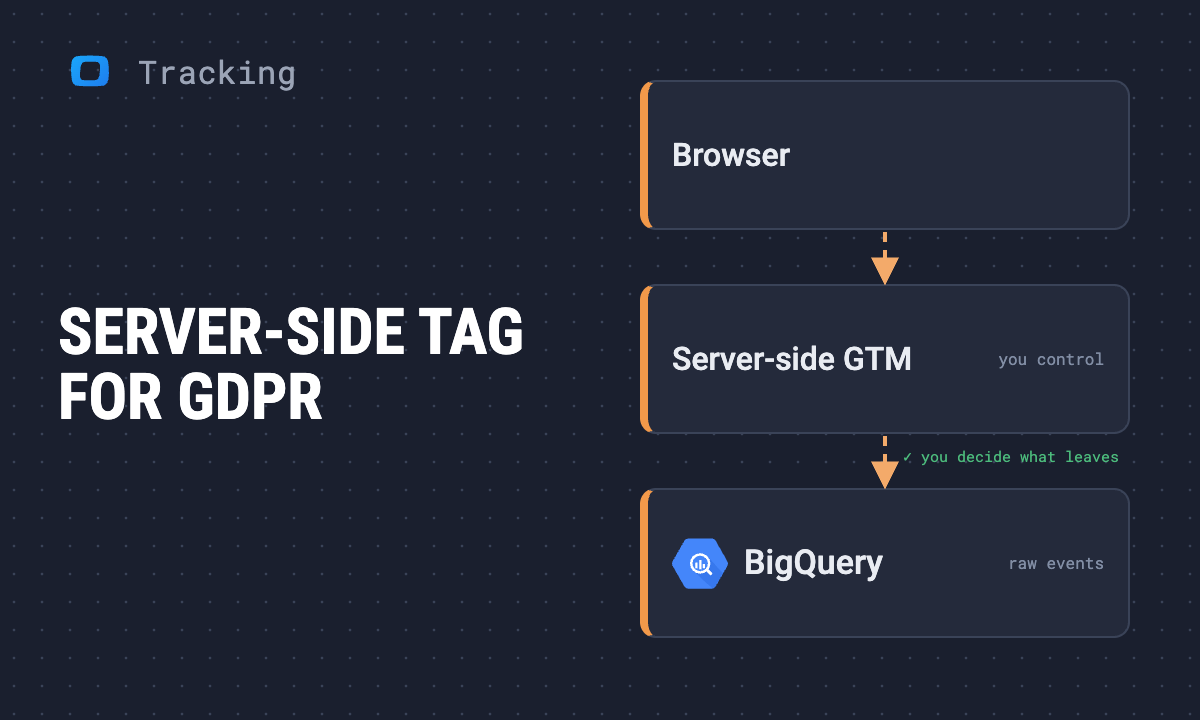 Use case · Data TrackingSolving the GDPR problem with GTM server-side tagging
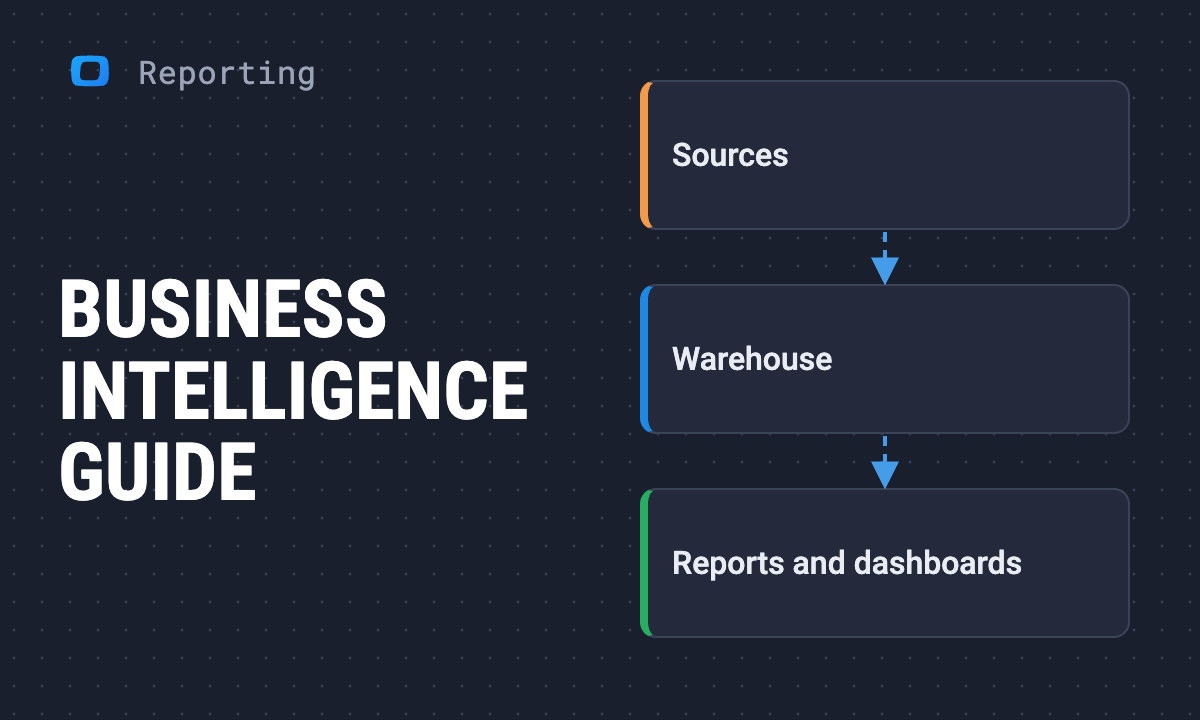 Use case · ReportingA complete guide to business intelligence
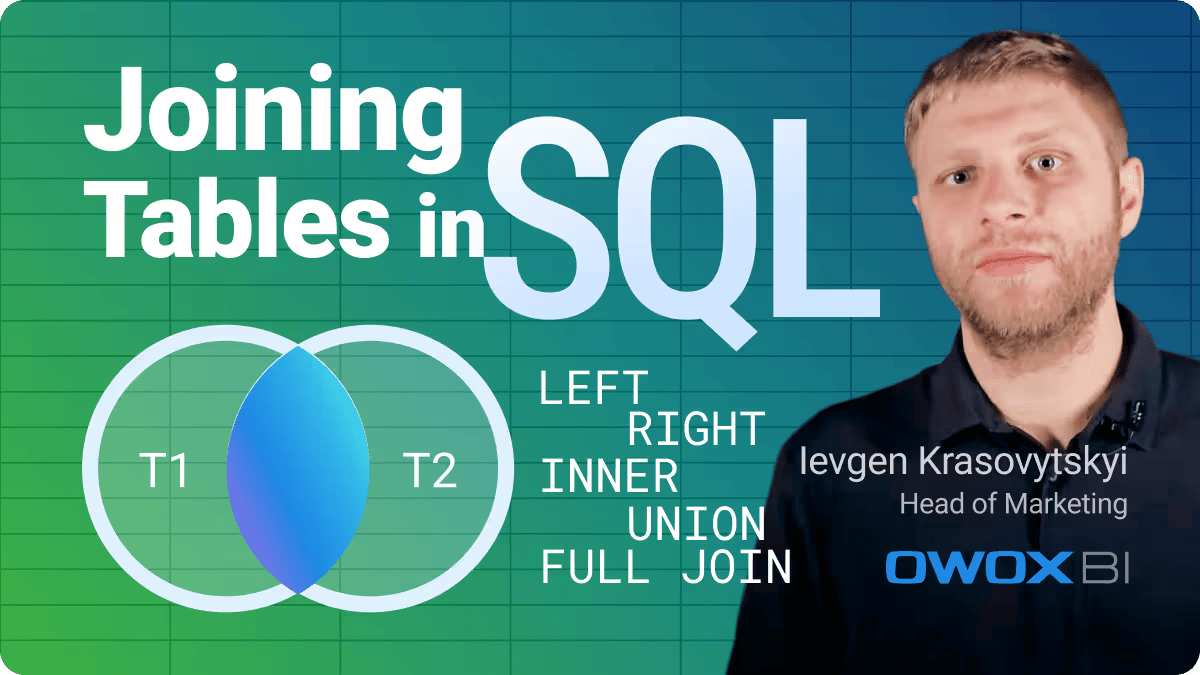 Video · SQL for AnalyticsJoining tables in SQL | INNER JOIN, LEFT JOIN, RIGHT JOIN, FULL JOIN, UNION
 Video · ReportingHow to Make Complex Data Accessible | Corporate Reporting in Spreadsheets
 Video · Google BigQueryOWOX: Reports, Charts & Pivots
 Video · Google BigQueryHow to Connect BigQuery to Google Sheets: Top 3 Ways to Import Data
 Video · SQL for AnalyticsLinking Database Tables | Primary & Foreign Keys | Data Analytics for Beginners
 Success story · Case StudiesAvrora: Avrora: Analytics Transformation with OWOX
 Video · SQL for AnalyticsWhat is a Query? Data Analytics for Beginners
 Video · Data AnalyticsWhy, When & Which Data Warehouse Is Perfect for Your Business Needs | BigQuery, Snowflake, Redshift
 Video · SQL for AnalyticsLearn Basic SQL Queries in 20 minutes (Lesson 2) | Data Analytics for Beginners
 Video · Google BigQueryHow to Build a GA4 User Acquisition Standard Report in BigQuery
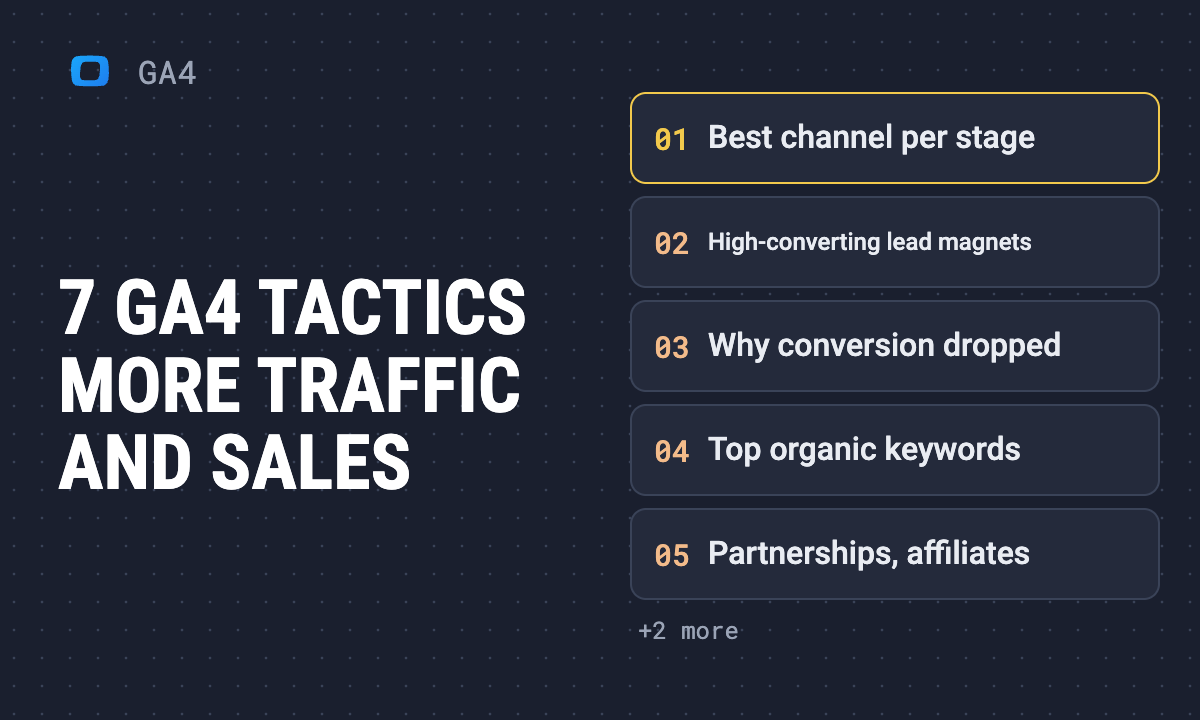 Article · GA47 analytics tactics to get more traffic and sales using Google Analytics 4
 Video · Google BigQueryGA4 Events Data Schema in BigQuery | Marketing Analytics for Beginners
 Video · Google BigQueryHow to Query GA4 Event Data in BigQuery | Marketing Analytics for Beginners
 Video · SQL for AnalyticsHow to Use ChatGPT to Write SQL Queries for BigQuery From Scratch
 Video · Google BigQuery8 Reasons to Export GA4 Data to BigQuery | Marketing Analytics for Beginners
 Video · SQL for AnalyticsLearn Basic SQL Queries in 20 minutes (Lesson 1) | Data Analytics for Beginners
 Video · Marketing StrategyWhat is the Customer Lifetime Value (LTV)? Marketing Analytics For Beginners
 Video · Marketing AnalyticsWhat is data-driven marketing in 2024? Marketing Analytics For Beginners
 Video · Data AnalyticsThe Critical Role of Data Freshness in 2024
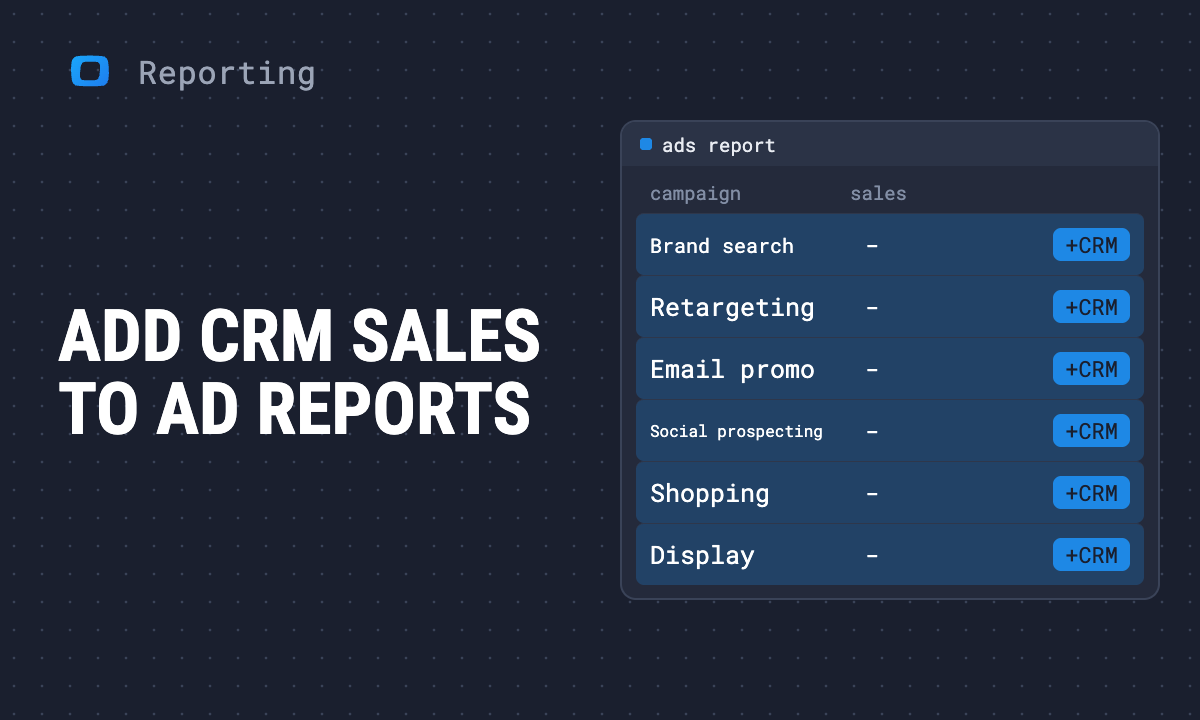 Article · ReportingEnhance digital marketing reports with CRM data integration
 Video · Data Analytics8 Data Analytics Terms Everyone Should Know | Marketing Analytics for Beginners
 Video · Marketing AnalyticsWhat Are Metrics & Dimensions? Marketing Analytics for Beginners
 Video · ReportingWhat is Business Intelligence in 2024? | Marketing Analytics for Beginners
 Video · Marketing AnalyticsWhat are Marketing KPIs? 7 TIPS To Define Yours
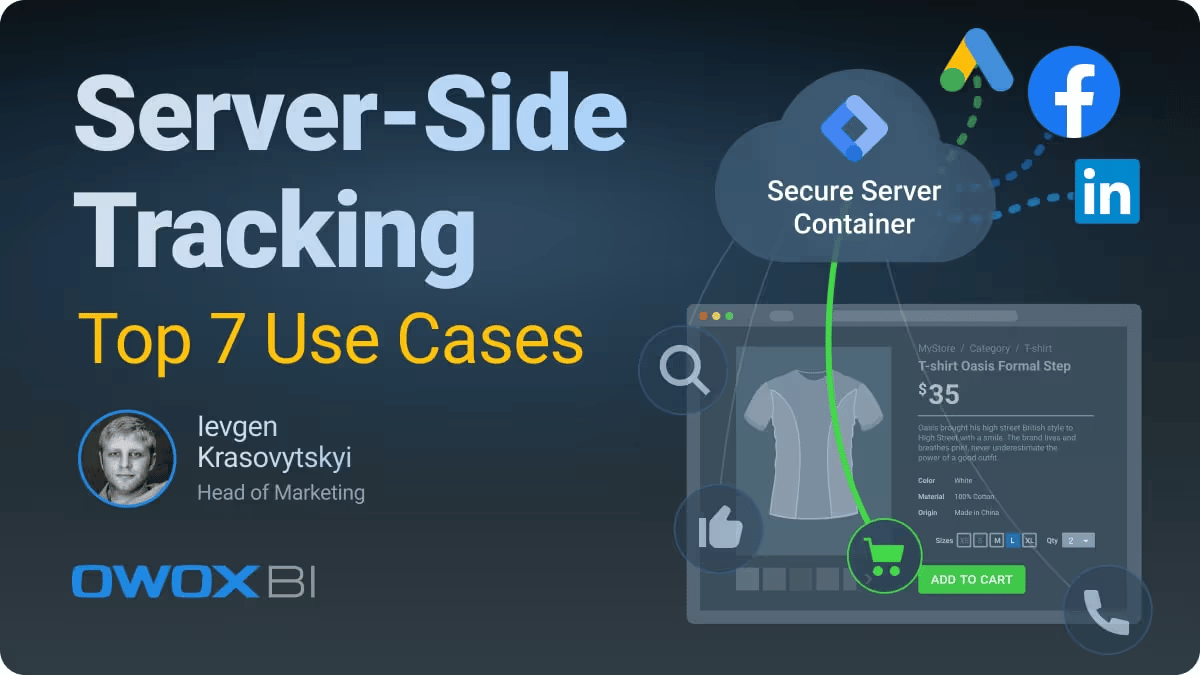 Video · Marketing AnalyticsTop 7 Use Cases of Server-Side Tracking
 Success story · Case StudiesZOOD: ZOOD: 6-Week Data Reporting Transformation with OWOX
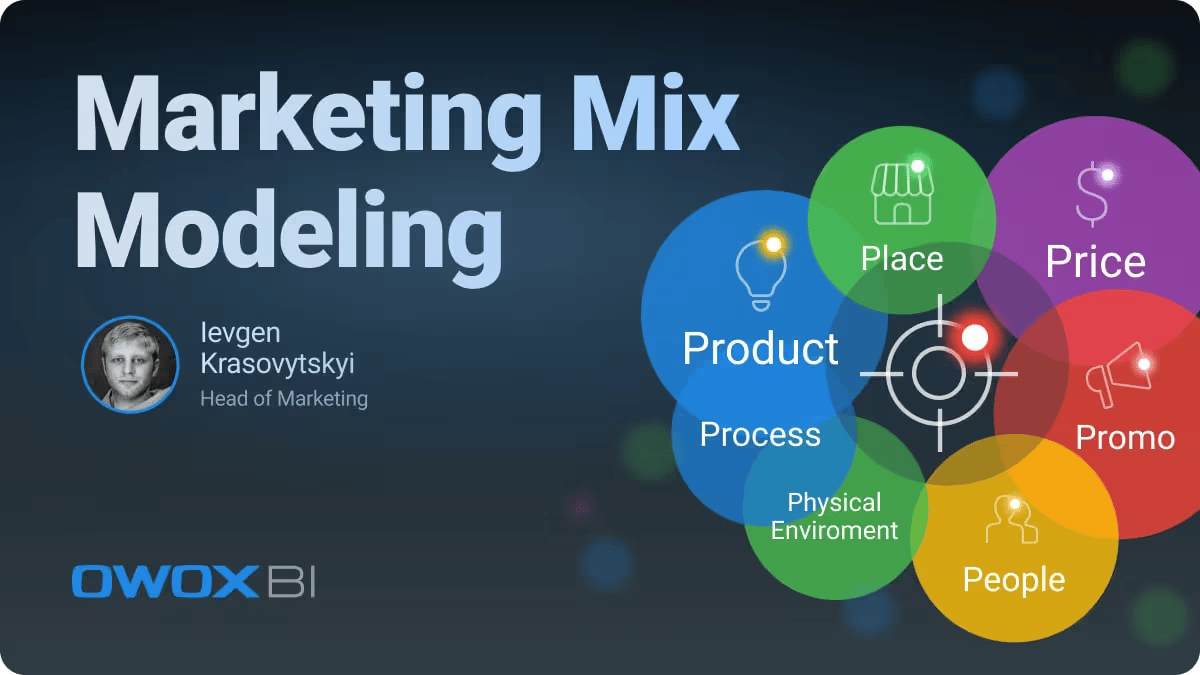 Video · Marketing AnalyticsMarketing Mix Modeling in 2024
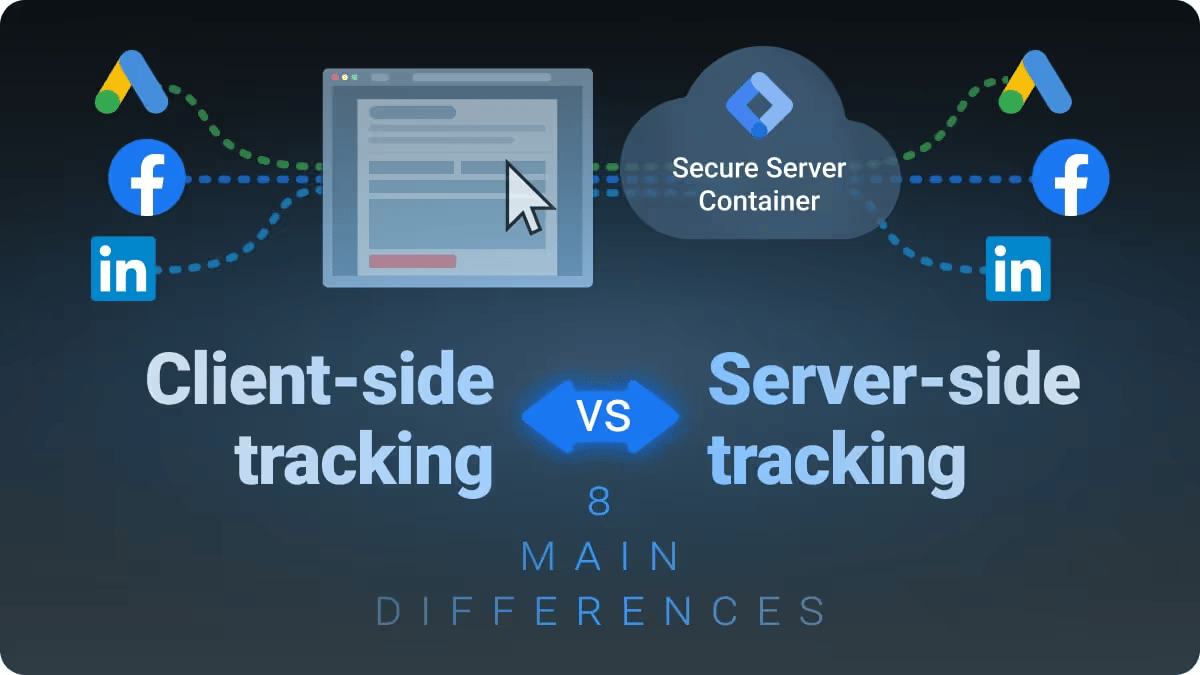 Video · Marketing AnalyticsClient side Tracking vs Server side Tracking. 8 main differences
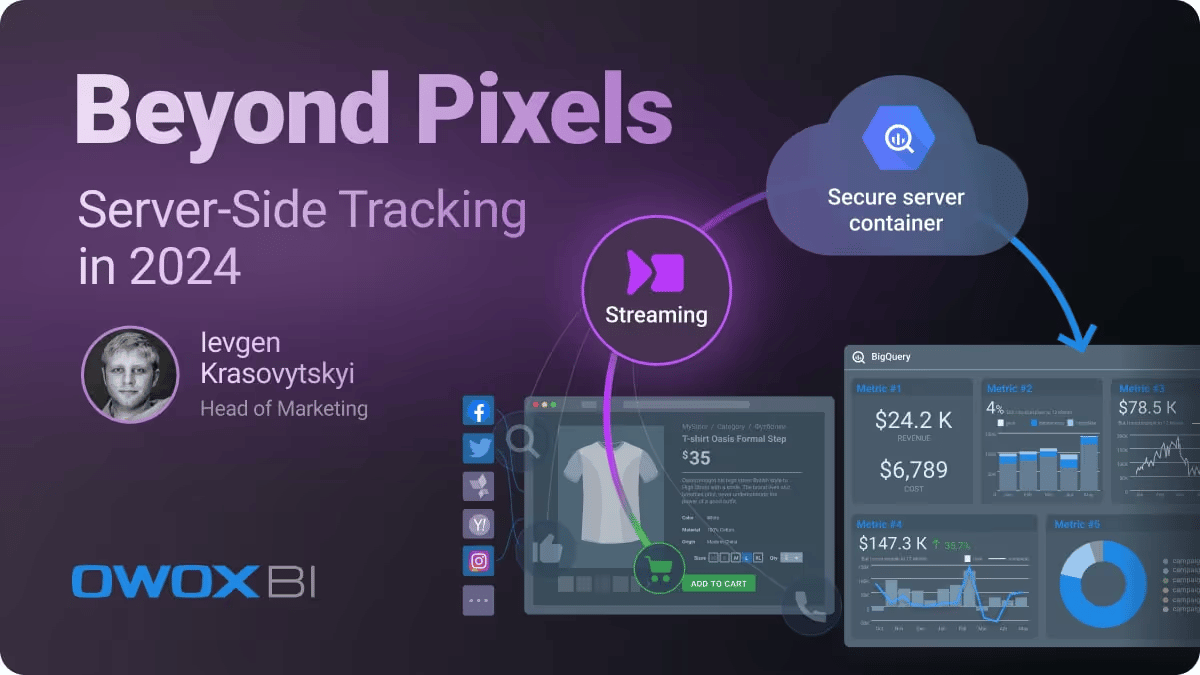 Video · Marketing AnalyticsBeyond Pixels: Server-Side Tracking in 2024
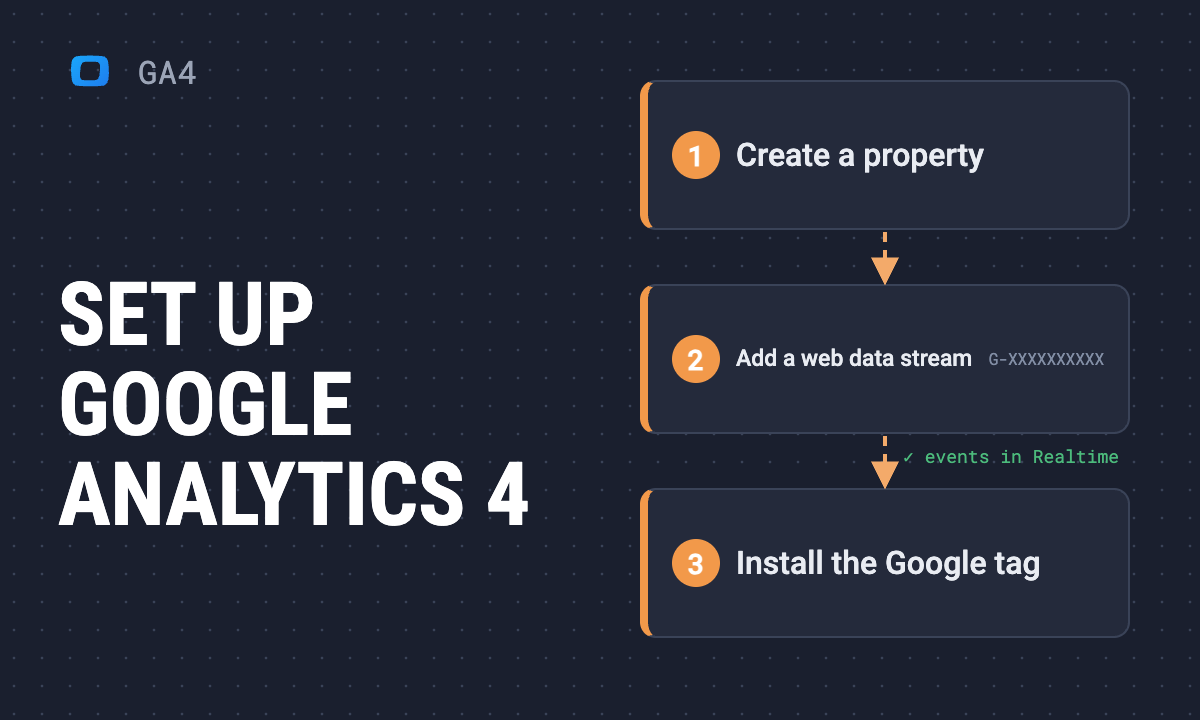 Article · GA4How to set up Google Analytics 4: setup, configuration and first reports
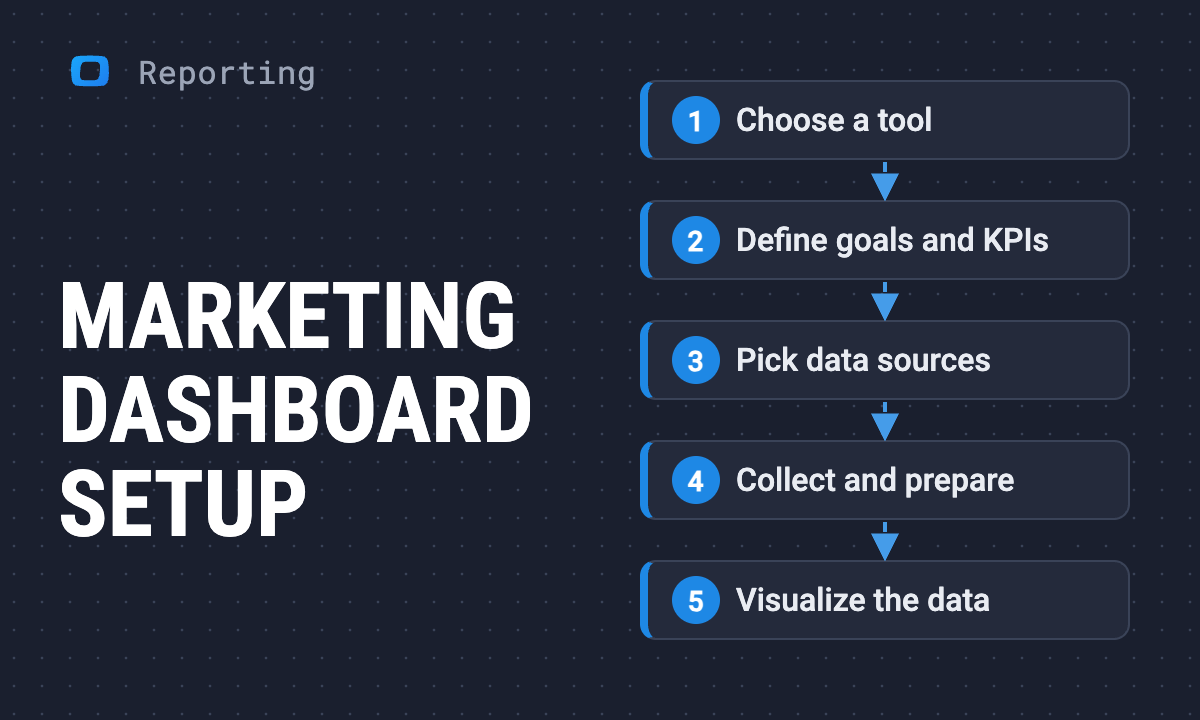 Article · ReportingThe ultimate marketing dashboard: Setup with examples
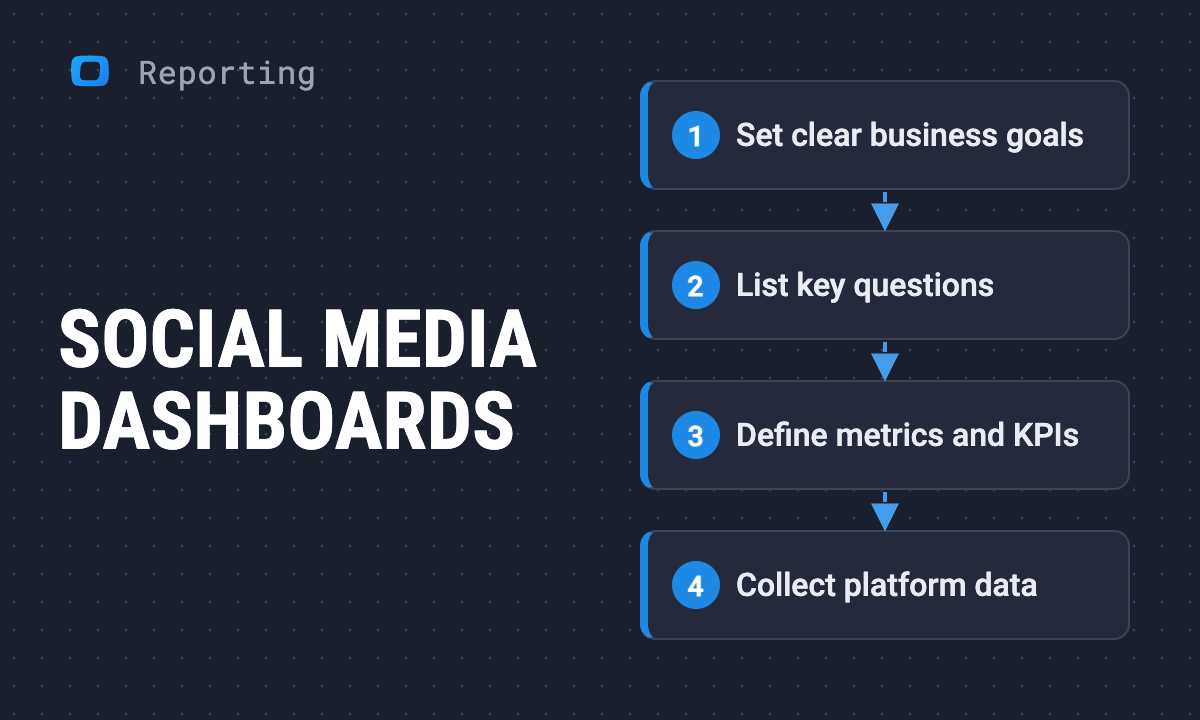 Article · ReportingThe best way to create social media dashboards for data-driven marketing
 Article · ReportingMastering LinkedIn Ads dashboards & reporting: A complete guide
 Article · GA4Google Analytics 4 checklist and best practices
 Webinar · Data Analytics12-Step Guide to Data Analytics
 Success story · Case StudiesMotionVFX: Accurate Marketing Analytics: MotionVFX Case Study
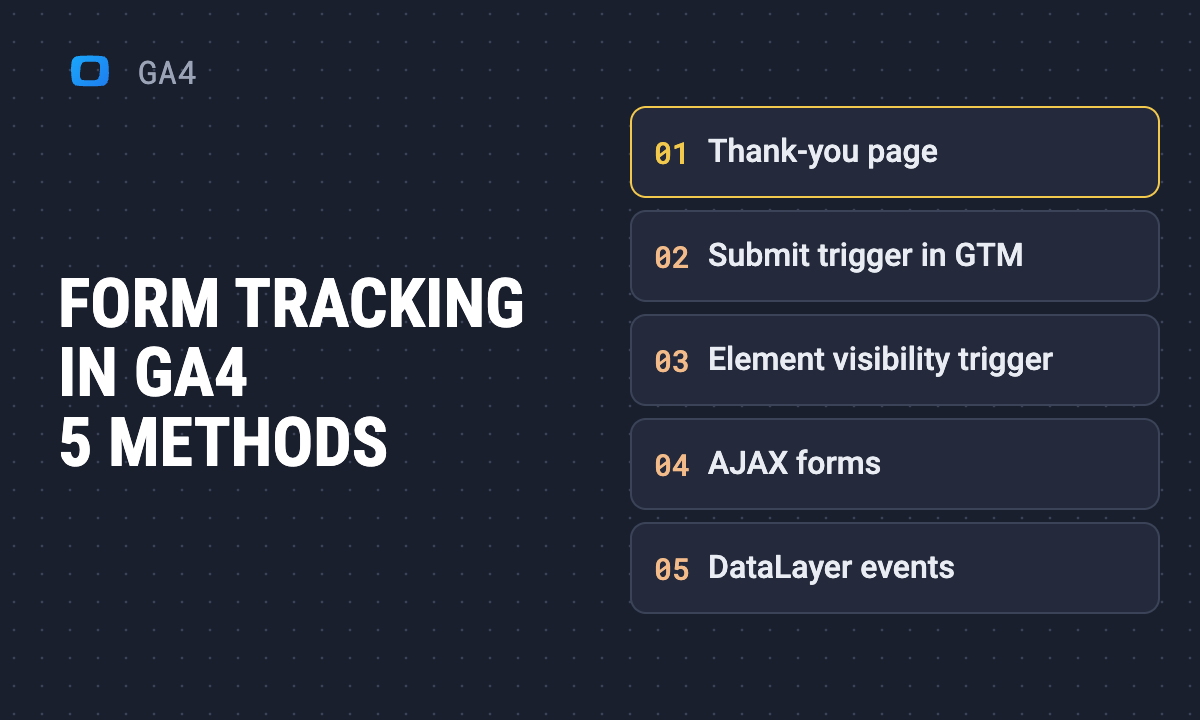 Article · GA4How to set up form tracking with Google Tag Manager and Google Analytics 4
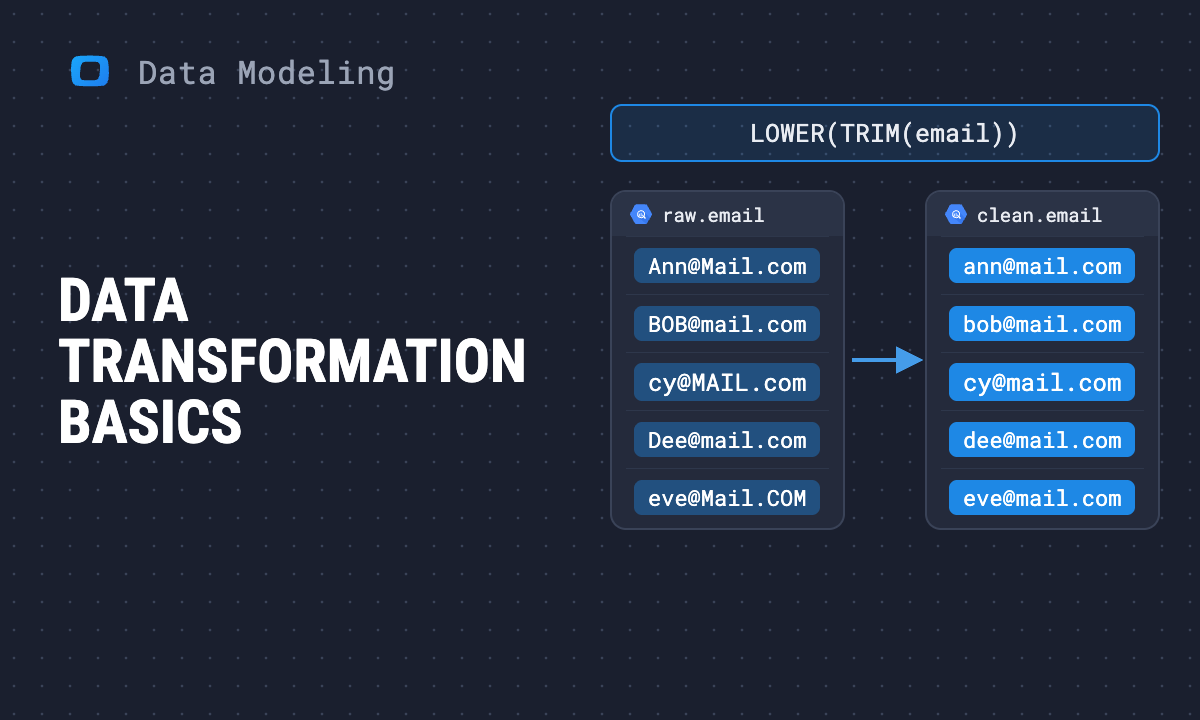 Use case · Data ModelingThe beginner's guide to data transformation
 Success story · Case StudiesArtPix 3D: Transforming Data Analytics for ArtPix 3D: Case Study
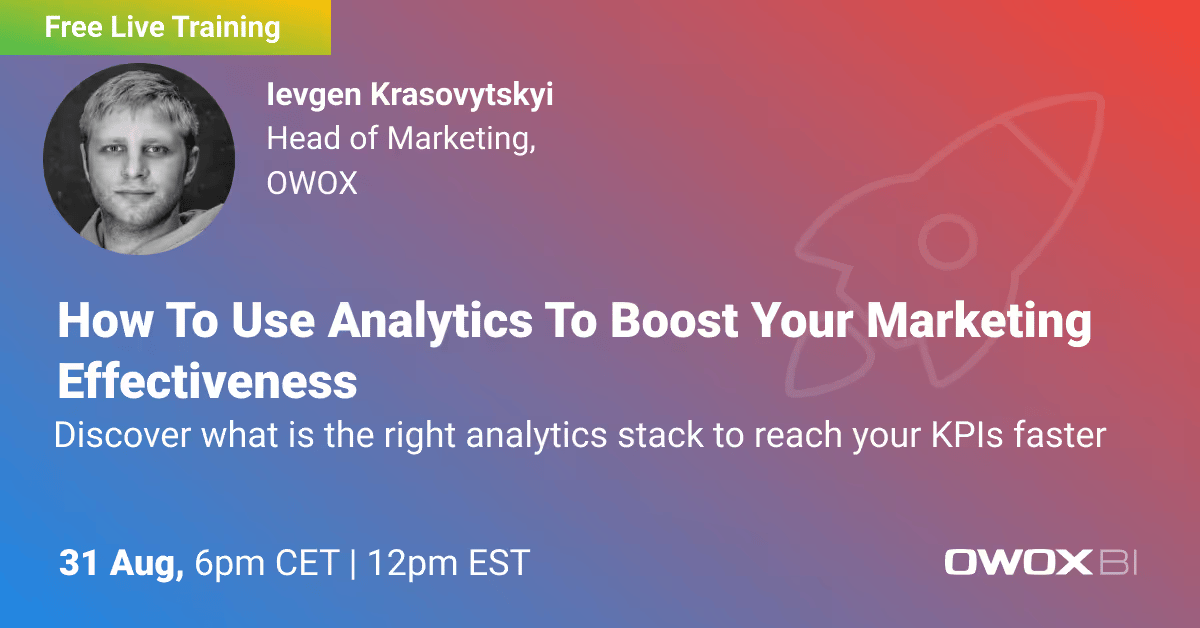 Webinar · Marketing AnalyticsFull-Funnel Analytics for Marketing ROI
 Success story · Case StudiesInfoTrust: Saving Historical GA Data for Y-o-Y Reporting with OWOX
 Webinar · ReportingCross-Channel Marketing Reports in Minutes
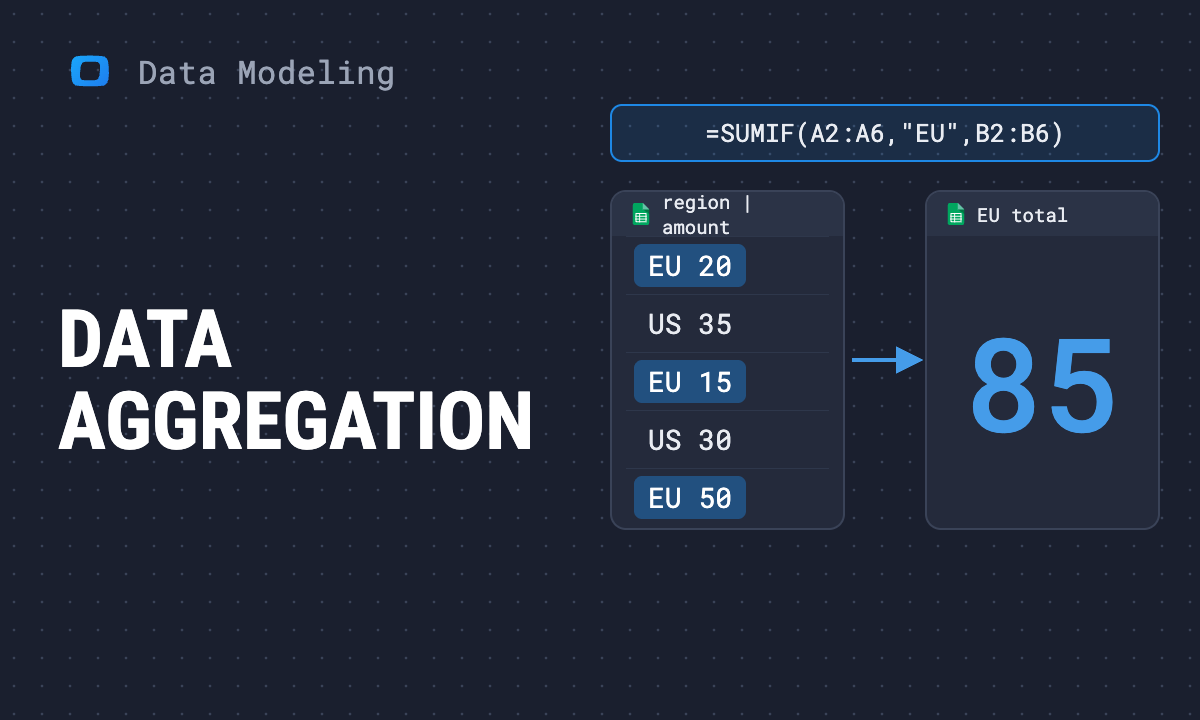 Article · Data ModelingData aggregation techniques for effective data analysis
 Success story · Case StudiesON Clinic: Proven Data-Driven Advertising Strategy for Healthcare
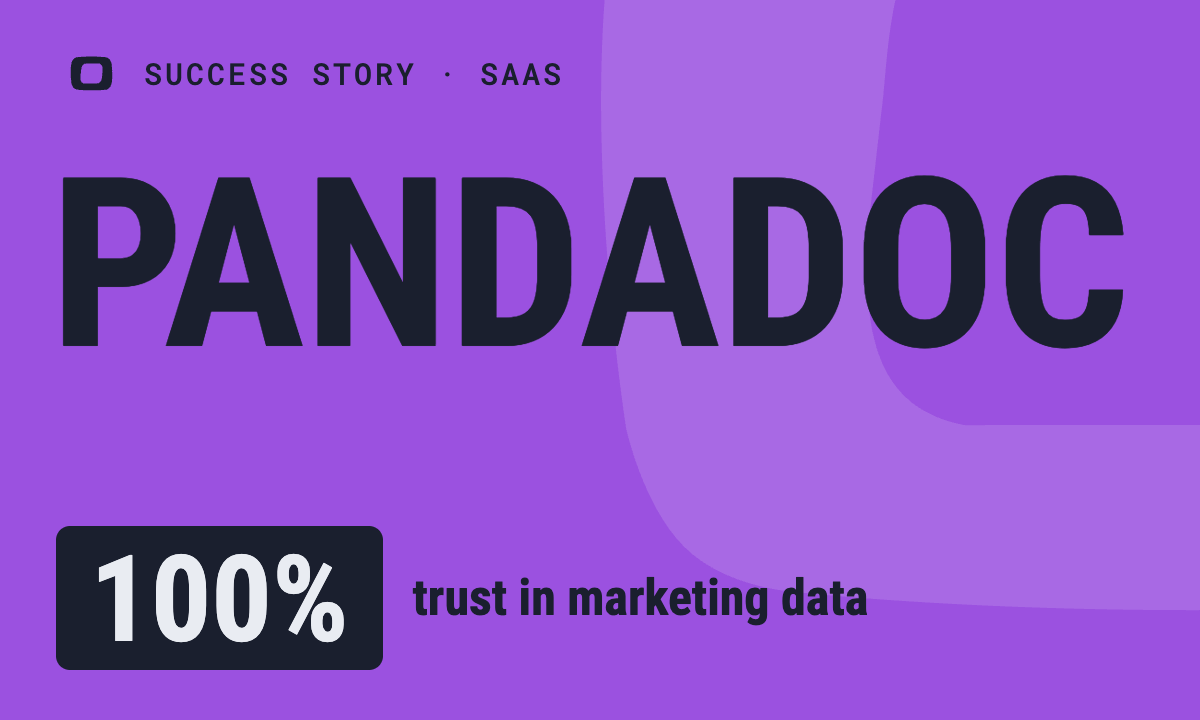 Success story · Case StudiesPandaDoc: PandaDoc Case Study: Privacy-First Marketing Analytics
 Webinar · Marketing AnalyticsMastering Marketing KPIs
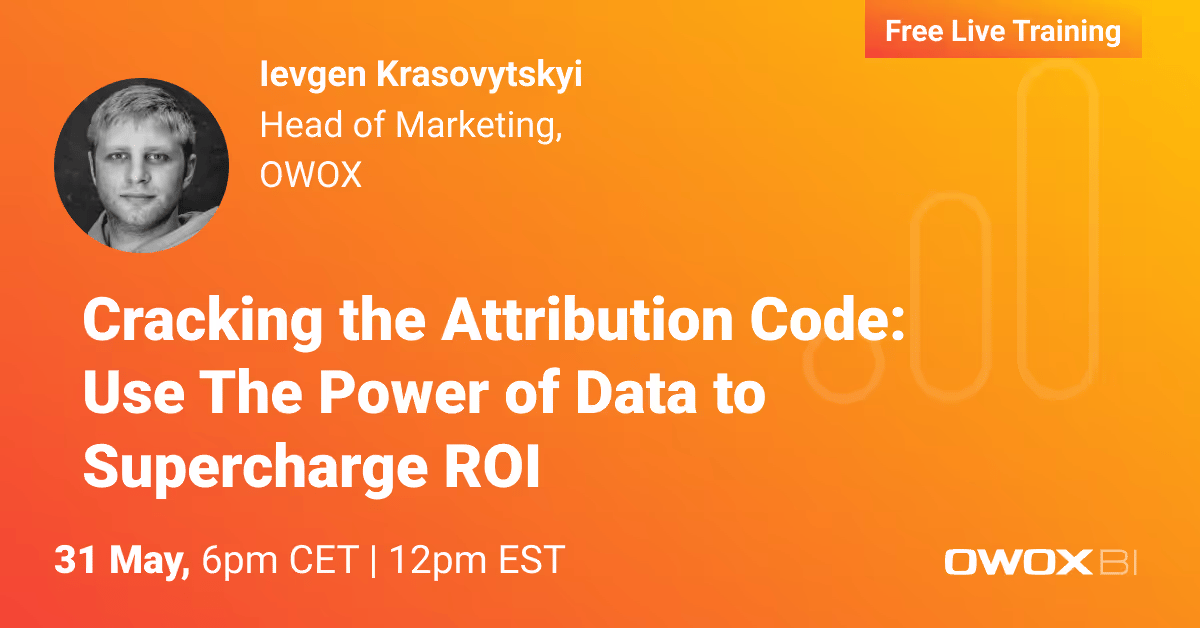 Webinar · Marketing AttributionCracking the Attribution Code
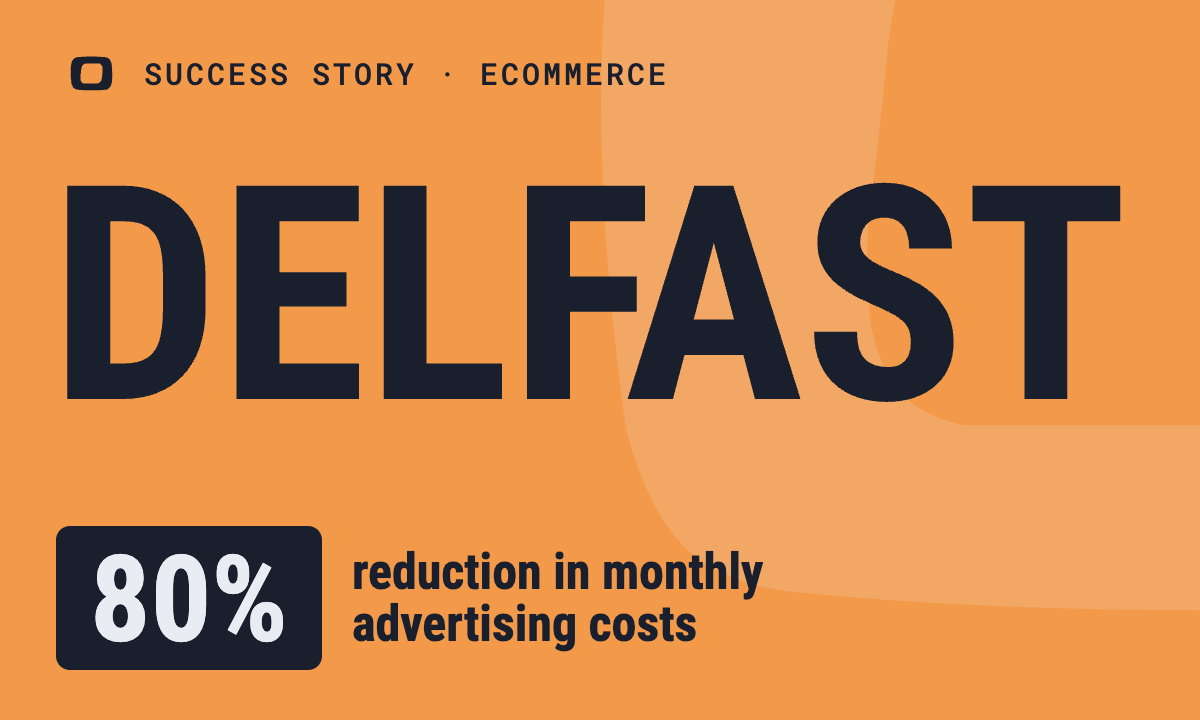 Success story · Case StudiesDelfast: Delfast Saves 80% on Ad Costs: Case Study by OWOX
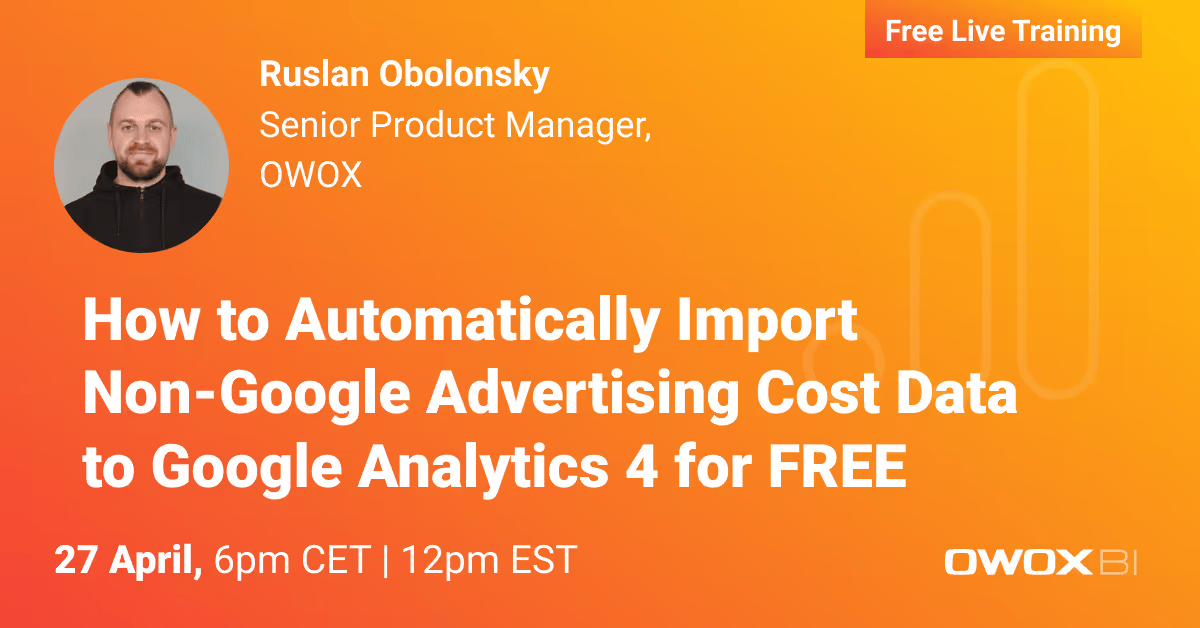 Webinar · GA4Free Non-Google Ad Cost Import to GA4
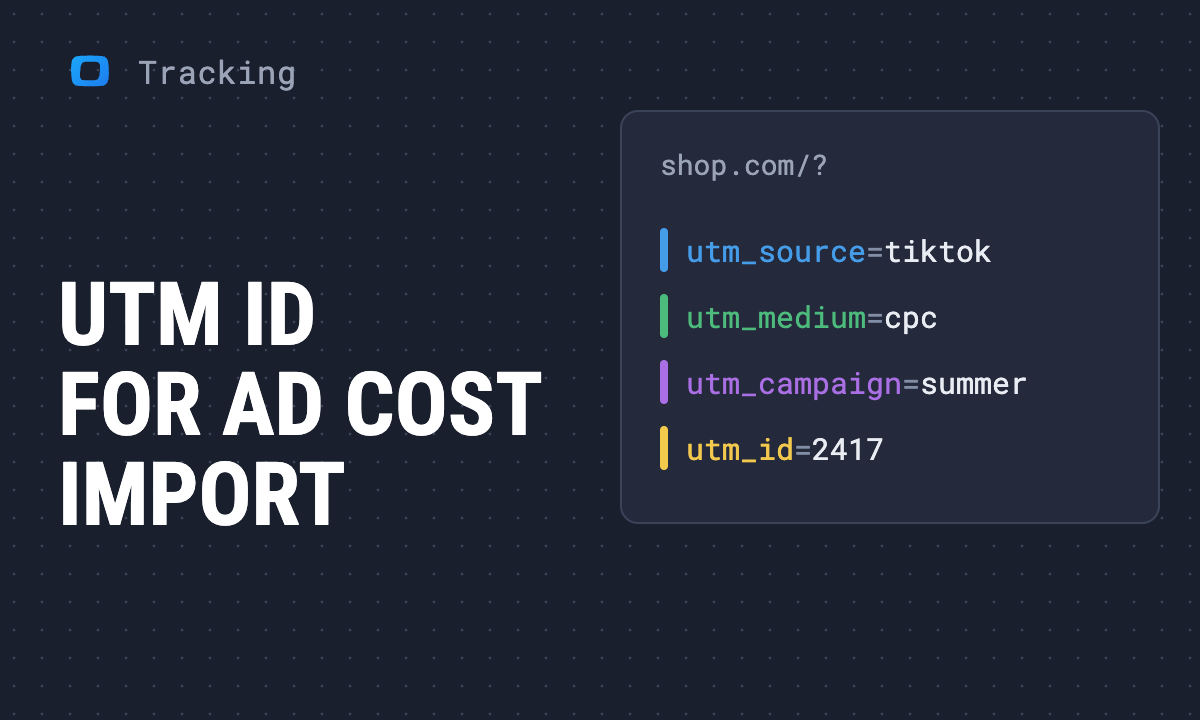 Use case · Data TrackingUTM ID: The parameter GA4 needs to import non-Google ad costs
 Webinar · Data ModelingData Blending for Marketing Analysis
 Success story · Case StudiesHiveon: Advanced Analytics: Hiveon Mining Success with OWOX
 Webinar · Marketing StrategyEliminating Marketing Blind Spots
 Webinar · GA4GA4 Sessionization in BigQuery
 Success story · Case StudiesCS:GO Trading Platform: Advanced Analytics Setup for CS:GO Trading by OWOX
 Webinar · Data ModelingConversion Modeling in a Cookieless World
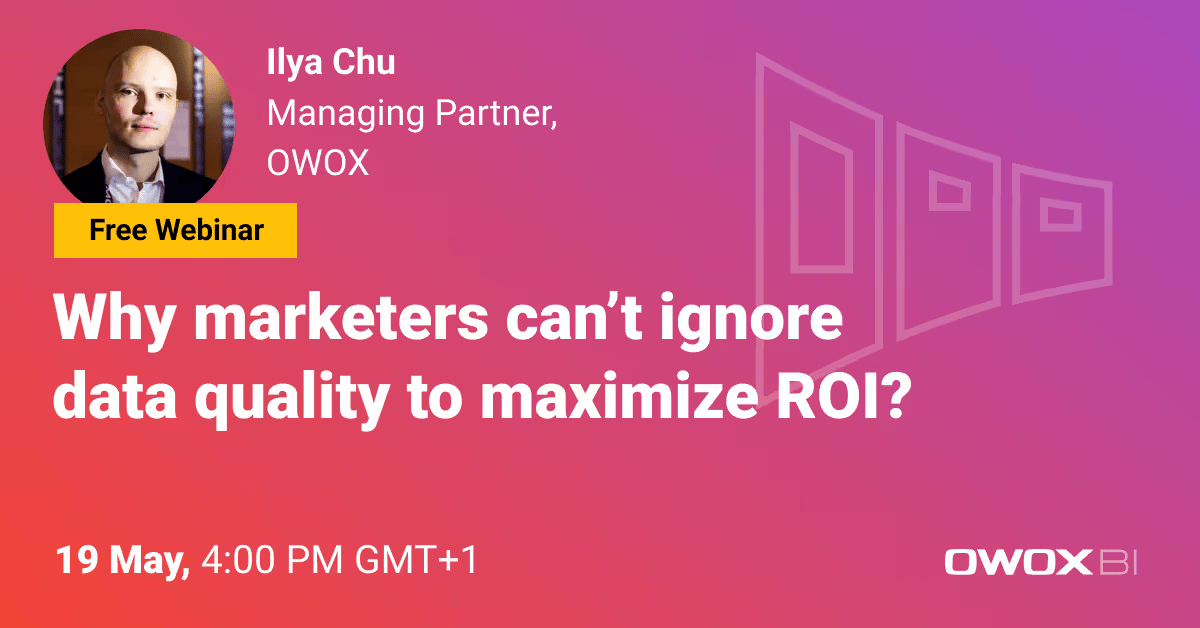 Webinar · Data AnalyticsData Quality and Marketing ROI
 Success story · Case StudiesEcommerce Brand: How to Use Available Customer Data for LTV Prediction
 Success story · Case StudiesMovie Streaming Service: Setting up Advanced Analytics for Online Streaming Services
 Success story · Case StudiesFashion Retailer: Calculating Delivery Cost and ROMI for Purchase Orders
 Success story · Case StudiesFashion Retailer: Quick Access to All Essential E-Commerce Product KPIs
 Success story · Case StudiesRestaurant Chain: Automate Marketing Reporting for Restaurants
 Success story · Case StudiesEVA.UA: EVA Case Study: Real-Time Data Boosts Sales Promotions
 Success story · Case StudiesEuropean Bank: Use Advanced Analytics to Reduce Low-Quality Apps
 Success story · Case StudiesTour Marketplace: Build Cross-Platform Analytics for Large-Scale Marketplace
 Success story · Case StudiesSEMrush: Raw Facebook Ads Data: SEMrush's Strategy to Maximize ROI
 Success story · Case StudiesFxPro: Monitoring Web Data Quality: FxPro Case Study
 Success story · Case StudiesDigital Agency: Automating Ad Campaign Reports for a Digital Agency
 Success story · Case StudiesPigu Group: A Pigu Group Case Study on Driving Real-Time Sales
 Success story · Case StudiesFabelio: Fabelio Case Study: Merging Online and Offline Customers
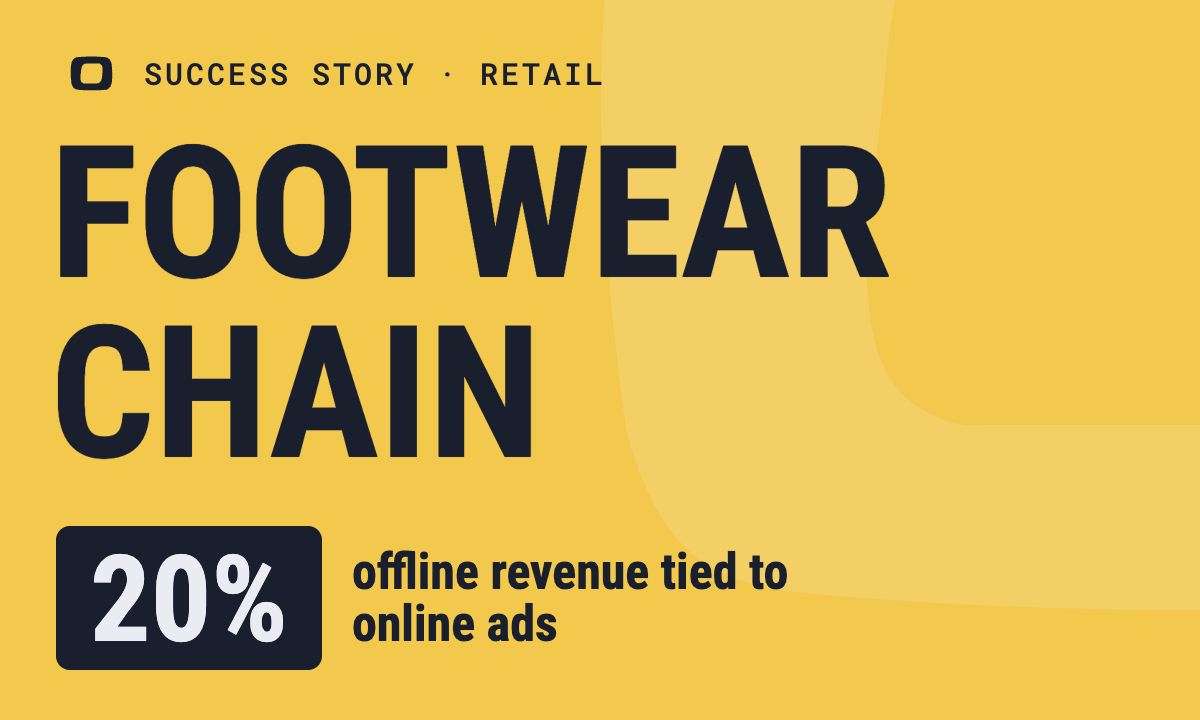 Success story · Case StudiesFootwear Chain: Identifying ROPO: Online Influence on Offline Purchases
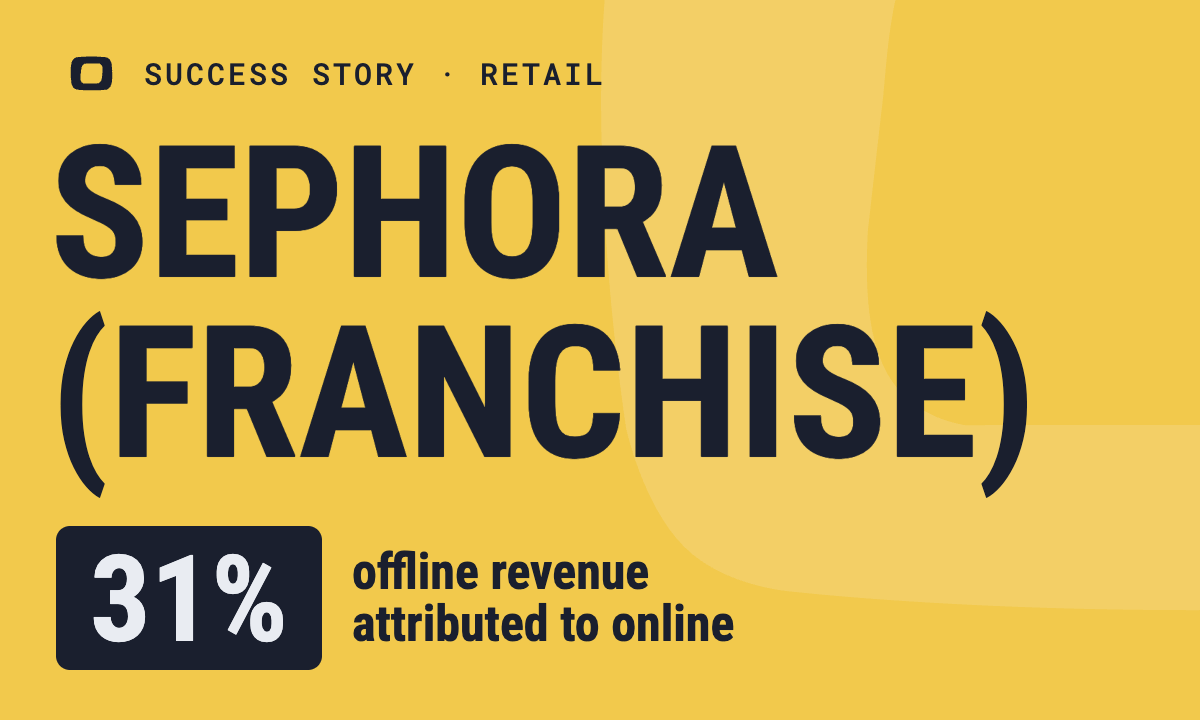 Success story · Case StudiesSephora (franchise): Evaluating ROPO Analysis in Omnichannel Marketing Analytics
 Success story · Case StudiesMatahariMall: Evaluate Ads in 1 Report and Save 4 Hours Daily
 Success story · Case StudiesCOMFY: Set up Marketing Analytics
 Success story · Case StudiesMedical Clinic Chain: Increase ROI 2.5x and Cut Ad Costs in Half
 Success story · Case StudiesElectronics Retailer: Boost Sales & Loyalty by Fixing Checkout Errors
 Success story · Case StudiesIQ Option: Google Ads: Assisted Conversions Analysis by IQ Option
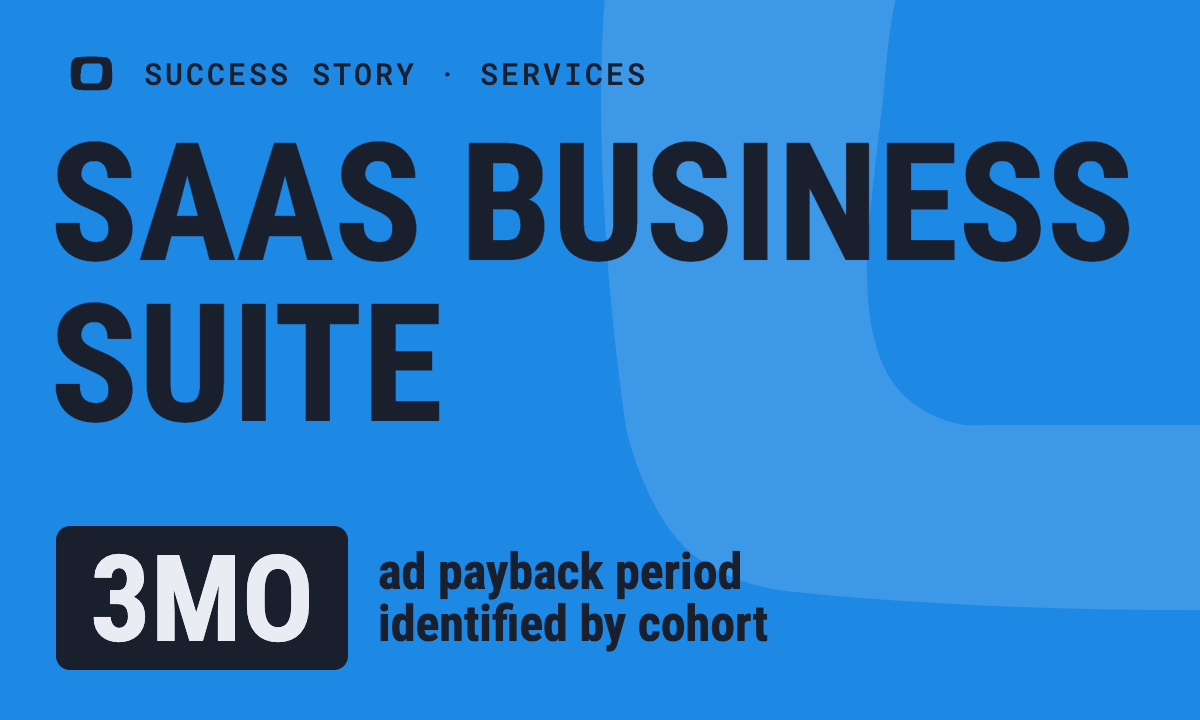 Success story · Case StudiesSaaS Business Suite: Ad Performance with Customer Cohort Analysis
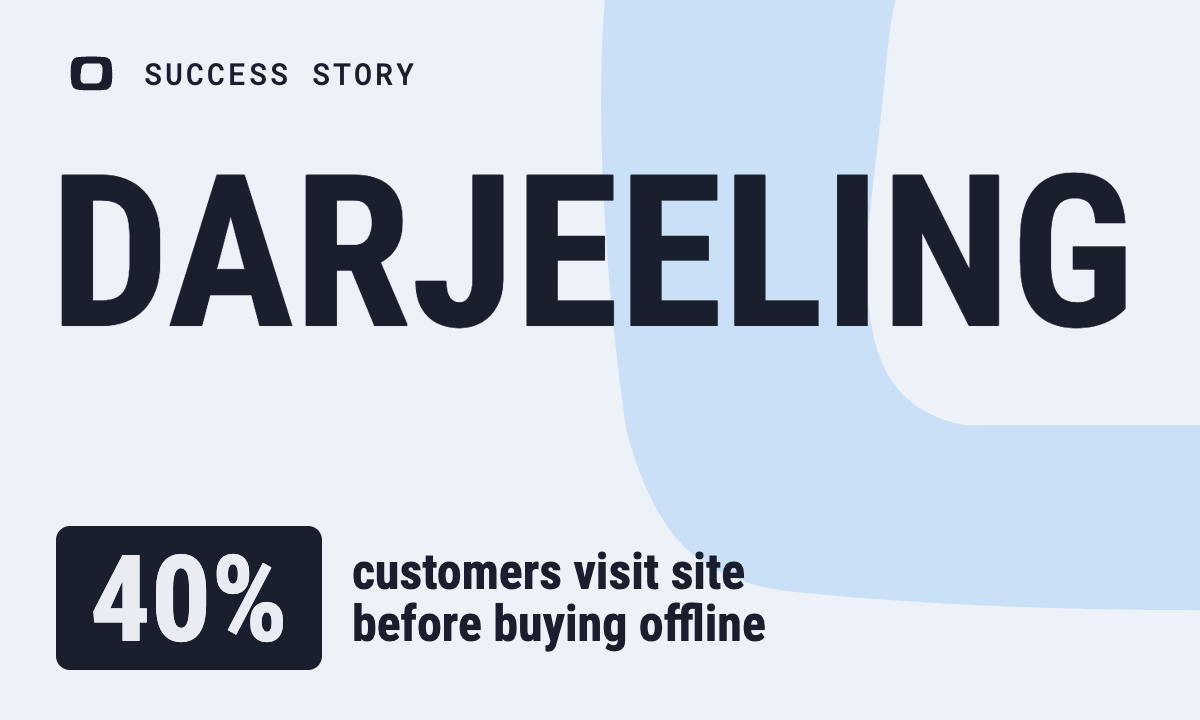 Success story · Case StudiesDarjeeling: ROPO Analysis for Ecommerce
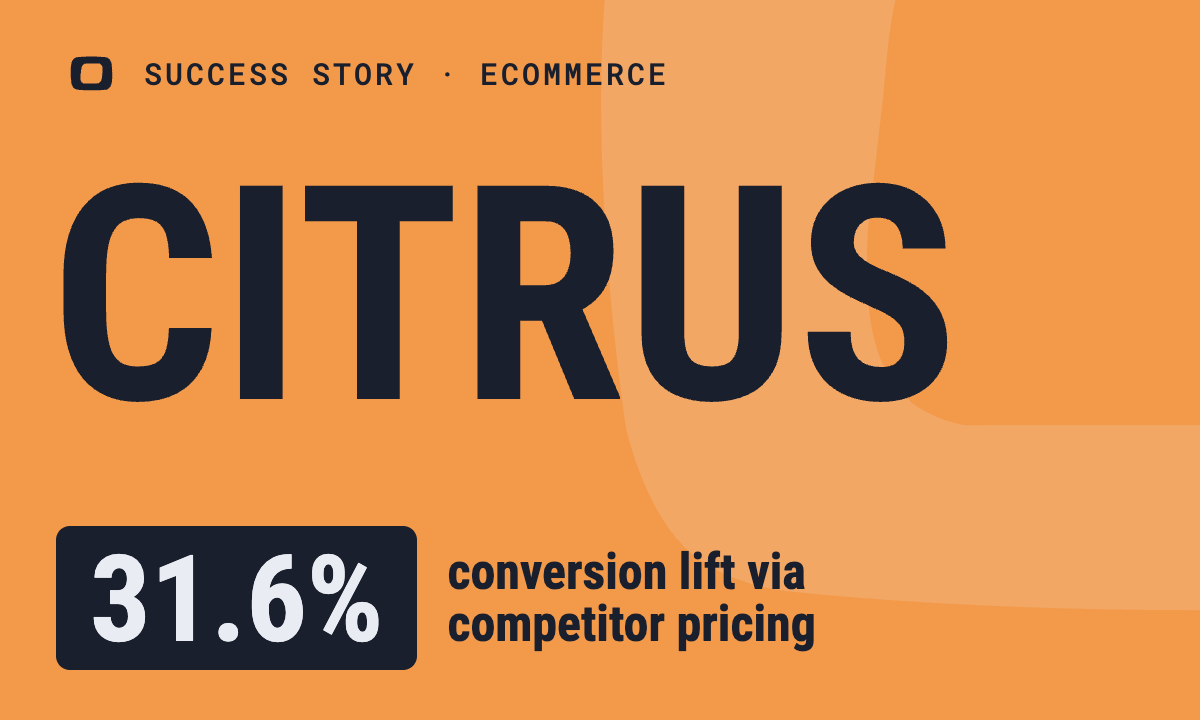 Success story · Case StudiesCitrus: Competitors’ Prices Impact Sales: Citrus Success
 Success story · Case StudiesConsumer Electronics Chain: Measuring ROPO for an Omnichannel Retail
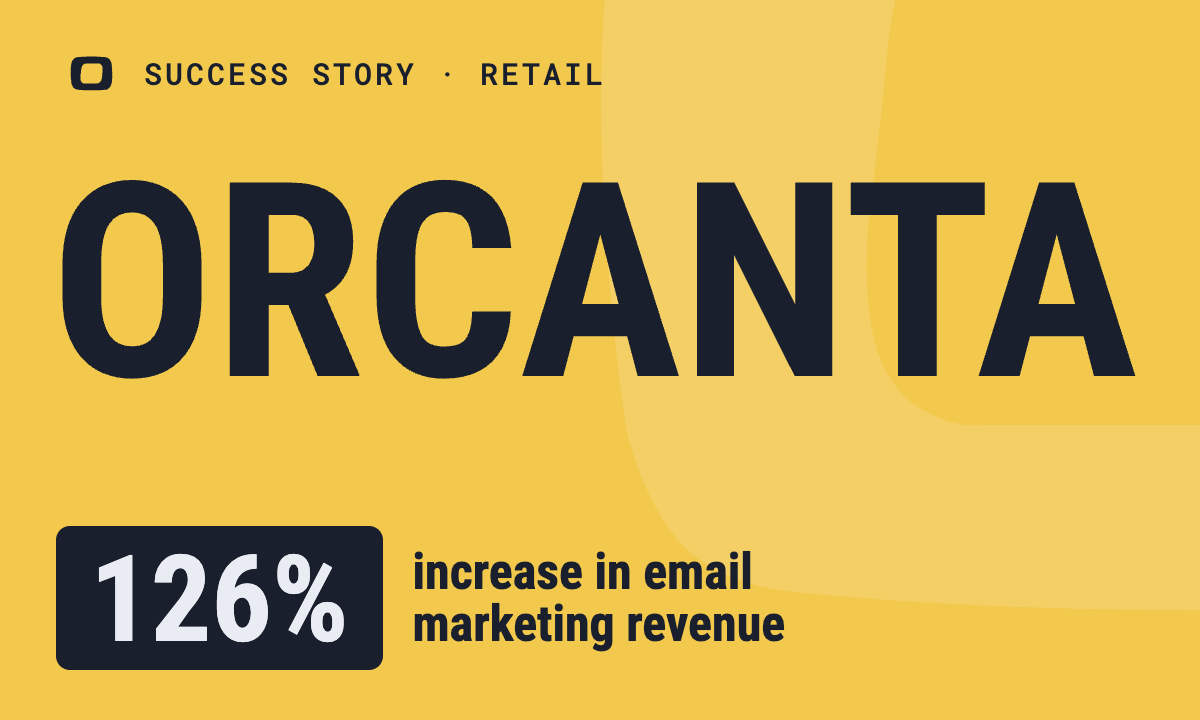 Success story · Case StudiesOrcanta: Orcanta Case Study: Boosting Email Marketing Revenue by 126%
 Success story · Case StudiesHVAC Retailer: How to Improve Advertising-to-Sales Ratio by 10%
 Success story · Case StudiesTravel Agency: 15% Email Conversion Rate for Travel Agencies
 Success story · Case StudiesAnswear: The Answear Success Story of Increasing Revenue by OWOX
 Success story · Case Studiesboodmo: Evaluating Acquisition Channels and LTV via Cohort Analysis
 Success story · Case StudiesConsumer Electronics Retailer: Optimizing Ad Campaigns Using Assisted Conversions
 Success story · Case StudiesContentmart: Contentmart's Customer Journey: A Success Story by OWOX
 Success story · Case StudiesRozetka: Rozetka: 9% AOV & 18% Marketing Revenue Growth
 Success story · Case StudiesSEMrush: Optimize Sales Funnels for Better Conversion Rates
 Success story · Case StudiesBooking Service: Boost Revenue by Cutting Ad Costs for Bookings
 GlossaryData Glossary
 GlossaryWhat is Metabase? Features & Use Cases
…
You are booked. The invitation is on its way to , with the calendar invite and the meeting link.